Investment Analysis and Portfolio Management: CBA & A2 Milk Co. Ltd.
VerifiedAdded on 2023/06/07
|20
|4793
|104
Report
AI Summary
This report presents a comprehensive investment analysis comparing the Commonwealth Bank of Australia (CBA) and The A2 Milk Co. Ltd. The analysis includes a financial evaluation using ratio analysis to assess profitability, liquidity, efficiency, and capital structure, alongside a strategic analysis considering external factors like trade wars and ethical behavior. Profitability ratios such as return on total assets, return on equity, gross profit margin, and net profit margin are calculated and compared for both companies, revealing A2M's superior profitability. Liquidity ratios indicate A2M's stronger short-term debt payment ability. Efficiency ratios highlight A2M's better asset management, while capital structure ratios suggest CBA's more optimal capital management. The report also touches on the strategic positioning of both companies within their respective markets, considering the impact of global events and ethical considerations. Desklib provides this report and many other solved assignments to aid students in their studies.
Running Head: Investment Analysis and Portfolio Management
1
Project Report: Investment Analysis and Portfolio Management
1
Project Report: Investment Analysis and Portfolio Management
Paraphrase This Document
Need a fresh take? Get an instant paraphrase of this document with our AI Paraphraser
Investment Analysis and Portfolio Management
2
Contents
Introduction.......................................................................................................................3
Financial analysis..............................................................................................................3
Strategic analysis............................................................................................................10
COMMONWEALTH BANK OF AUSTRALIA.......................................................10
THE A2 MILK CO LTD............................................................................................11
Trade war effect..............................................................................................................11
Ethical behavior..............................................................................................................12
Conclusion......................................................................................................................12
References.......................................................................................................................14
Appendix.........................................................................................................................16
Investment Analysis and Portfolio Management
3
Introduction:
Investment analysis is a wide approach which encompasses various factors of a
business in terms of investment. It could include evaluation of past financial statement and
past return from a business to forecast the future returns and performance of the business.
Selection on the type of investment such as equity, bond or debt is also important for the
investors (Kurth, 2013). It depends upon the choice and needs of the investors. Investment
analysis could help the business to determine that how the business would likely to perform
in the future and whether it is suitable for the investors or not.
In investment analysis, various tools are used by the analyst to identify the future
prediction about the performance and position of the business. It measures the financial
position, stock position, external factors of the business, strategically position of the business
etc to reach over a conclusion that whether the investment into the company is a good choice
or not. It also offers the suggestion about the buy or sells the security in the market.
Financial analysis:
Financial analysis is a tool to evaluate the financial transaction, performance and
position of a business in order to get an outcome about the investment and financial strategies
of the business. This analysis tool makes it easier for the investors to make an outcome about
the sell or buy the stock of the company. “Ratio analysis” is one of the important tools of
financial analysis to identify the profitability, liquidity, solvency, efficiency etc position of
the business (Krantz, 2016). Ratio analysis of both the companies is as follows:
Profitability ratios:
Profitability ratios are part of ratio analysis which evaluates the profit generation
ability of a business. It evaluates the total profit of the business and forecast the future
performance of the business.
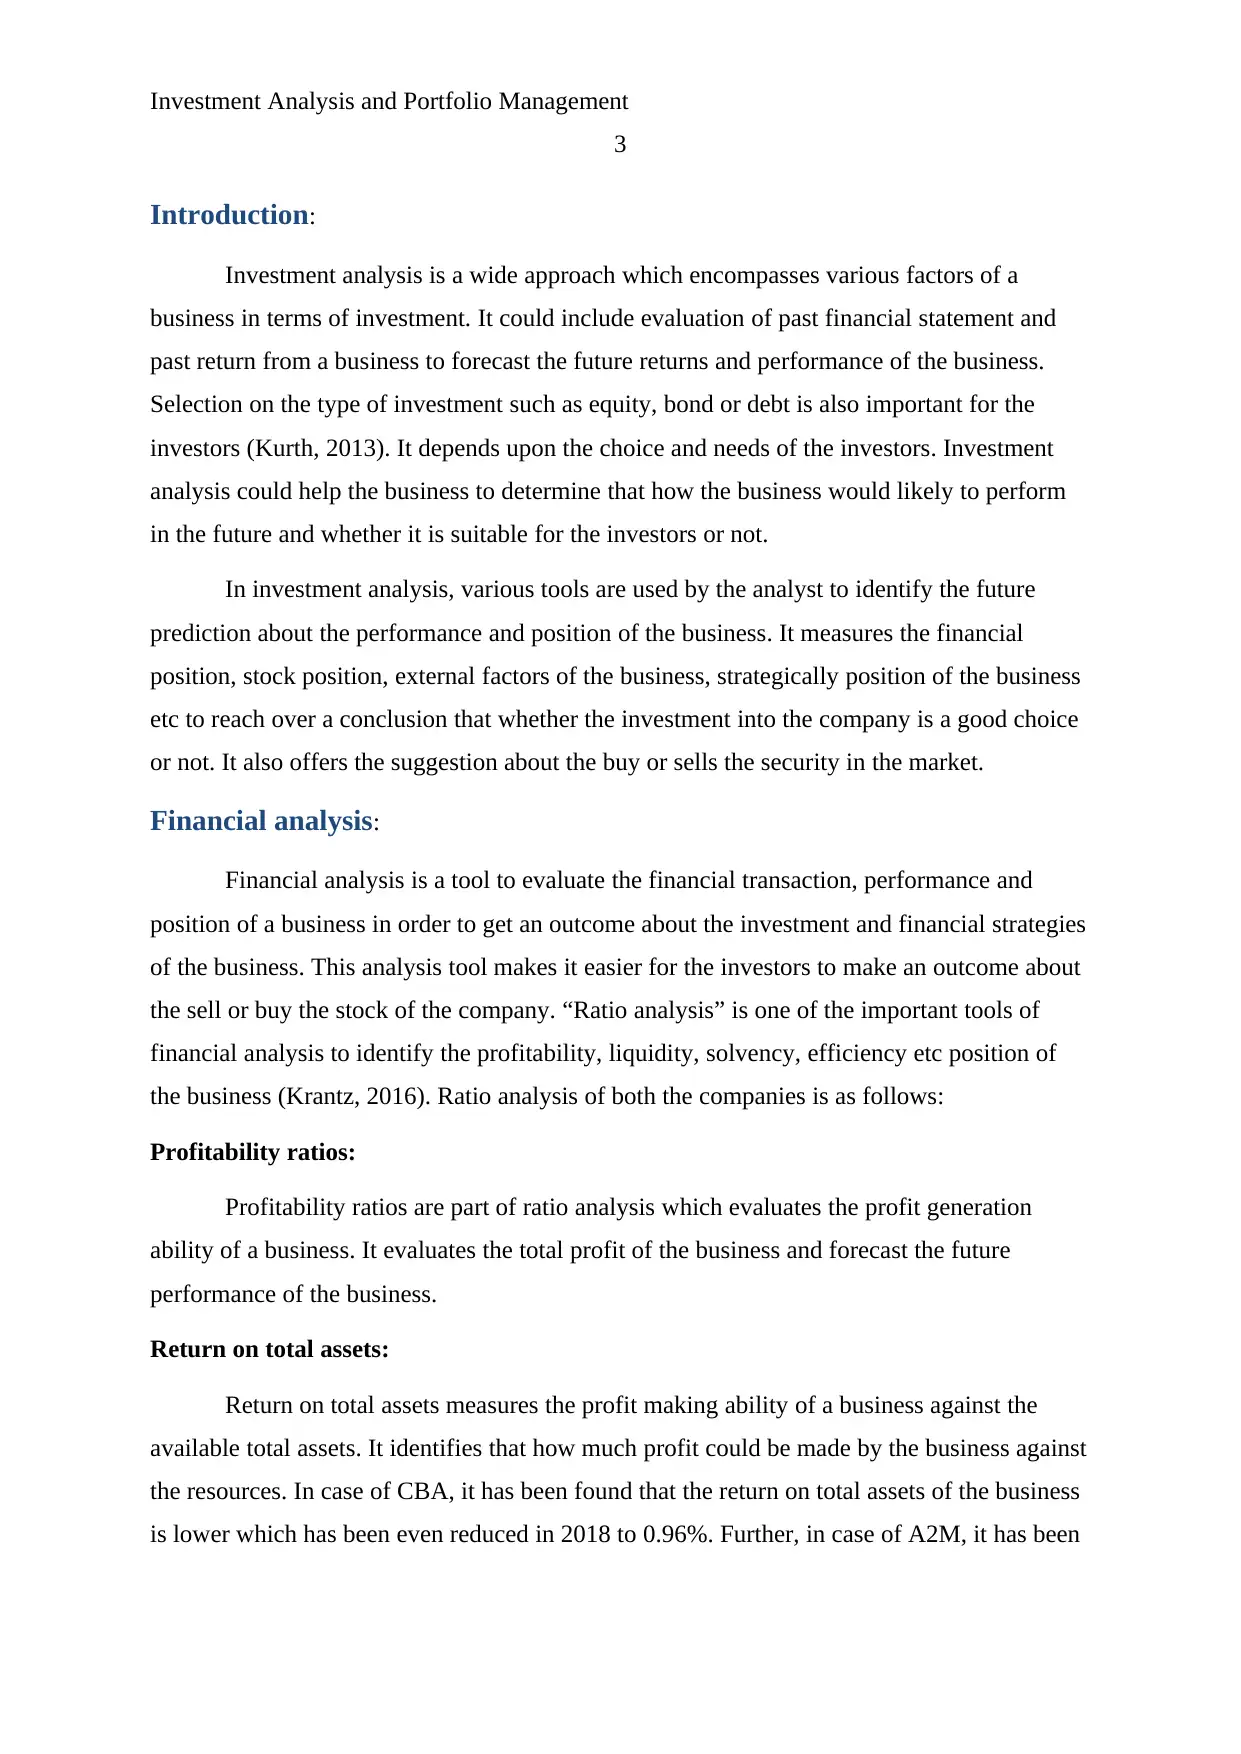
Return on total assets:
Return on total assets measures the profit making ability of a business against the
available total assets. It identifies that how much profit could be made by the business against
the resources. In case of CBA, it has been found that the return on total assets of the business
is lower which has been even reduced in 2018 to 0.96%. Further, in case of A2M, it has been
3
Introduction:
Investment analysis is a wide approach which encompasses various factors of a
business in terms of investment. It could include evaluation of past financial statement and
past return from a business to forecast the future returns and performance of the business.
Selection on the type of investment such as equity, bond or debt is also important for the
investors (Kurth, 2013). It depends upon the choice and needs of the investors. Investment
analysis could help the business to determine that how the business would likely to perform
in the future and whether it is suitable for the investors or not.
In investment analysis, various tools are used by the analyst to identify the future
prediction about the performance and position of the business. It measures the financial
position, stock position, external factors of the business, strategically position of the business
etc to reach over a conclusion that whether the investment into the company is a good choice
or not. It also offers the suggestion about the buy or sells the security in the market.
Financial analysis:
Financial analysis is a tool to evaluate the financial transaction, performance and
position of a business in order to get an outcome about the investment and financial strategies
of the business. This analysis tool makes it easier for the investors to make an outcome about
the sell or buy the stock of the company. “Ratio analysis” is one of the important tools of
financial analysis to identify the profitability, liquidity, solvency, efficiency etc position of
the business (Krantz, 2016). Ratio analysis of both the companies is as follows:
Profitability ratios:
Profitability ratios are part of ratio analysis which evaluates the profit generation
ability of a business. It evaluates the total profit of the business and forecast the future
performance of the business.
Return on total assets:
Return on total assets measures the profit making ability of a business against the
available total assets. It identifies that how much profit could be made by the business against
the resources. In case of CBA, it has been found that the return on total assets of the business
is lower which has been even reduced in 2018 to 0.96%. Further, in case of A2M, it has been
⊘ This is a preview!⊘
Do you want full access?
Subscribe today to unlock all pages.
Trusted by 1+ million students worldwide
Investment Analysis and Portfolio Management
4
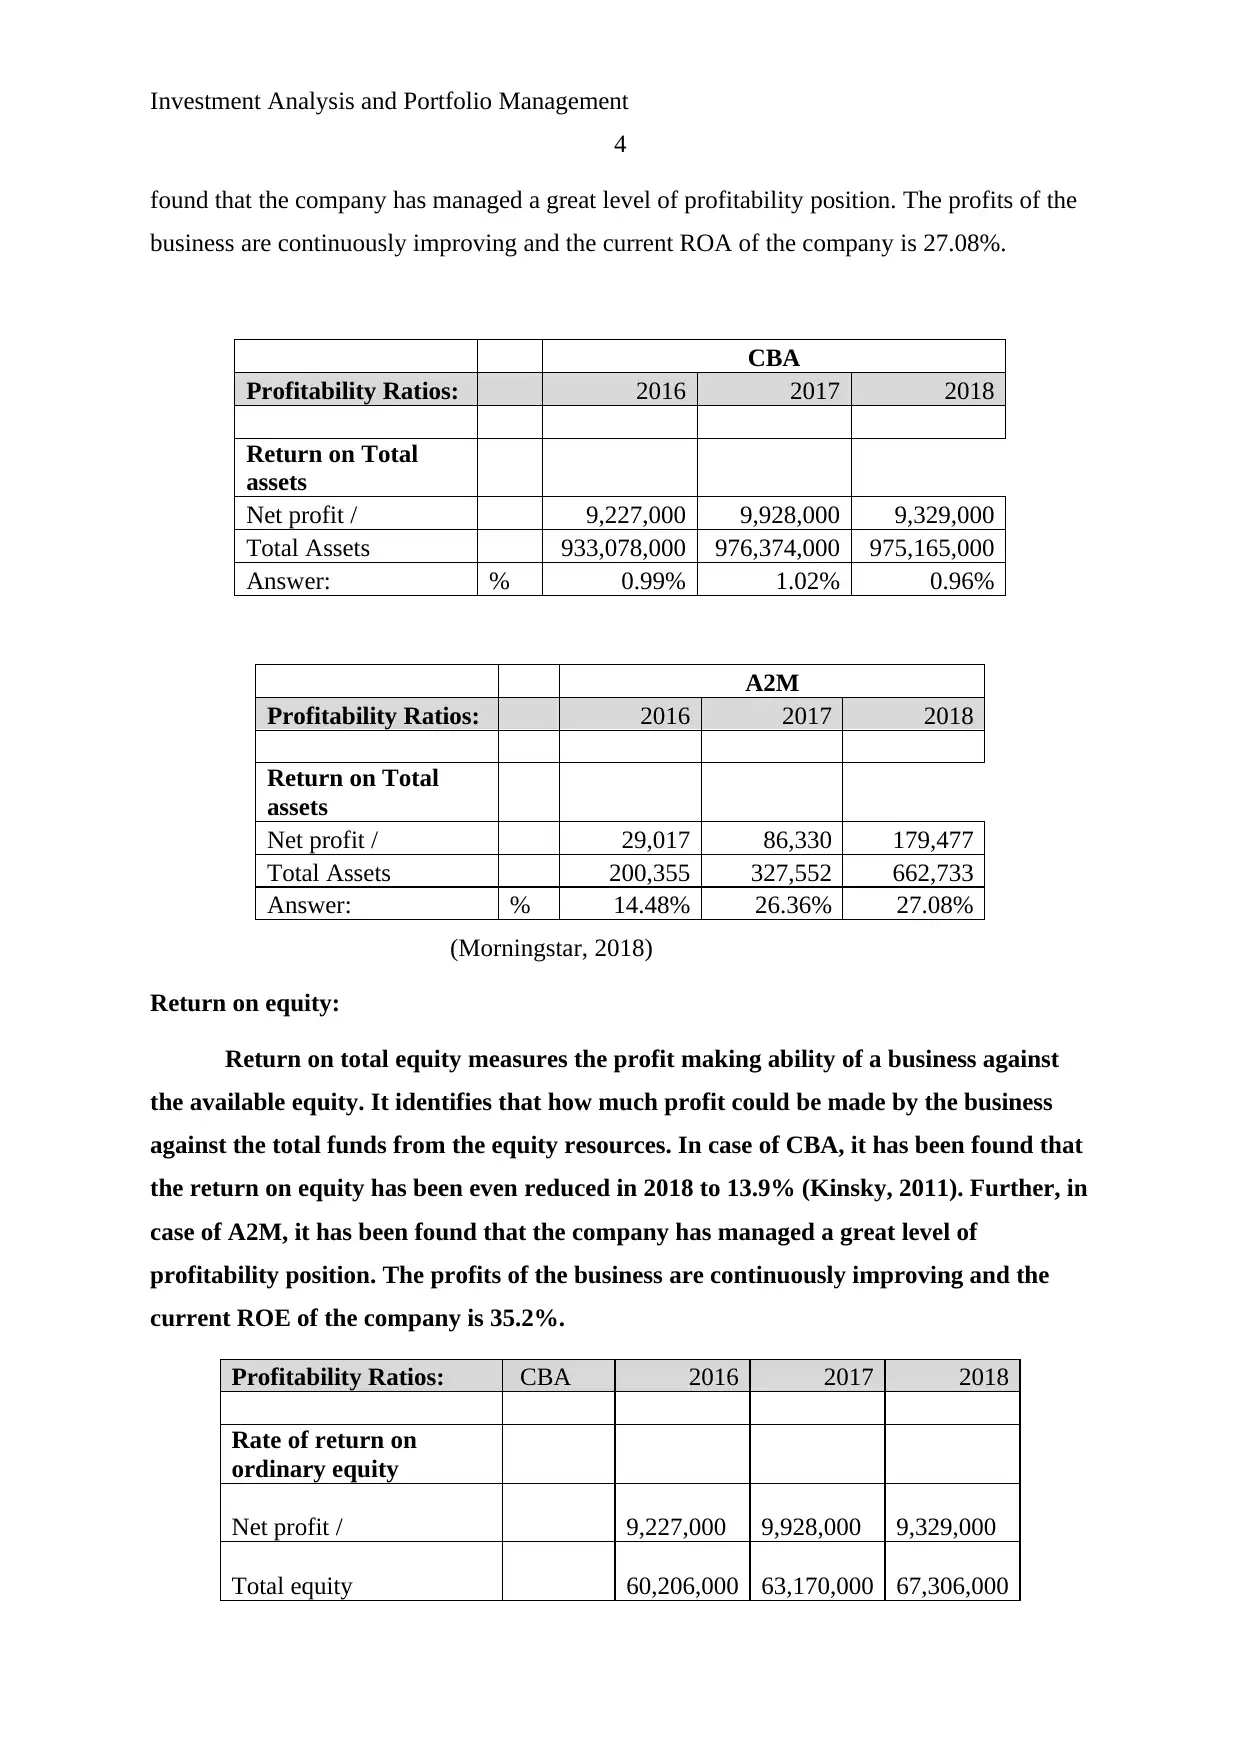
found that the company has managed a great level of profitability position. The profits of the
business are continuously improving and the current ROA of the company is 27.08%.
CBA
Profitability Ratios: 2016 2017 2018
Return on Total
assets
Net profit / 9,227,000 9,928,000 9,329,000
Total Assets 933,078,000 976,374,000 975,165,000
Answer: % 0.99% 1.02% 0.96%
A2M
Profitability Ratios: 2016 2017 2018
Return on Total
assets
Net profit / 29,017 86,330 179,477
Total Assets 200,355 327,552 662,733
Answer: % 14.48% 26.36% 27.08%
(Morningstar, 2018)
Return on equity:
Return on total equity measures the profit making ability of a business against
the available equity. It identifies that how much profit could be made by the business
against the total funds from the equity resources. In case of CBA, it has been found that
the return on equity has been even reduced in 2018 to 13.9% (Kinsky, 2011). Further, in
case of A2M, it has been found that the company has managed a great level of
profitability position. The profits of the business are continuously improving and the
current ROE of the company is 35.2%.
Profitability Ratios: CBA 2016 2017 2018
Rate of return on
ordinary equity
Net profit / 9,227,000 9,928,000 9,329,000
Total equity 60,206,000 63,170,000 67,306,000
4
found that the company has managed a great level of profitability position. The profits of the
business are continuously improving and the current ROA of the company is 27.08%.
CBA
Profitability Ratios: 2016 2017 2018
Return on Total
assets
Net profit / 9,227,000 9,928,000 9,329,000
Total Assets 933,078,000 976,374,000 975,165,000
Answer: % 0.99% 1.02% 0.96%
A2M
Profitability Ratios: 2016 2017 2018
Return on Total
assets
Net profit / 29,017 86,330 179,477
Total Assets 200,355 327,552 662,733
Answer: % 14.48% 26.36% 27.08%
(Morningstar, 2018)
Return on equity:
Return on total equity measures the profit making ability of a business against
the available equity. It identifies that how much profit could be made by the business
against the total funds from the equity resources. In case of CBA, it has been found that
the return on equity has been even reduced in 2018 to 13.9% (Kinsky, 2011). Further, in
case of A2M, it has been found that the company has managed a great level of
profitability position. The profits of the business are continuously improving and the
current ROE of the company is 35.2%.
Profitability Ratios: CBA 2016 2017 2018
Rate of return on
ordinary equity
Net profit / 9,227,000 9,928,000 9,329,000
Total equity 60,206,000 63,170,000 67,306,000
Paraphrase This Document
Need a fresh take? Get an instant paraphrase of this document with our AI Paraphraser
Investment Analysis and Portfolio Management
5
Answer: 15.3% 15.7% 13.9%
A2M
Profitability Ratios: 2016 2017 2018
Rate of return on
ordinary equity
Net profit / 29,017 86,330 179,477
Total equity 126,874 229,983 509,684
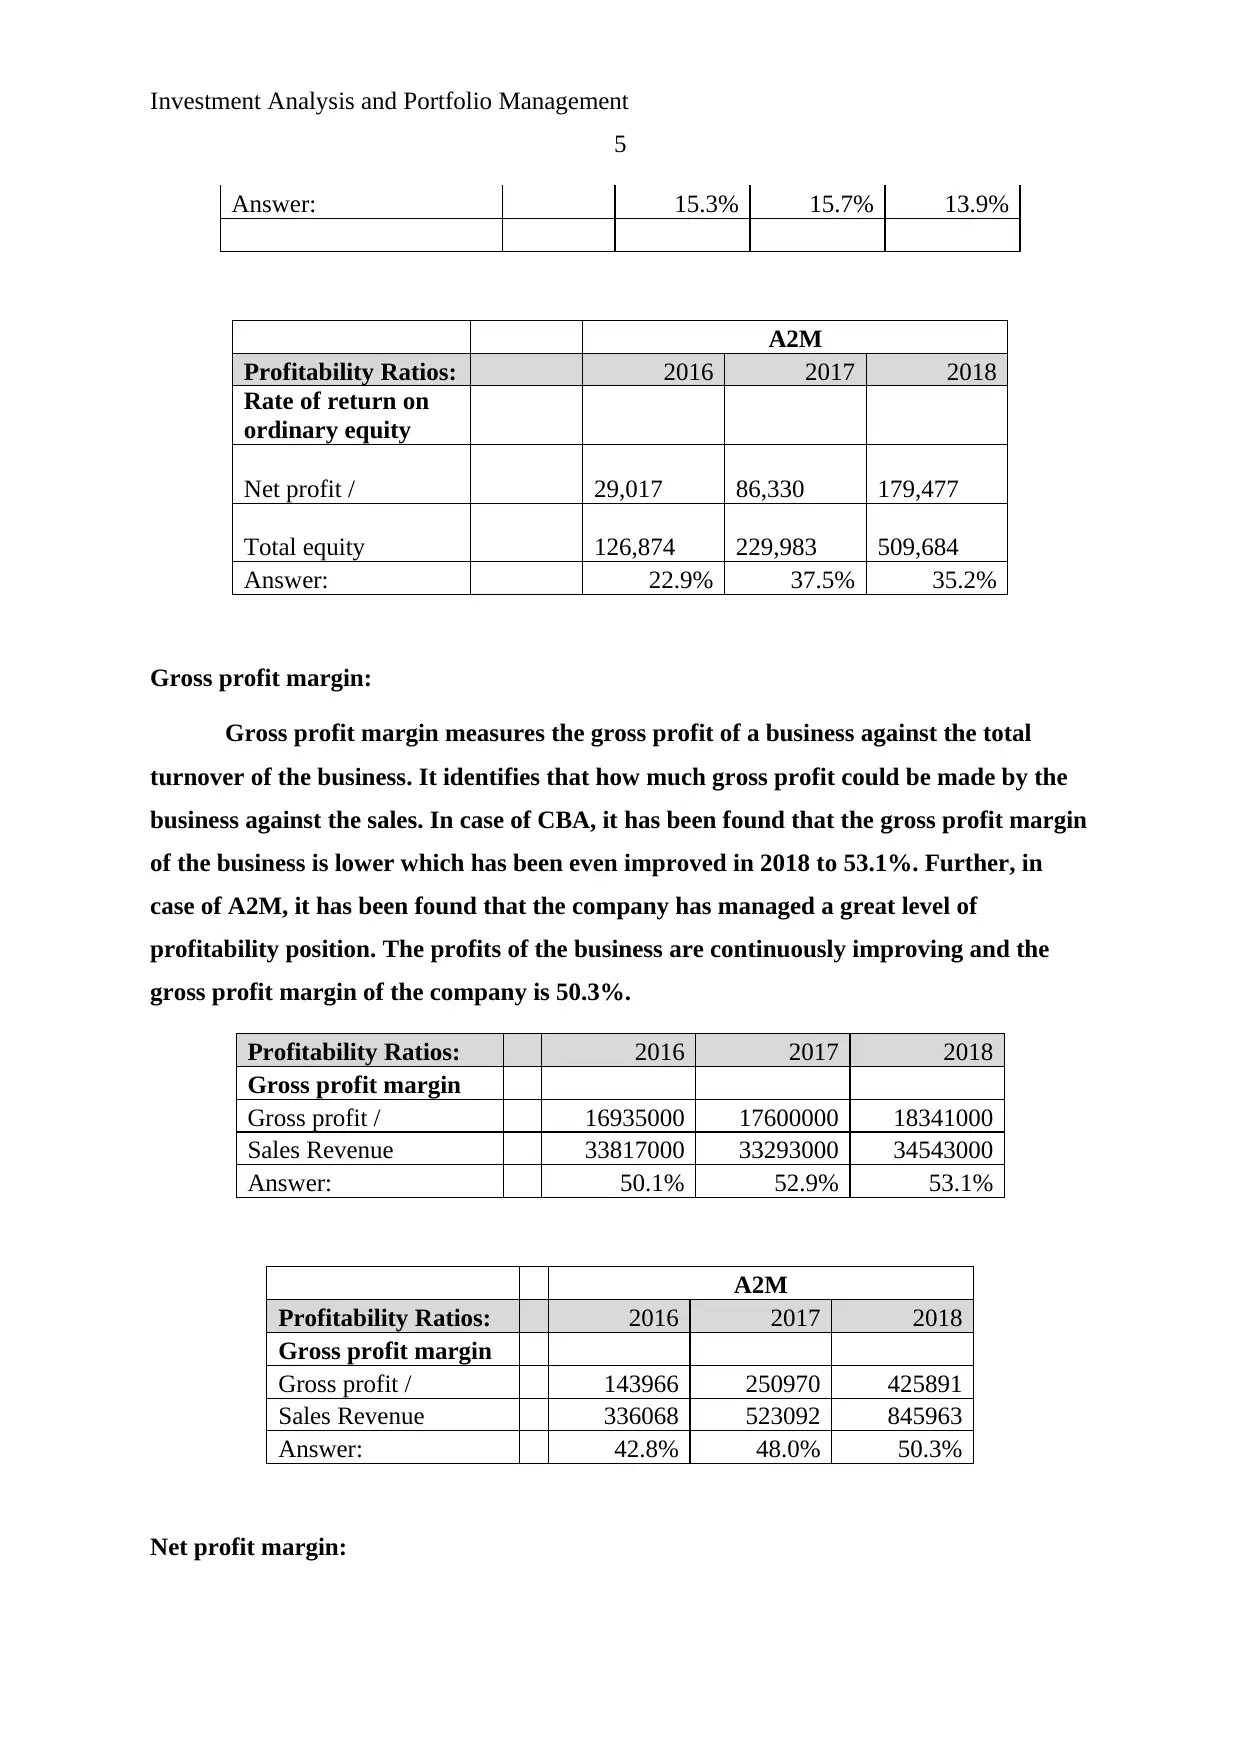
Answer: 22.9% 37.5% 35.2%
Gross profit margin:
Gross profit margin measures the gross profit of a business against the total
turnover of the business. It identifies that how much gross profit could be made by the
business against the sales. In case of CBA, it has been found that the gross profit margin
of the business is lower which has been even improved in 2018 to 53.1%. Further, in
case of A2M, it has been found that the company has managed a great level of
profitability position. The profits of the business are continuously improving and the
gross profit margin of the company is 50.3%.
Profitability Ratios: 2016 2017 2018
Gross profit margin
Gross profit / 16935000 17600000 18341000
Sales Revenue 33817000 33293000 34543000
Answer: 50.1% 52.9% 53.1%
A2M
Profitability Ratios: 2016 2017 2018
Gross profit margin
Gross profit / 143966 250970 425891
Sales Revenue 336068 523092 845963
Answer: 42.8% 48.0% 50.3%
Net profit margin:
5
Answer: 15.3% 15.7% 13.9%
A2M
Profitability Ratios: 2016 2017 2018
Rate of return on
ordinary equity
Net profit / 29,017 86,330 179,477
Total equity 126,874 229,983 509,684
Answer: 22.9% 37.5% 35.2%
Gross profit margin:
Gross profit margin measures the gross profit of a business against the total
turnover of the business. It identifies that how much gross profit could be made by the
business against the sales. In case of CBA, it has been found that the gross profit margin
of the business is lower which has been even improved in 2018 to 53.1%. Further, in
case of A2M, it has been found that the company has managed a great level of
profitability position. The profits of the business are continuously improving and the
gross profit margin of the company is 50.3%.
Profitability Ratios: 2016 2017 2018
Gross profit margin
Gross profit / 16935000 17600000 18341000
Sales Revenue 33817000 33293000 34543000
Answer: 50.1% 52.9% 53.1%
A2M
Profitability Ratios: 2016 2017 2018
Gross profit margin
Gross profit / 143966 250970 425891
Sales Revenue 336068 523092 845963
Answer: 42.8% 48.0% 50.3%
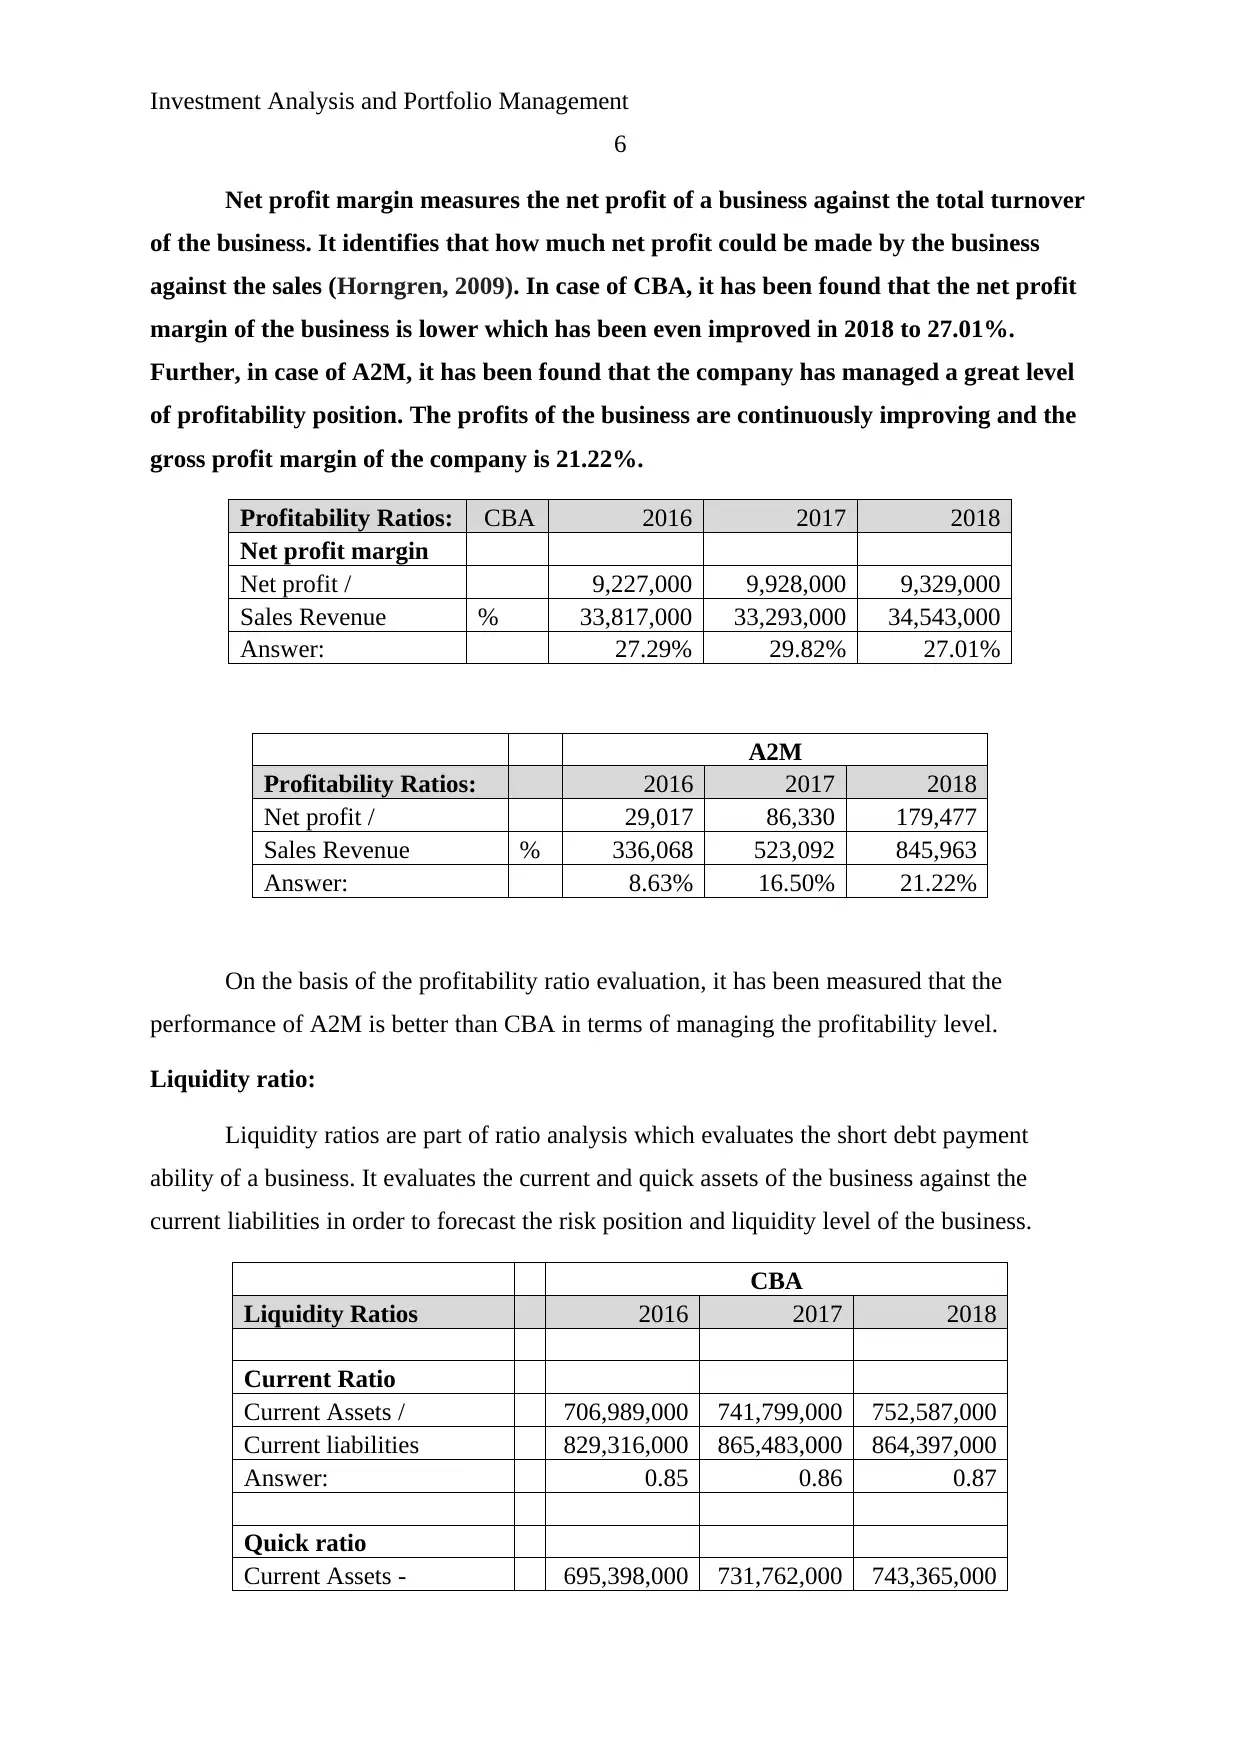
Net profit margin:
Investment Analysis and Portfolio Management
6
Net profit margin measures the net profit of a business against the total turnover
of the business. It identifies that how much net profit could be made by the business
against the sales (Horngren, 2009). In case of CBA, it has been found that the net profit
margin of the business is lower which has been even improved in 2018 to 27.01%.
Further, in case of A2M, it has been found that the company has managed a great level
of profitability position. The profits of the business are continuously improving and the
gross profit margin of the company is 21.22%.
Profitability Ratios: CBA 2016 2017 2018
Net profit margin
Net profit / 9,227,000 9,928,000 9,329,000
Sales Revenue % 33,817,000 33,293,000 34,543,000
Answer: 27.29% 29.82% 27.01%
A2M
Profitability Ratios: 2016 2017 2018
Net profit / 29,017 86,330 179,477
Sales Revenue % 336,068 523,092 845,963
Answer: 8.63% 16.50% 21.22%
On the basis of the profitability ratio evaluation, it has been measured that the
performance of A2M is better than CBA in terms of managing the profitability level.
Liquidity ratio:
Liquidity ratios are part of ratio analysis which evaluates the short debt payment
ability of a business. It evaluates the current and quick assets of the business against the
current liabilities in order to forecast the risk position and liquidity level of the business.
CBA
Liquidity Ratios 2016 2017 2018
Current Ratio
Current Assets / 706,989,000 741,799,000 752,587,000
Current liabilities 829,316,000 865,483,000 864,397,000
Answer: 0.85 0.86 0.87
Quick ratio
Current Assets - 695,398,000 731,762,000 743,365,000
⊘ This is a preview!⊘
Do you want full access?
Subscribe today to unlock all pages.
Trusted by 1+ million students worldwide
Investment Analysis and Portfolio Management
7
Inventory /
Current Liabilities 829,316,000 865,483,000 864,397,000
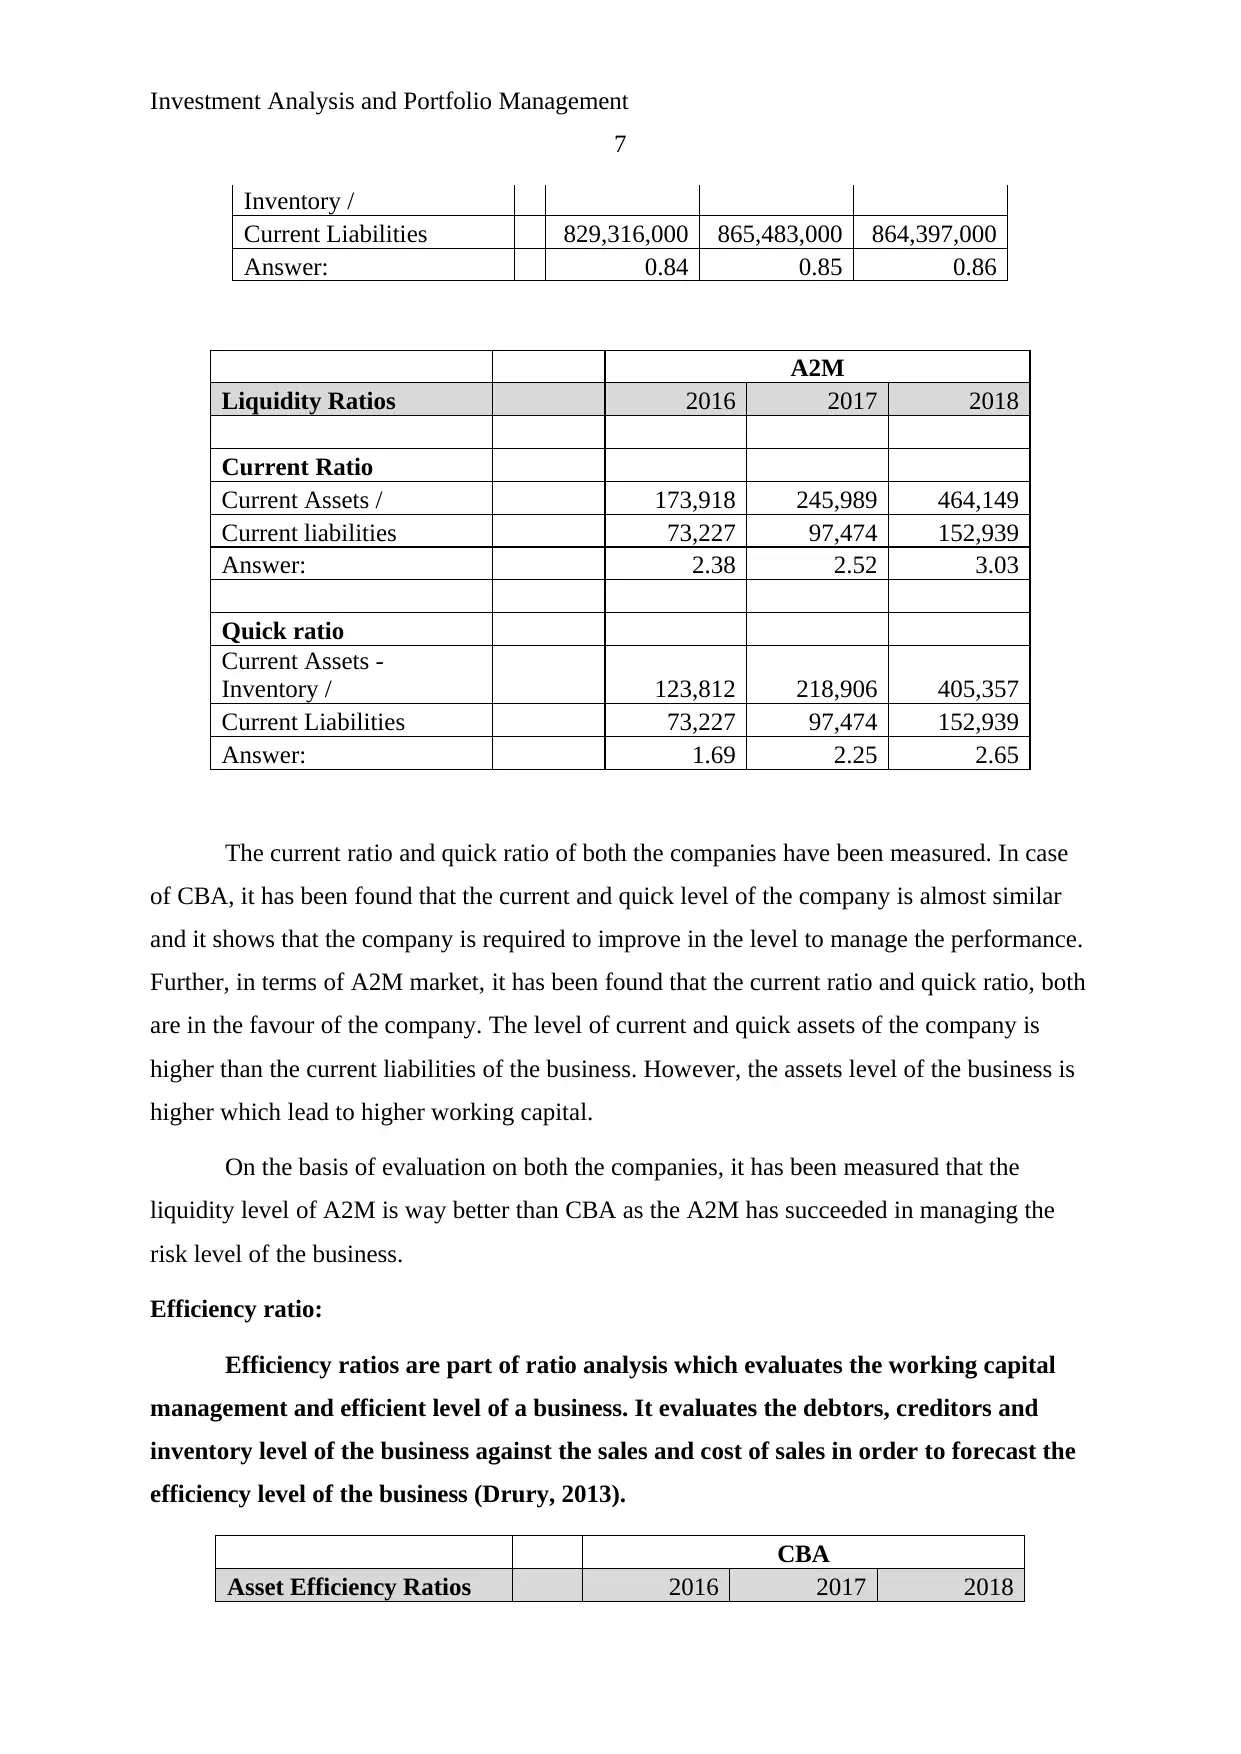
Answer: 0.84 0.85 0.86
A2M
Liquidity Ratios 2016 2017 2018
Current Ratio
Current Assets / 173,918 245,989 464,149
Current liabilities 73,227 97,474 152,939
Answer: 2.38 2.52 3.03
Quick ratio
Current Assets -
Inventory / 123,812 218,906 405,357
Current Liabilities 73,227 97,474 152,939
Answer: 1.69 2.25 2.65
The current ratio and quick ratio of both the companies have been measured. In case
of CBA, it has been found that the current and quick level of the company is almost similar
and it shows that the company is required to improve in the level to manage the performance.
Further, in terms of A2M market, it has been found that the current ratio and quick ratio, both
are in the favour of the company. The level of current and quick assets of the company is
higher than the current liabilities of the business. However, the assets level of the business is
higher which lead to higher working capital.
On the basis of evaluation on both the companies, it has been measured that the
liquidity level of A2M is way better than CBA as the A2M has succeeded in managing the
risk level of the business.
Efficiency ratio:
Efficiency ratios are part of ratio analysis which evaluates the working capital
management and efficient level of a business. It evaluates the debtors, creditors and
inventory level of the business against the sales and cost of sales in order to forecast the
efficiency level of the business (Drury, 2013).
CBA
Asset Efficiency Ratios 2016 2017 2018
7
Inventory /
Current Liabilities 829,316,000 865,483,000 864,397,000
Answer: 0.84 0.85 0.86
A2M
Liquidity Ratios 2016 2017 2018
Current Ratio
Current Assets / 173,918 245,989 464,149
Current liabilities 73,227 97,474 152,939
Answer: 2.38 2.52 3.03
Quick ratio
Current Assets -
Inventory / 123,812 218,906 405,357
Current Liabilities 73,227 97,474 152,939
Answer: 1.69 2.25 2.65
The current ratio and quick ratio of both the companies have been measured. In case
of CBA, it has been found that the current and quick level of the company is almost similar
and it shows that the company is required to improve in the level to manage the performance.
Further, in terms of A2M market, it has been found that the current ratio and quick ratio, both
are in the favour of the company. The level of current and quick assets of the company is
higher than the current liabilities of the business. However, the assets level of the business is
higher which lead to higher working capital.
On the basis of evaluation on both the companies, it has been measured that the
liquidity level of A2M is way better than CBA as the A2M has succeeded in managing the
risk level of the business.
Efficiency ratio:
Efficiency ratios are part of ratio analysis which evaluates the working capital
management and efficient level of a business. It evaluates the debtors, creditors and
inventory level of the business against the sales and cost of sales in order to forecast the
efficiency level of the business (Drury, 2013).
CBA
Asset Efficiency Ratios 2016 2017 2018
Paraphrase This Document
Need a fresh take? Get an instant paraphrase of this document with our AI Paraphraser

Investment Analysis and Portfolio Management
8
Inventory Turnover
(days)
Average Inventory / 11,591,000 10,037,000 9,222,000
Cost of Sales
#
days 16,935,000 17,600,000 18,341,000
Answer: (note the above
needs to be x 365) 249.82 208.15 183.52
Receivables Turnover
(days)
Average trade debtors /
11,591,00
0
10,037,00
0
9,222,00
0
Sales revenue (note used
operating revenue)
#
days
103,762,00
0
110,891,00
0
110,768,00
0
Answer: (note the above
needs to be x 365) 40.77 33.04 30.39
A2M
Asset Efficiency Ratios 2016 2017 2018
Inventory Turnover (days)
Average Inventory / 50,106 27,083 58,792
Cost of Sales
#
days 192,102 272,123 420,072
Answer: (note the above needs
to be x 365) 95.20 36.33 51.08
Receivables Turnover (days)
Average trade debtors /
42,63
5
65,54
1
54,88
0
Sales revenue (note used
operating revenue)
#
days
127,12
8
230,07
8
509,79
4
Answer: (note the above needs
to be x 365) 122.41 103.98 39.29
The inventory turnover and receivable turnover ratio of both the companies have been
measured. In case of CBA, it has been found that the company has been reduced the days of
inventory turnover and debtor’s turnover to manage the working capital and improve the cash
conversion cycle of the business. Further, in terms of A2M market, it has been found that the
8
Inventory Turnover
(days)
Average Inventory / 11,591,000 10,037,000 9,222,000
Cost of Sales
#
days 16,935,000 17,600,000 18,341,000
Answer: (note the above
needs to be x 365) 249.82 208.15 183.52
Receivables Turnover
(days)
Average trade debtors /
11,591,00
0
10,037,00
0
9,222,00
0
Sales revenue (note used
operating revenue)
#
days
103,762,00
0
110,891,00
0
110,768,00
0
Answer: (note the above
needs to be x 365) 40.77 33.04 30.39
A2M
Asset Efficiency Ratios 2016 2017 2018
Inventory Turnover (days)
Average Inventory / 50,106 27,083 58,792
Cost of Sales
#
days 192,102 272,123 420,072
Answer: (note the above needs
to be x 365) 95.20 36.33 51.08
Receivables Turnover (days)
Average trade debtors /
42,63
5
65,54
1
54,88
0
Sales revenue (note used
operating revenue)
#
days
127,12
8
230,07
8
509,79
4
Answer: (note the above needs
to be x 365) 122.41 103.98 39.29
The inventory turnover and receivable turnover ratio of both the companies have been
measured. In case of CBA, it has been found that the company has been reduced the days of
inventory turnover and debtor’s turnover to manage the working capital and improve the cash
conversion cycle of the business. Further, in terms of A2M market, it has been found that the
Investment Analysis and Portfolio Management
9
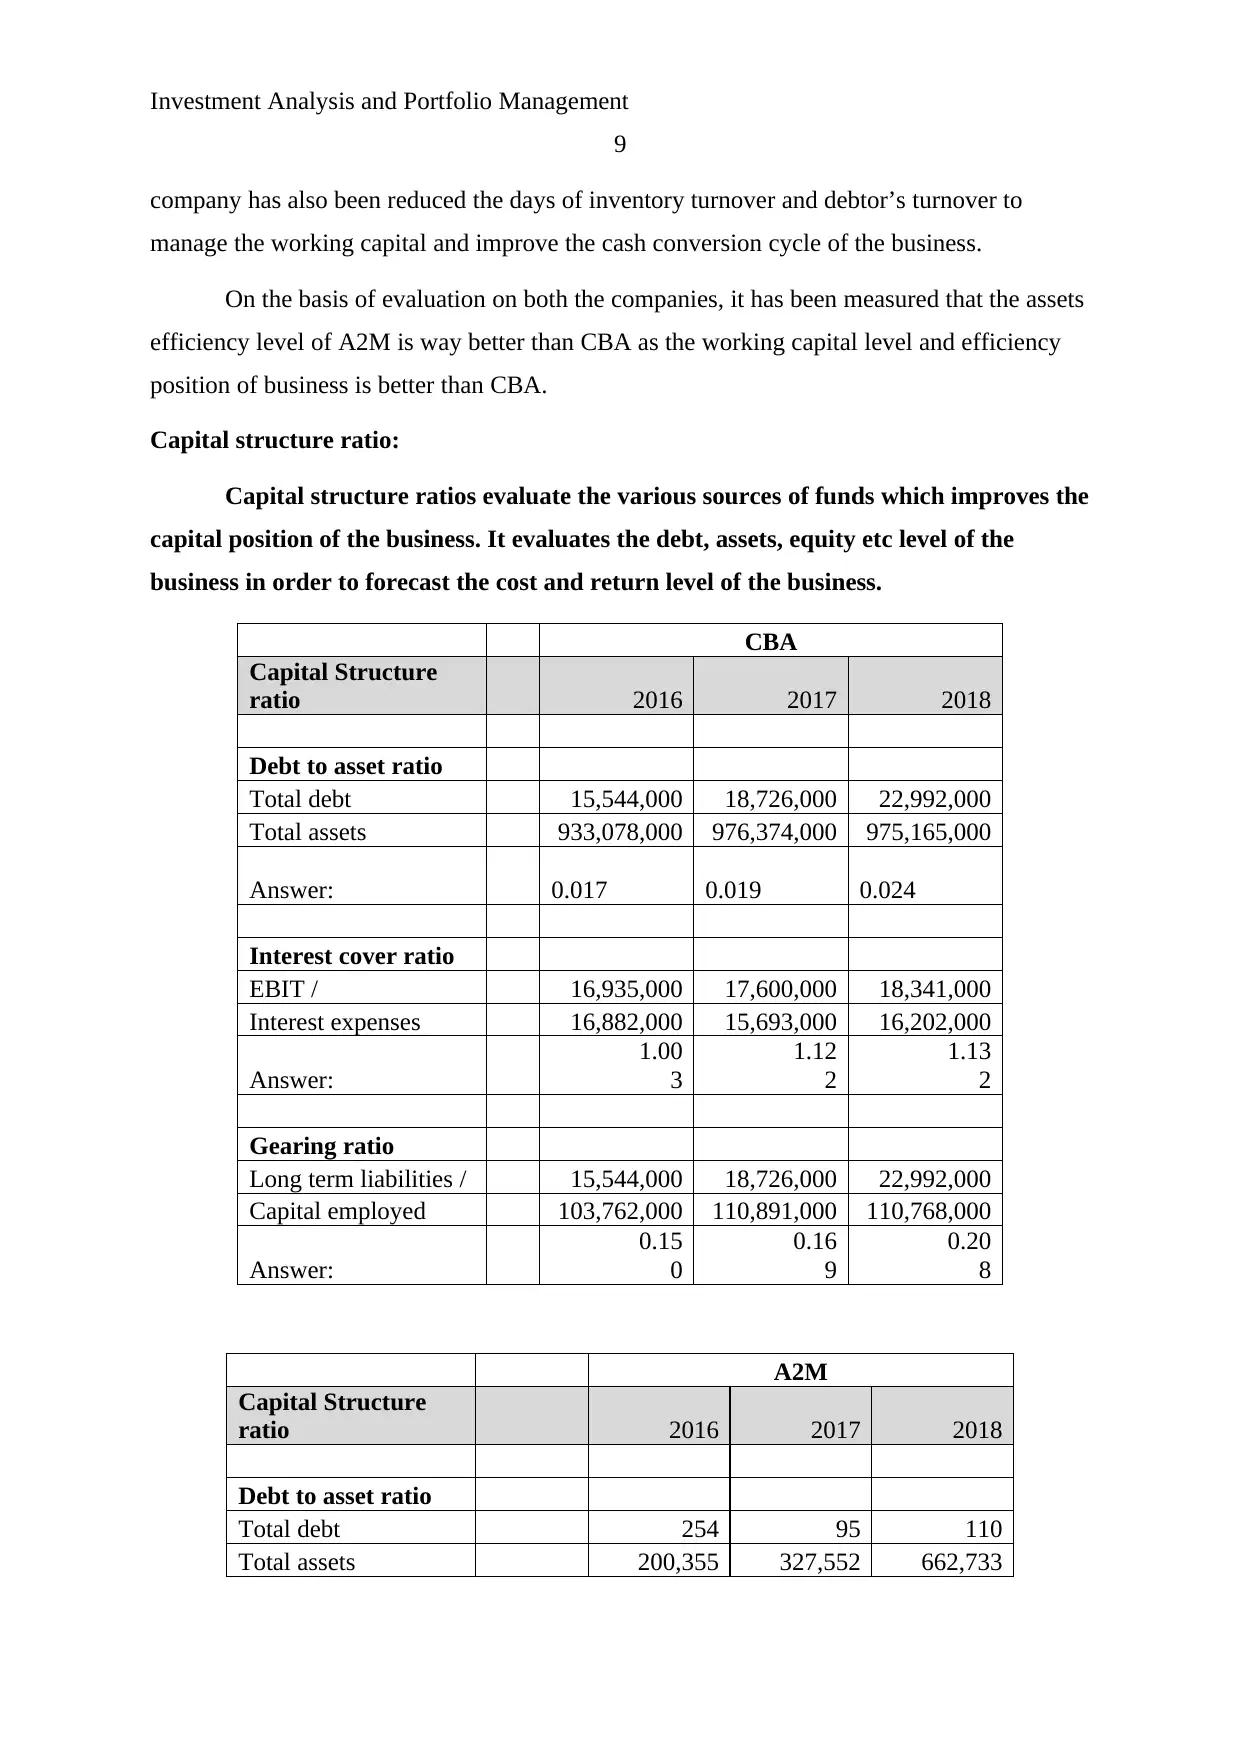
company has also been reduced the days of inventory turnover and debtor’s turnover to
manage the working capital and improve the cash conversion cycle of the business.
On the basis of evaluation on both the companies, it has been measured that the assets
efficiency level of A2M is way better than CBA as the working capital level and efficiency
position of business is better than CBA.
Capital structure ratio:
Capital structure ratios evaluate the various sources of funds which improves the
capital position of the business. It evaluates the debt, assets, equity etc level of the
business in order to forecast the cost and return level of the business.
CBA
Capital Structure
ratio 2016 2017 2018
Debt to asset ratio
Total debt 15,544,000 18,726,000 22,992,000
Total assets 933,078,000 976,374,000 975,165,000
Answer: 0.017 0.019 0.024
Interest cover ratio
EBIT / 16,935,000 17,600,000 18,341,000
Interest expenses 16,882,000 15,693,000 16,202,000
Answer:
1.00
3
1.12
2
1.13
2
Gearing ratio
Long term liabilities / 15,544,000 18,726,000 22,992,000
Capital employed 103,762,000 110,891,000 110,768,000
Answer:
0.15
0
0.16
9
0.20
8
A2M
Capital Structure
ratio 2016 2017 2018
Debt to asset ratio
Total debt 254 95 110
Total assets 200,355 327,552 662,733
9
company has also been reduced the days of inventory turnover and debtor’s turnover to
manage the working capital and improve the cash conversion cycle of the business.
On the basis of evaluation on both the companies, it has been measured that the assets
efficiency level of A2M is way better than CBA as the working capital level and efficiency
position of business is better than CBA.
Capital structure ratio:
Capital structure ratios evaluate the various sources of funds which improves the
capital position of the business. It evaluates the debt, assets, equity etc level of the
business in order to forecast the cost and return level of the business.
CBA
Capital Structure
ratio 2016 2017 2018
Debt to asset ratio
Total debt 15,544,000 18,726,000 22,992,000
Total assets 933,078,000 976,374,000 975,165,000
Answer: 0.017 0.019 0.024
Interest cover ratio
EBIT / 16,935,000 17,600,000 18,341,000
Interest expenses 16,882,000 15,693,000 16,202,000
Answer:
1.00
3
1.12
2
1.13
2
Gearing ratio
Long term liabilities / 15,544,000 18,726,000 22,992,000
Capital employed 103,762,000 110,891,000 110,768,000
Answer:
0.15
0
0.16
9
0.20
8
A2M
Capital Structure
ratio 2016 2017 2018
Debt to asset ratio
Total debt 254 95 110
Total assets 200,355 327,552 662,733
⊘ This is a preview!⊘
Do you want full access?
Subscribe today to unlock all pages.
Trusted by 1+ million students worldwide
Investment Analysis and Portfolio Management
10
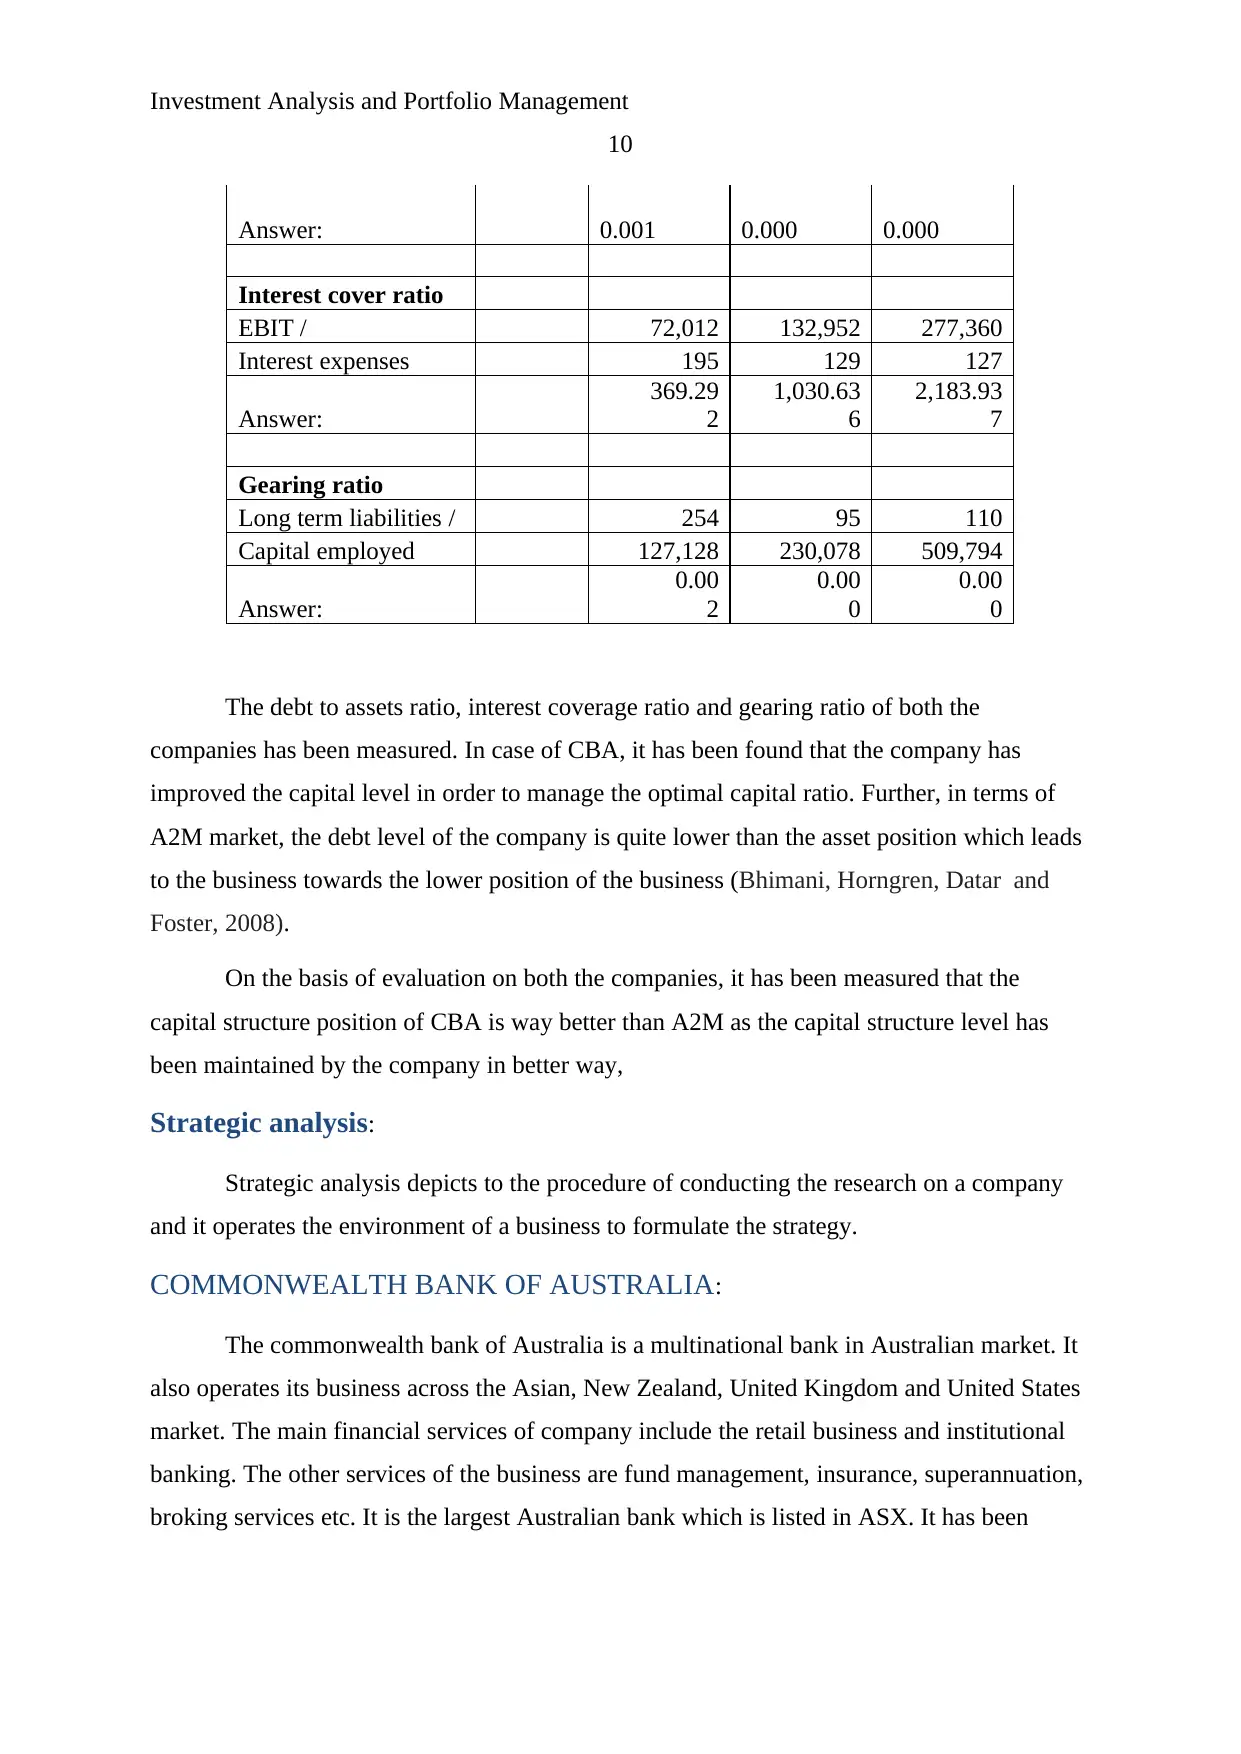
Answer: 0.001 0.000 0.000
Interest cover ratio
EBIT / 72,012 132,952 277,360
Interest expenses 195 129 127
Answer:
369.29
2
1,030.63
6
2,183.93
7
Gearing ratio
Long term liabilities / 254 95 110
Capital employed 127,128 230,078 509,794
Answer:
0.00
2
0.00
0
0.00
0
The debt to assets ratio, interest coverage ratio and gearing ratio of both the
companies has been measured. In case of CBA, it has been found that the company has
improved the capital level in order to manage the optimal capital ratio. Further, in terms of
A2M market, the debt level of the company is quite lower than the asset position which leads
to the business towards the lower position of the business (Bhimani, Horngren, Datar and
Foster, 2008).
On the basis of evaluation on both the companies, it has been measured that the
capital structure position of CBA is way better than A2M as the capital structure level has
been maintained by the company in better way,
Strategic analysis:
Strategic analysis depicts to the procedure of conducting the research on a company
and it operates the environment of a business to formulate the strategy.
COMMONWEALTH BANK OF AUSTRALIA:
The commonwealth bank of Australia is a multinational bank in Australian market. It
also operates its business across the Asian, New Zealand, United Kingdom and United States
market. The main financial services of company include the retail business and institutional
banking. The other services of the business are fund management, insurance, superannuation,
broking services etc. It is the largest Australian bank which is listed in ASX. It has been
10
Answer: 0.001 0.000 0.000
Interest cover ratio
EBIT / 72,012 132,952 277,360
Interest expenses 195 129 127
Answer:
369.29
2
1,030.63
6
2,183.93
7
Gearing ratio
Long term liabilities / 254 95 110
Capital employed 127,128 230,078 509,794
Answer:
0.00
2
0.00
0
0.00
0
The debt to assets ratio, interest coverage ratio and gearing ratio of both the
companies has been measured. In case of CBA, it has been found that the company has
improved the capital level in order to manage the optimal capital ratio. Further, in terms of
A2M market, the debt level of the company is quite lower than the asset position which leads
to the business towards the lower position of the business (Bhimani, Horngren, Datar and
Foster, 2008).
On the basis of evaluation on both the companies, it has been measured that the
capital structure position of CBA is way better than A2M as the capital structure level has
been maintained by the company in better way,
Strategic analysis:
Strategic analysis depicts to the procedure of conducting the research on a company
and it operates the environment of a business to formulate the strategy.
COMMONWEALTH BANK OF AUSTRALIA:
The commonwealth bank of Australia is a multinational bank in Australian market. It
also operates its business across the Asian, New Zealand, United Kingdom and United States
market. The main financial services of company include the retail business and institutional
banking. The other services of the business are fund management, insurance, superannuation,
broking services etc. It is the largest Australian bank which is listed in ASX. It has been
Paraphrase This Document
Need a fresh take? Get an instant paraphrase of this document with our AI Paraphraser
Investment Analysis and Portfolio Management
11
founded in 1911 by the Australian government (Home, 2018). In 1996, it has been fully
privatised. Headquarter of the business is in Darling Harbour, Sydney, Australia.
The strategic analysis of CBA has been measured and it has been found that the main
strength of the business is that bank owns various branches, bank is operating its business
into various countries, bank is among the four major banks, revenue and profits of the
business are also higher etc. The main weakness of the business is financial strength rating,
banks’ involvement in various controversies, loan impairment expenses etc. (Morningstar,
2018).
The main opportunity of the business is implementation of technology, initiative such
as “one common bank” and expansion of services in Asian market and long term growth in
the business etc. And the threat of the business is investor’s confidence in the global
economy, huge risk in foreign exchange rates etc.
THE A2 MILK CO LTD:
The A2 MILK CO LTD is a multinational company in Australian market. It operates
its business across the Australia, New Zealand, United States of America, United Kingdom
and China. The main product of the business is A2 milk, infant formula, dairy etc. It mainly
focuses on the milk related products like infant formula (Home, 2018). It has been founded in
2000 in New Zealand. Headquarter of the business is in Sydney, Australia.
The strategic analysis of A2M has been measured and it has been found that the main
strength of the business is highly skilled workforce, strong dealer community, strong free
cash flow, successful track record, reliable suppliers, superb performance in the market, high
level of customer satisfaction etc. The main weakness of the business is limited success
outside the core business, high attraction rate in labour, worst profitability rate, gaps in the
product range etc. (Ackert and Deaves, 2009).
The main opportunity of the business is decreasing the cost of transpiration due to the
slower shipping prices, stable free cash flow, new environment policies, lower inflation rate,
new taxation policy, market development etc. And the threat of the business is raising pay,
liability laws, new technologies, increased trend, no regular supply etc.
Trade war effect:
Investment Analysis and Portfolio Management
12
The trade war of Australian market has been identified and it has been found that the
Trump government has tried to reduce the trade with Australian market so that the
economical performance of the business could be reduced. Because of this, few changes have
occurred into the trade position (SMH, 2018). However, it has not impacted much on the
performance of the business.
On the basis of the trade war analysis, the equity analysis of the Australian market has
been done and it has been concluded that the trade war has not impacted much on the
Australian equity market. The performance of the market is still better because of the
diversity of the exported market of Australia (Garrison, Noreen, Brewer and McGowan,
2010). However, the investors are required to identify the business’s activity market. If the
business is operating into various markets than the equity investment into that business is a
better choice for the market.
It becomes important for the investor to identify that whether the business is operating
its business in the US market, if yes, than how much impact of trade war has been done on
the Australian market (Elton, Gruber, Brown and Goetzmann, 2009). On the basis of the
analysis, investors are suggested to check the activity market of the business and make
decision.
Ethical behavior:
Fund managers and the professionals are required to embrace an ethical approach
towards their work. Ethics in the fund management industry is a straight forward affair. It has
been agreed that fund managers must act in the best interest of the clients as there is no
shortage of legislation and rules in the fund management industry (Hansen, Mowen and
Guan, 2007).
It is expected from the fund professionals to give better advices to the related parties
about the investment into equity or assets in an ethical way. The main principle of ethics in
fund management industry is to offer fair information to the investors so that they could make
better decision about the performance of the business. A recent report of CFA institute has
shown that the trust level of investors on the financial professionals have improved from 50%
in 2016 to 61% in 2018 (Funds Europe, 2018). It leads to the discussion that the transparency
has been improved in the industry which leads to the better performance of the business.
⊘ This is a preview!⊘
Do you want full access?
Subscribe today to unlock all pages.
Trusted by 1+ million students worldwide
1 out of 20
Related Documents


Your All-in-One AI-Powered Toolkit for Academic Success.
+13062052269
info@desklib.com
Available 24*7 on WhatsApp / Email
![[object Object]](/_next/static/media/star-bottom.7253800d.svg)
Unlock your academic potential
Copyright © 2020–2025 A2Z Services. All Rights Reserved. Developed and managed by ZUCOL.