Investment Appraisal Assignment
VerifiedAdded on 2022/08/13
|15
|1817
|41
AI Summary
Contribute Materials
Your contribution can guide someone’s learning journey. Share your
documents today.

Investment Appraisal
Secure Best Marks with AI Grader
Need help grading? Try our AI Grader for instant feedback on your assignments.
INVESTMENT 1
TASK
1.
NPV
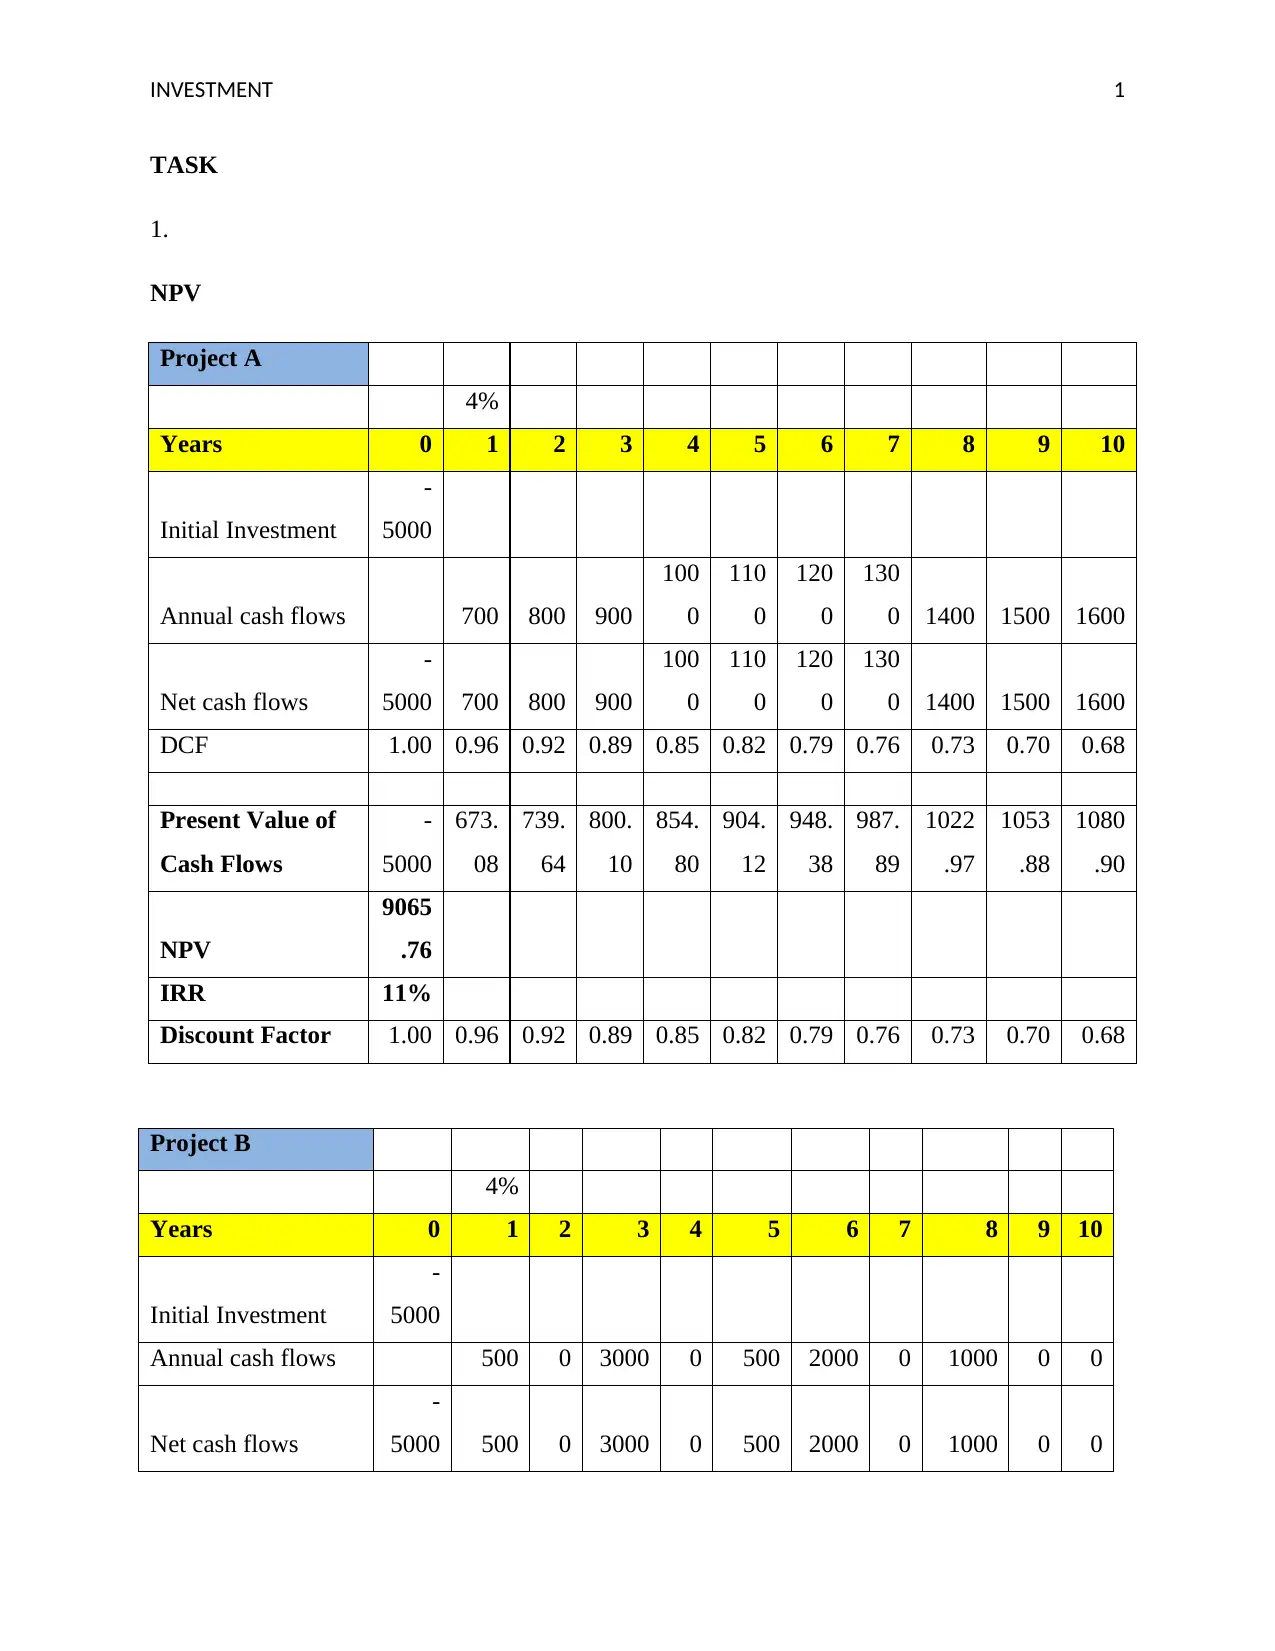
Project A
4%
Years 0 1 2 3 4 5 6 7 8 9 10
Initial Investment
-
5000
Annual cash flows 700 800 900
100
0
110
0
120
0
130
0 1400 1500 1600
Net cash flows
-
5000 700 800 900
100
0
110
0
120
0
130
0 1400 1500 1600
DCF 1.00 0.96 0.92 0.89 0.85 0.82 0.79 0.76 0.73 0.70 0.68
Present Value of
Cash Flows
-
5000
673.
08
739.
64
800.
10
854.
80
904.
12
948.
38
987.
89
1022
.97
1053
.88
1080
.90
NPV
9065
.76
IRR 11%
Discount Factor 1.00 0.96 0.92 0.89 0.85 0.82 0.79 0.76 0.73 0.70 0.68
Project B
4%
Years 0 1 2 3 4 5 6 7 8 9 10
Initial Investment
-
5000
Annual cash flows 500 0 3000 0 500 2000 0 1000 0 0
Net cash flows
-
5000 500 0 3000 0 500 2000 0 1000 0 0
TASK
1.
NPV
Project A
4%
Years 0 1 2 3 4 5 6 7 8 9 10
Initial Investment
-
5000
Annual cash flows 700 800 900
100
0
110
0
120
0
130
0 1400 1500 1600
Net cash flows
-
5000 700 800 900
100
0
110
0
120
0
130
0 1400 1500 1600
DCF 1.00 0.96 0.92 0.89 0.85 0.82 0.79 0.76 0.73 0.70 0.68
Present Value of
Cash Flows
-
5000
673.
08
739.
64
800.
10
854.
80
904.
12
948.
38
987.
89
1022
.97
1053
.88
1080
.90
NPV
9065
.76
IRR 11%
Discount Factor 1.00 0.96 0.92 0.89 0.85 0.82 0.79 0.76 0.73 0.70 0.68
Project B
4%
Years 0 1 2 3 4 5 6 7 8 9 10
Initial Investment
-
5000
Annual cash flows 500 0 3000 0 500 2000 0 1000 0 0
Net cash flows
-
5000 500 0 3000 0 500 2000 0 1000 0 0
INVESTMENT 2
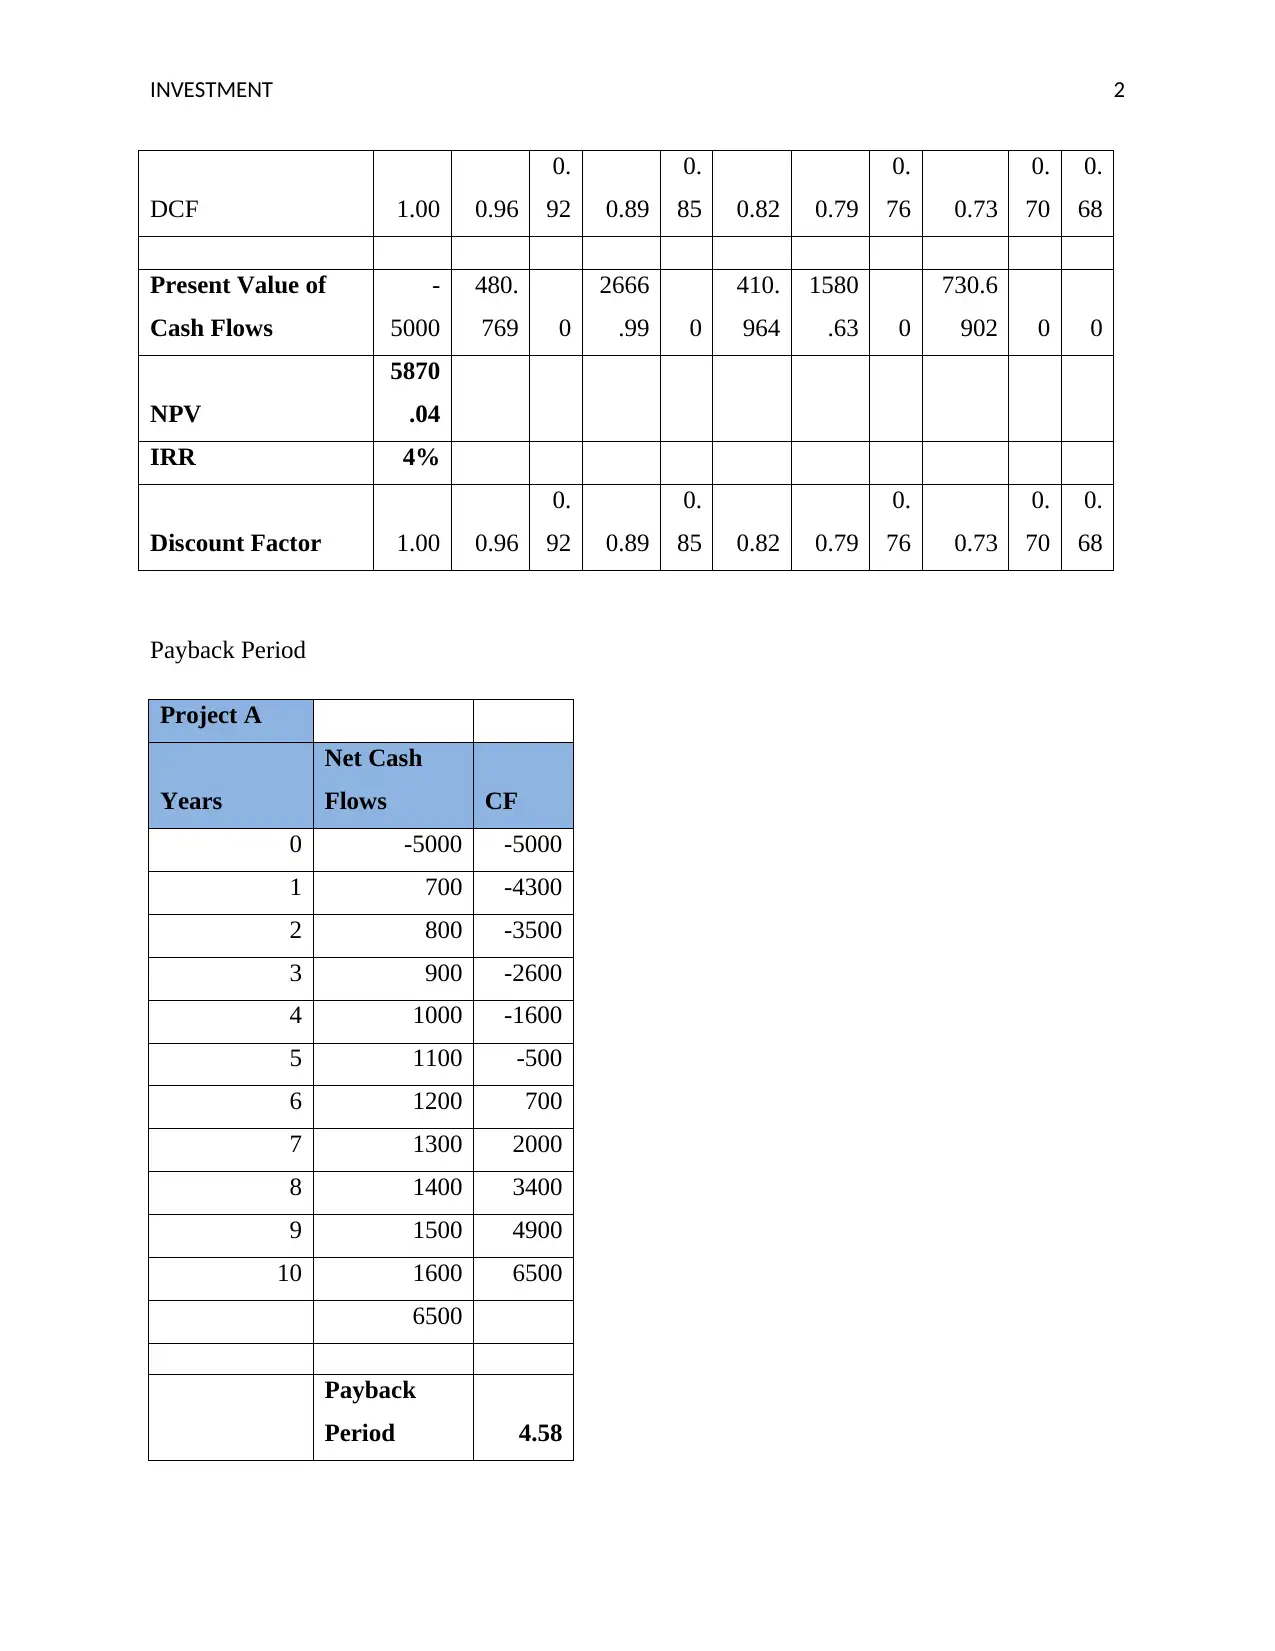
DCF 1.00 0.96
0.
92 0.89
0.
85 0.82 0.79
0.
76 0.73
0.
70
0.
68
Present Value of
Cash Flows
-
5000
480.
769 0
2666
.99 0
410.
964
1580
.63 0
730.6
902 0 0
NPV
5870
.04
IRR 4%
Discount Factor 1.00 0.96
0.
92 0.89
0.
85 0.82 0.79
0.
76 0.73
0.
70
0.
68
Payback Period
Project A
Years
Net Cash
Flows CF
0 -5000 -5000
1 700 -4300
2 800 -3500
3 900 -2600
4 1000 -1600
5 1100 -500
6 1200 700
7 1300 2000
8 1400 3400
9 1500 4900
10 1600 6500
6500
Payback
Period 4.58
INVESTMENT 3
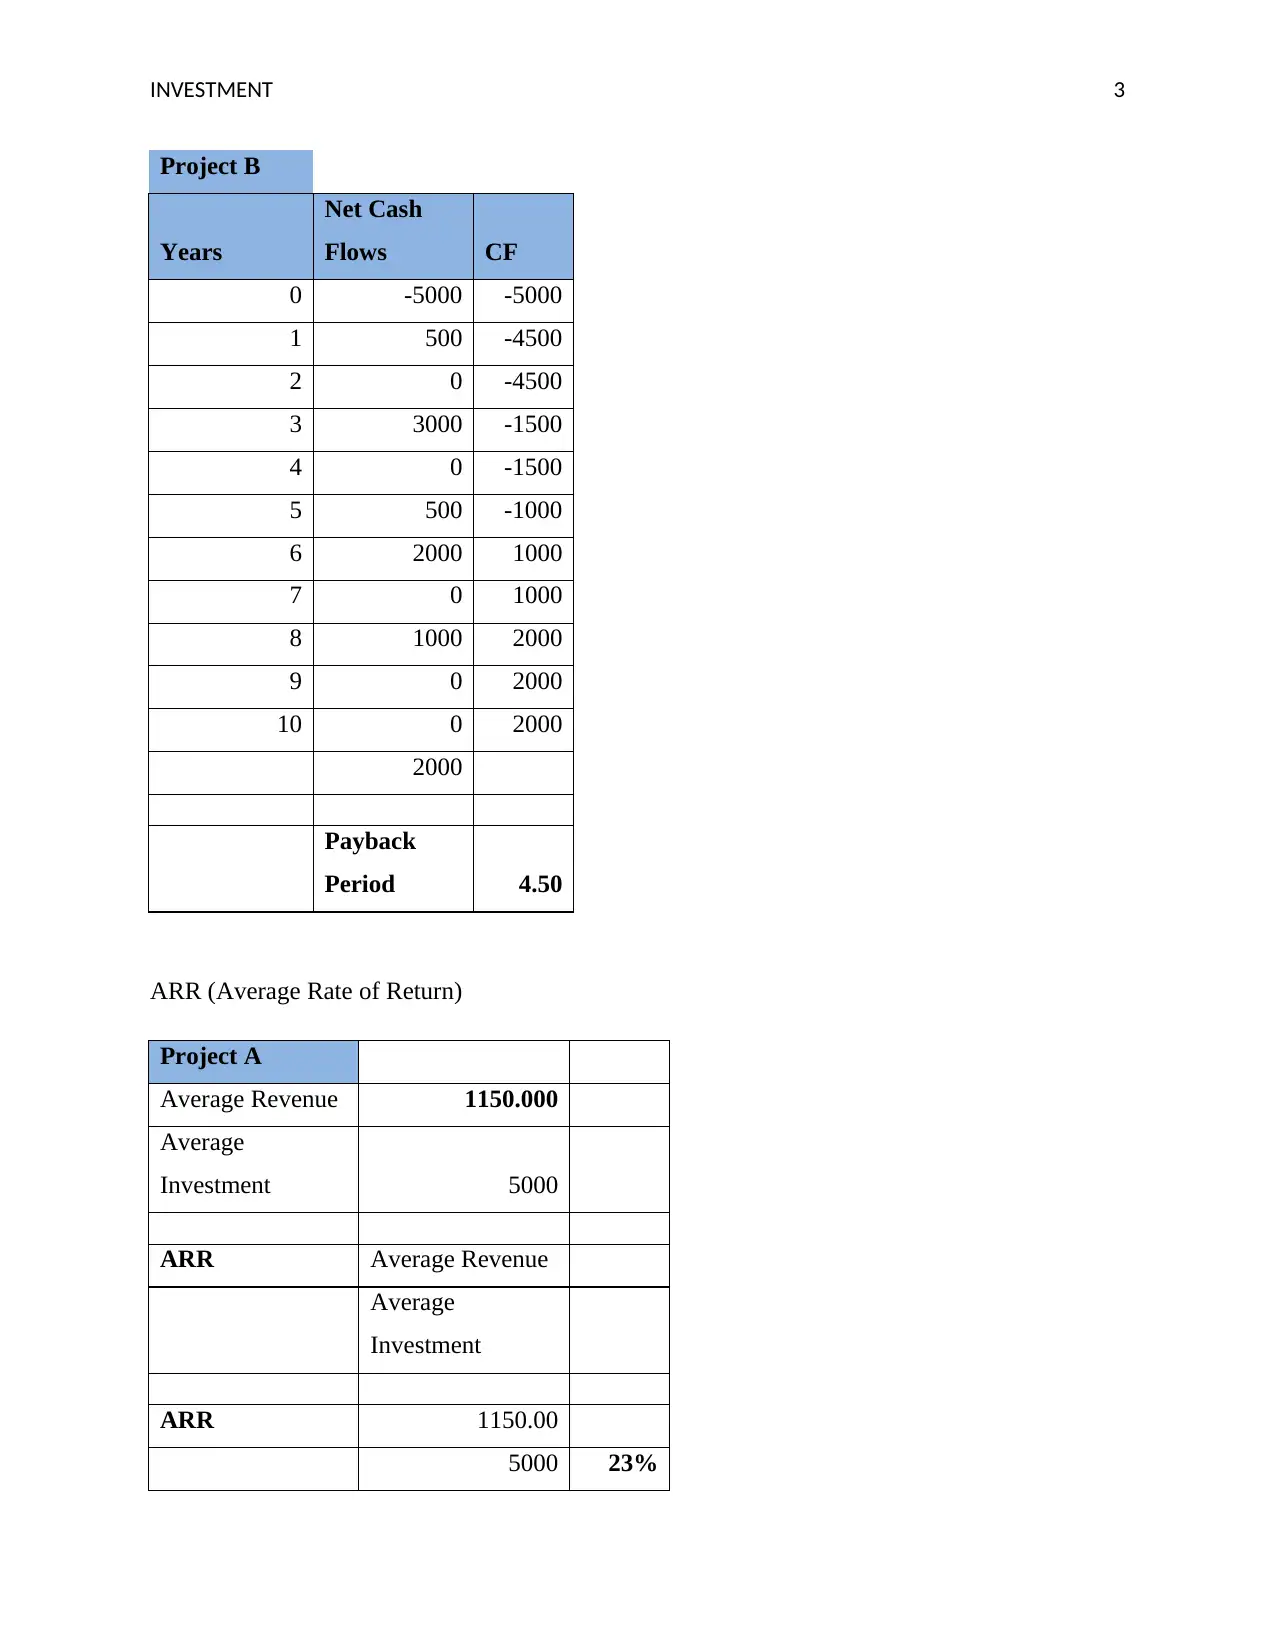
Project B
Years
Net Cash
Flows CF
0 -5000 -5000
1 500 -4500
2 0 -4500
3 3000 -1500
4 0 -1500
5 500 -1000
6 2000 1000
7 0 1000
8 1000 2000
9 0 2000
10 0 2000
2000
Payback
Period 4.50
ARR (Average Rate of Return)
Project A
Average Revenue 1150.000
Average
Investment 5000
ARR Average Revenue
Average
Investment
ARR 1150.00
5000 23%
Secure Best Marks with AI Grader
Need help grading? Try our AI Grader for instant feedback on your assignments.
INVESTMENT 4
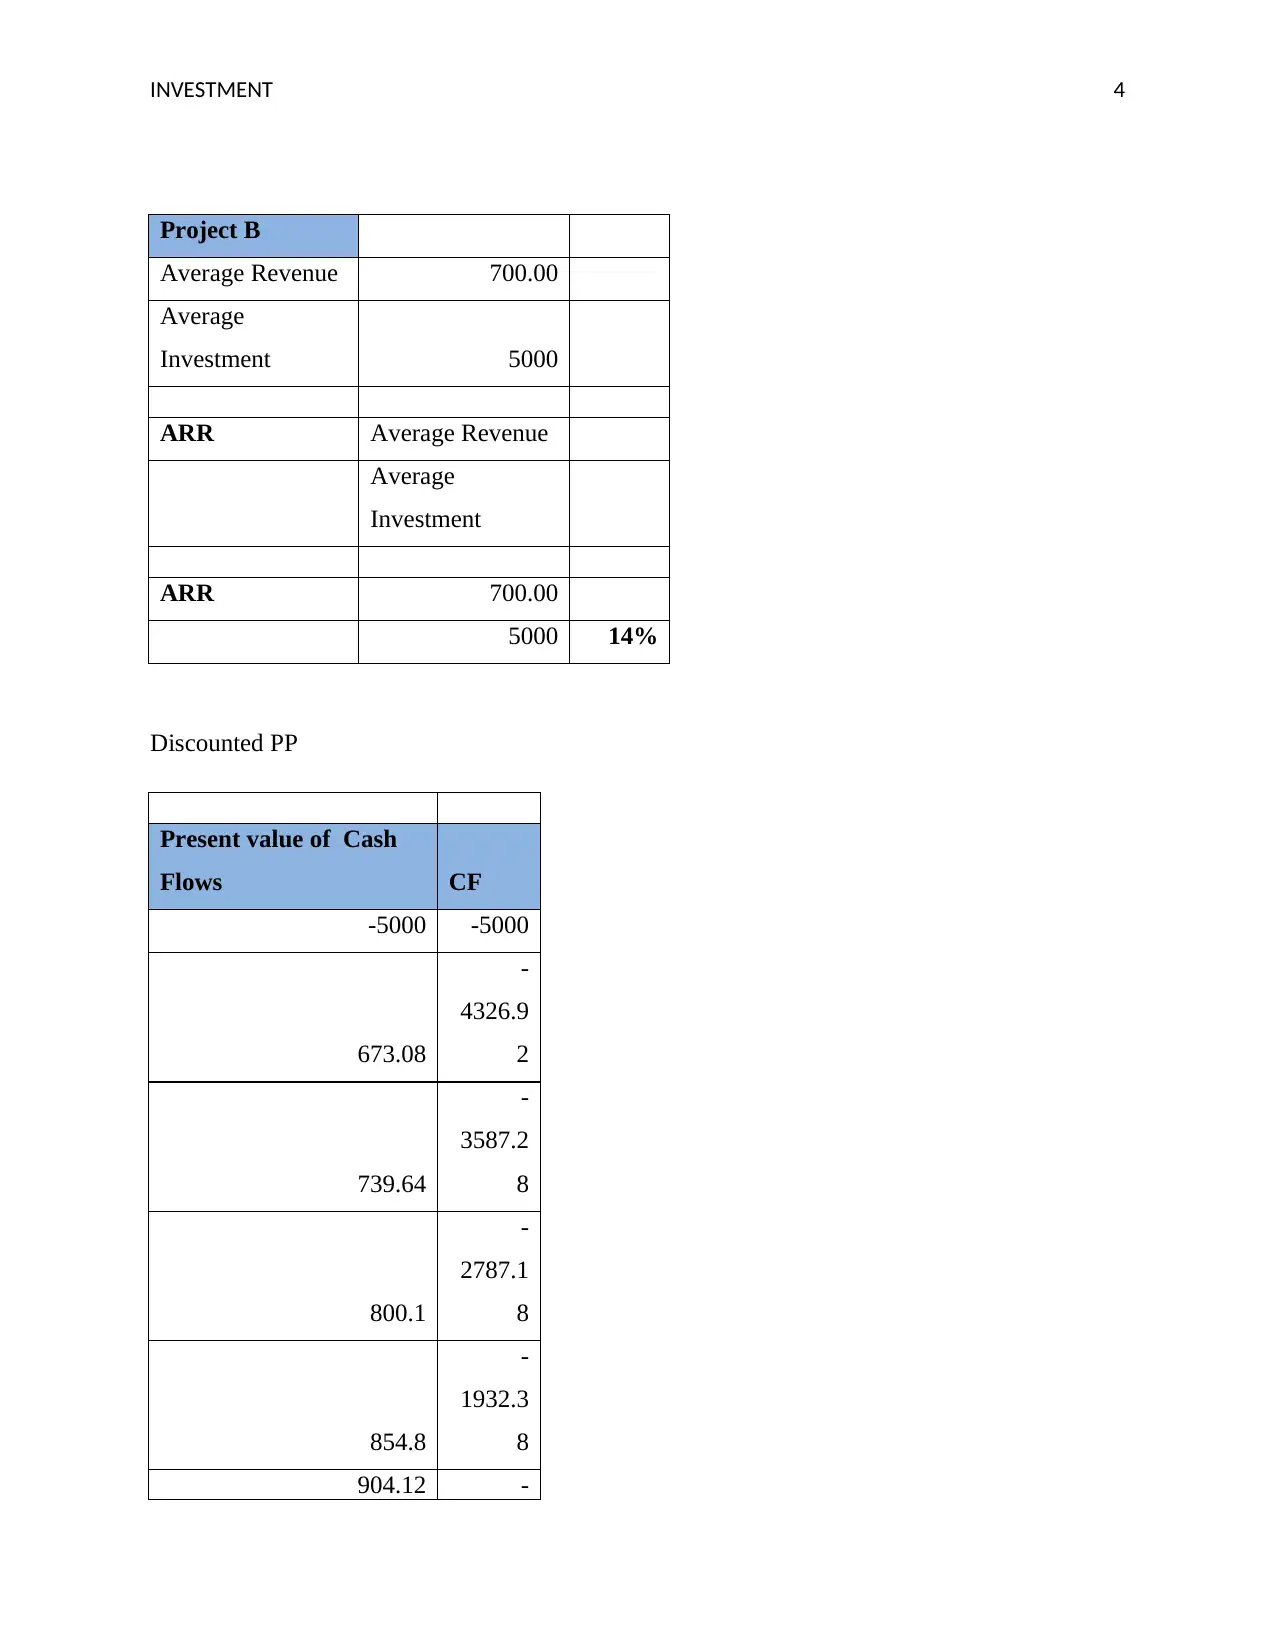
Project B
Average Revenue 700.00
Average
Investment 5000
ARR Average Revenue
Average
Investment
ARR 700.00
5000 14%
Discounted PP
Present value of Cash
Flows CF
-5000 -5000
673.08
-
4326.9
2
739.64
-
3587.2
8
800.1
-
2787.1
8
854.8
-
1932.3
8
904.12 -
Project B
Average Revenue 700.00
Average
Investment 5000
ARR Average Revenue
Average
Investment
ARR 700.00
5000 14%
Discounted PP
Present value of Cash
Flows CF
-5000 -5000
673.08
-
4326.9
2
739.64
-
3587.2
8
800.1
-
2787.1
8
854.8
-
1932.3
8
904.12 -
INVESTMENT 5
1028.2
6
948.38 -79.88
987.89 908.01
1022.97
1930.9
8
1053.88
2984.8
6
1080.9
4065.7
6
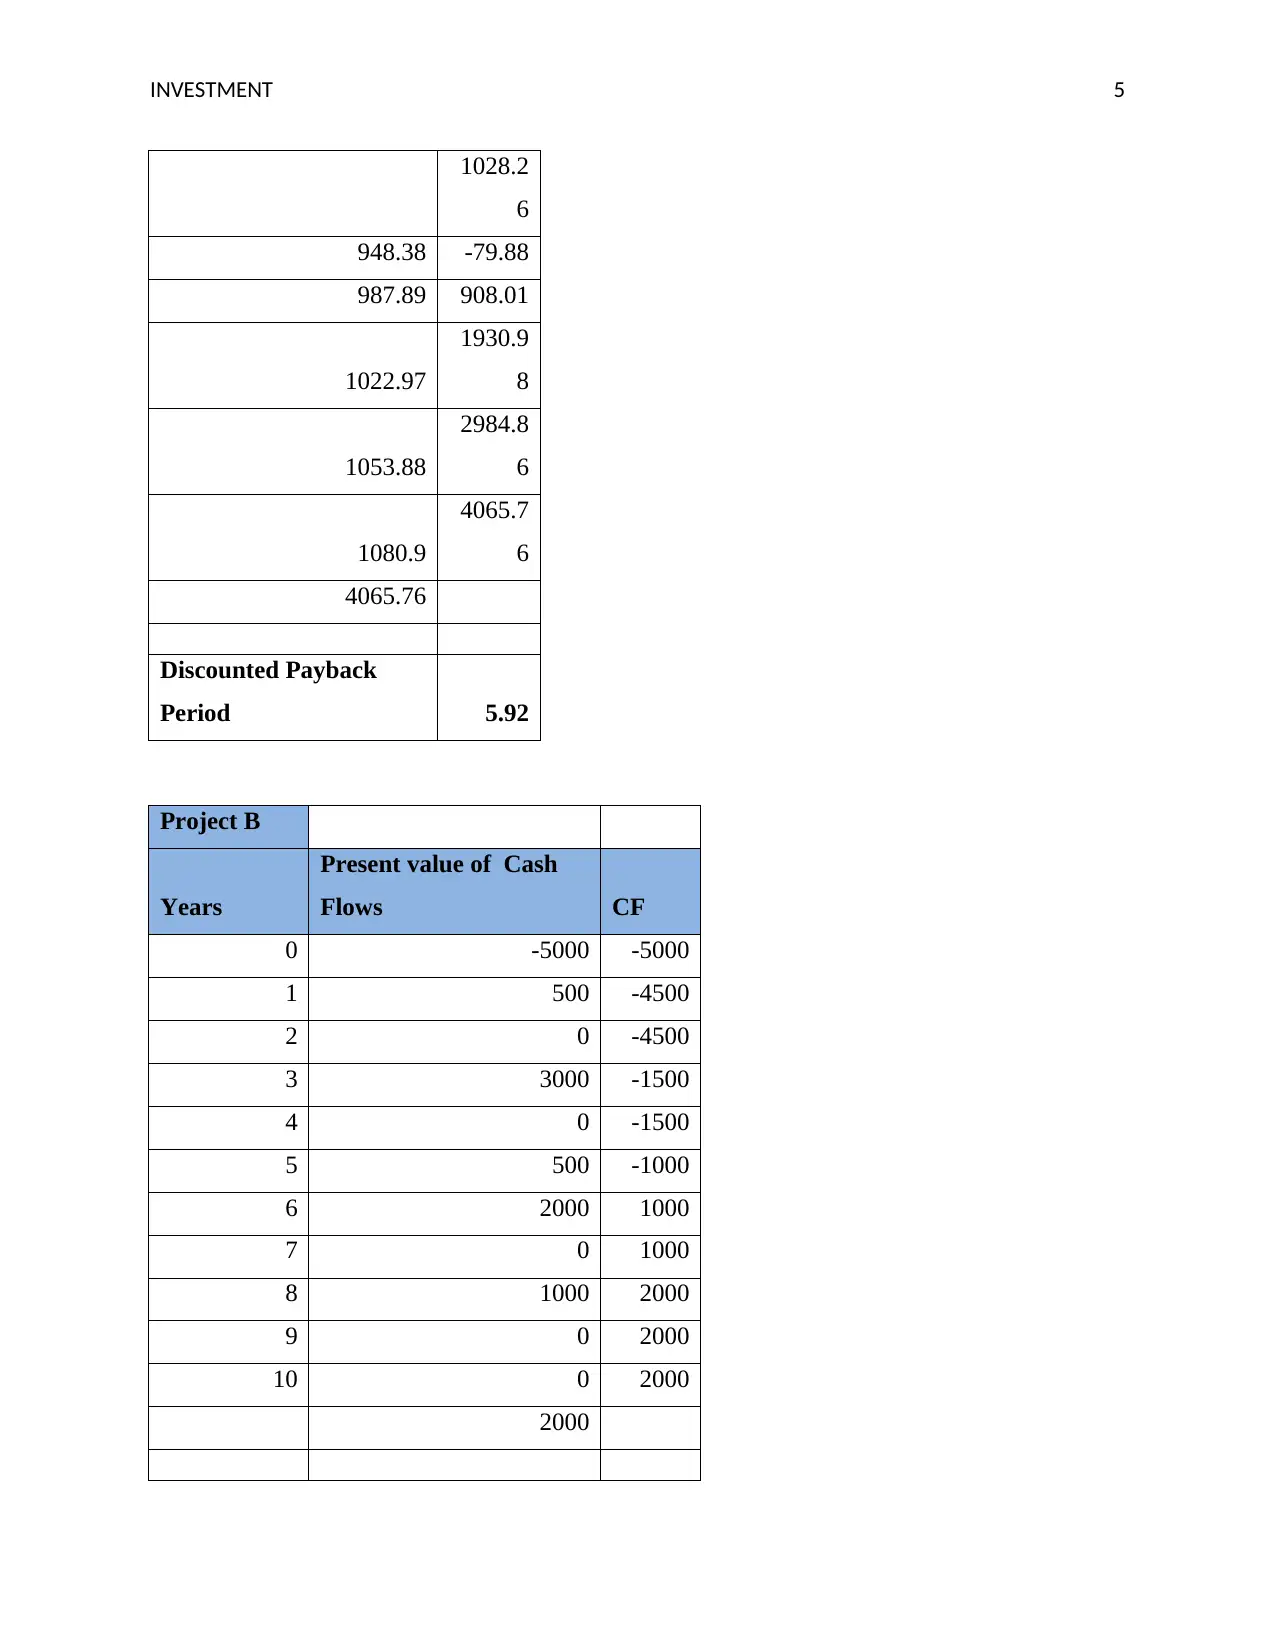
4065.76
Discounted Payback
Period 5.92
Project B
Years
Present value of Cash
Flows CF
0 -5000 -5000
1 500 -4500
2 0 -4500
3 3000 -1500
4 0 -1500
5 500 -1000
6 2000 1000
7 0 1000
8 1000 2000
9 0 2000
10 0 2000
2000
1028.2
6
948.38 -79.88
987.89 908.01
1022.97
1930.9
8
1053.88
2984.8
6
1080.9
4065.7
6
4065.76
Discounted Payback
Period 5.92
Project B
Years
Present value of Cash
Flows CF
0 -5000 -5000
1 500 -4500
2 0 -4500
3 3000 -1500
4 0 -1500
5 500 -1000
6 2000 1000
7 0 1000
8 1000 2000
9 0 2000
10 0 2000
2000
INVESTMENT 6
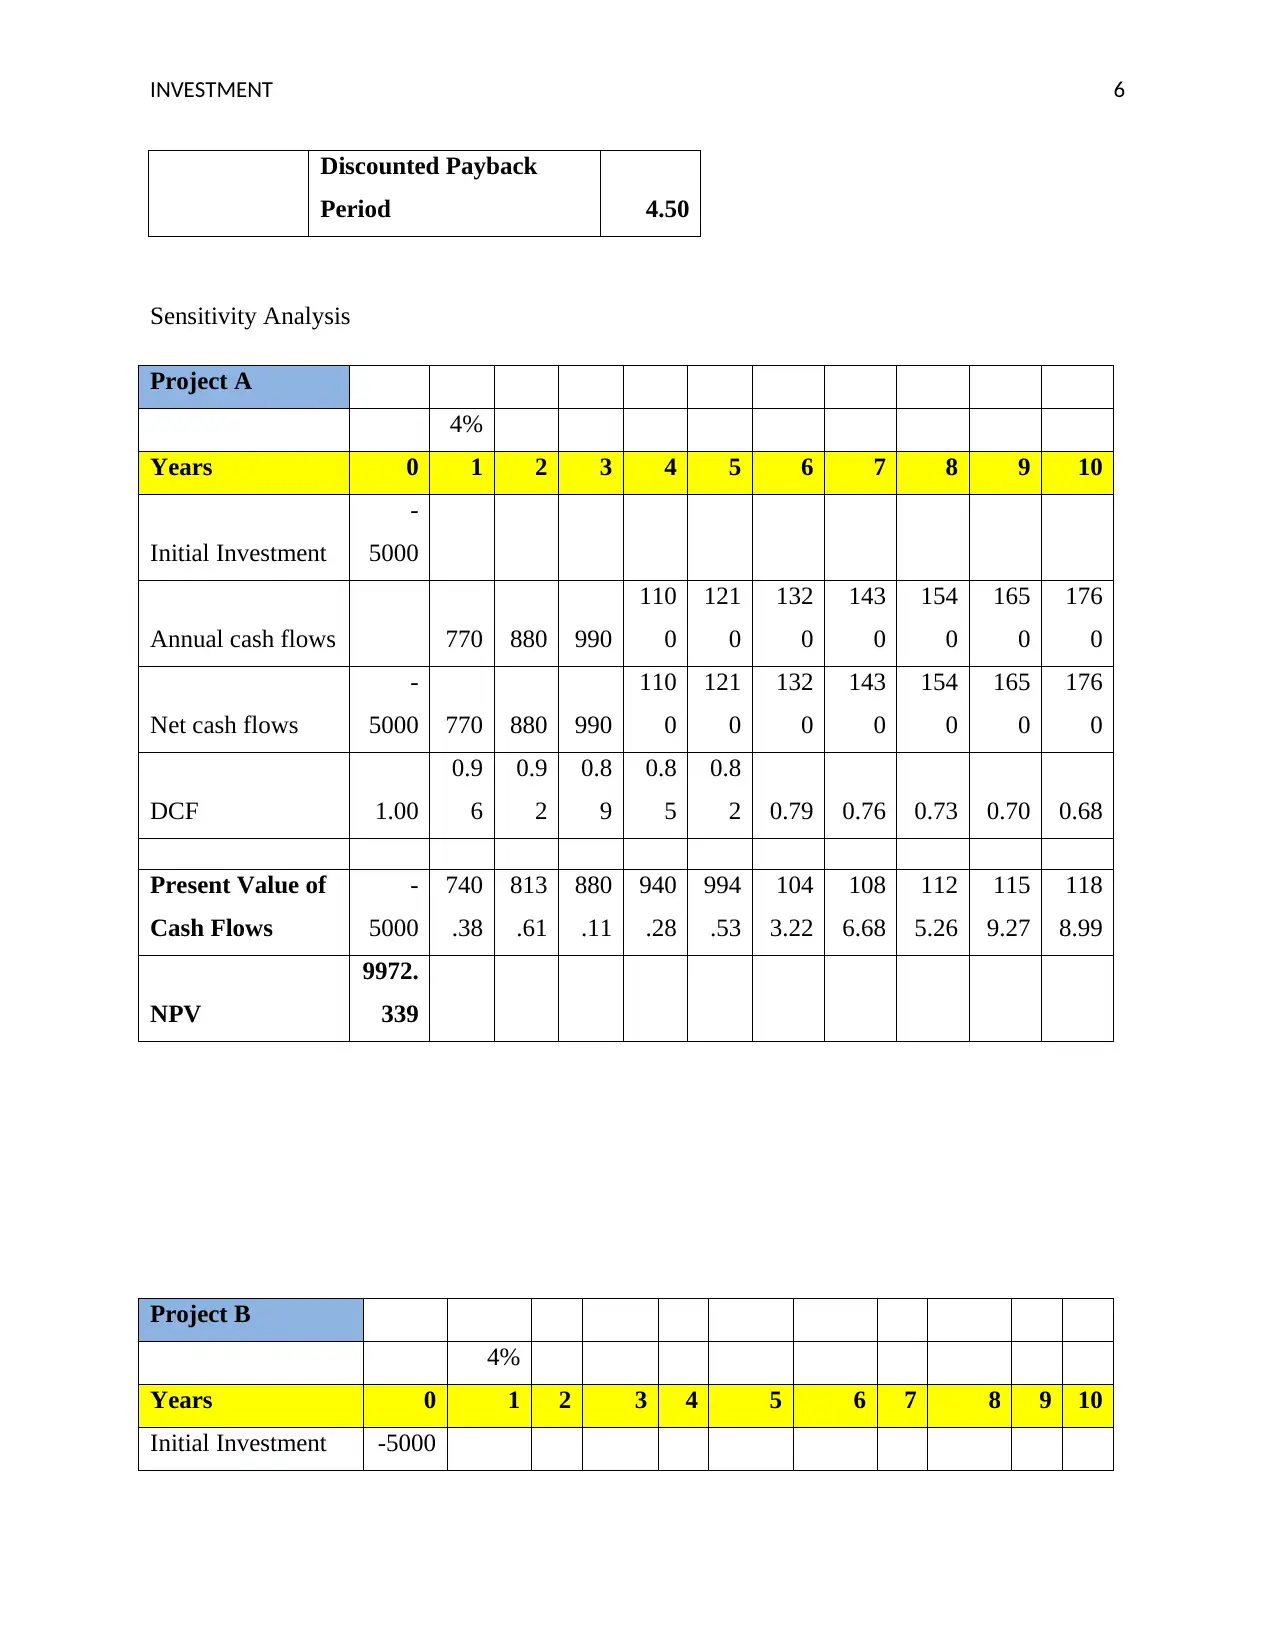
Discounted Payback
Period 4.50
Sensitivity Analysis
Project A
4%
Years 0 1 2 3 4 5 6 7 8 9 10
Initial Investment
-
5000
Annual cash flows 770 880 990
110
0
121
0
132
0
143
0
154
0
165
0
176
0
Net cash flows
-
5000 770 880 990
110
0
121
0
132
0
143
0
154
0
165
0
176
0
DCF 1.00
0.9
6
0.9
2
0.8
9
0.8
5
0.8
2 0.79 0.76 0.73 0.70 0.68
Present Value of
Cash Flows
-
5000
740
.38
813
.61
880
.11
940
.28
994
.53
104
3.22
108
6.68
112
5.26
115
9.27
118
8.99
NPV
9972.
339
Project B
4%
Years 0 1 2 3 4 5 6 7 8 9 10
Initial Investment -5000
Paraphrase This Document
Need a fresh take? Get an instant paraphrase of this document with our AI Paraphraser
INVESTMENT 7
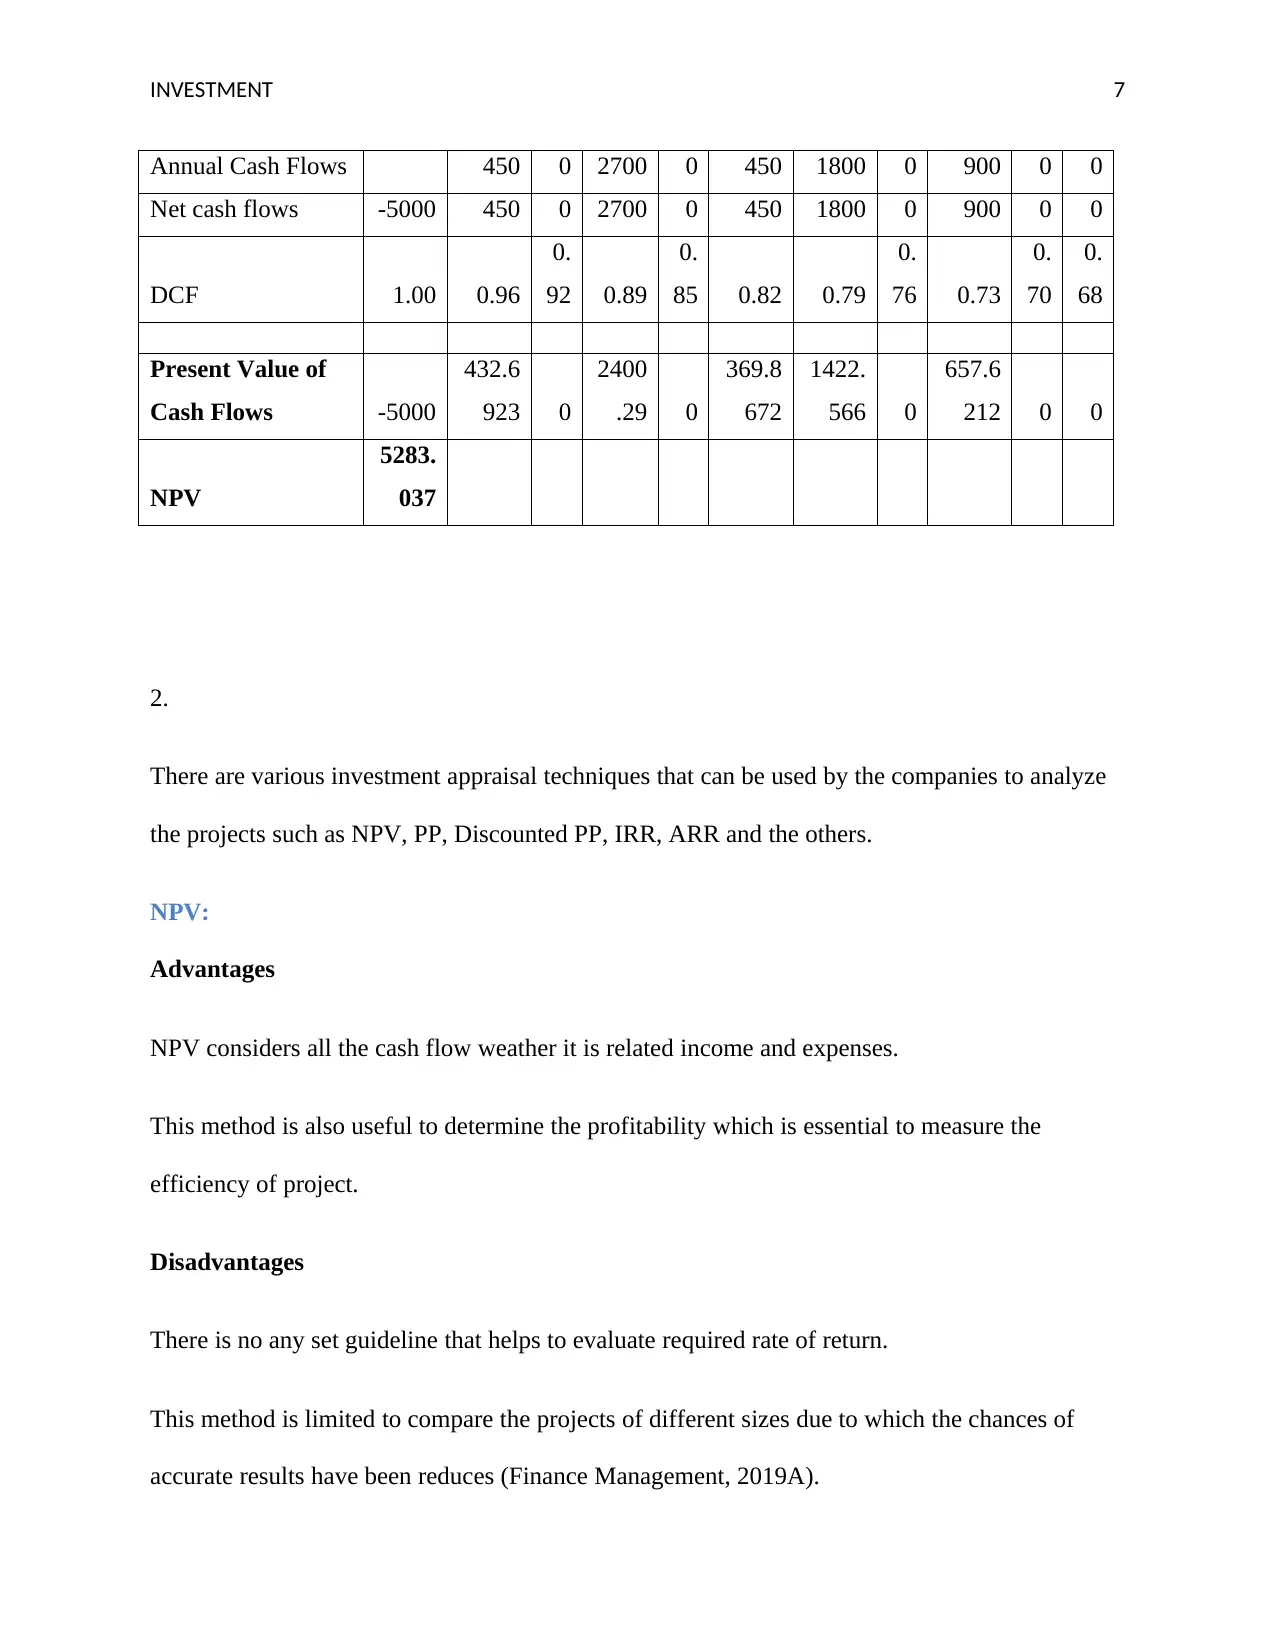
Annual Cash Flows 450 0 2700 0 450 1800 0 900 0 0
Net cash flows -5000 450 0 2700 0 450 1800 0 900 0 0
DCF 1.00 0.96
0.
92 0.89
0.
85 0.82 0.79
0.
76 0.73
0.
70
0.
68
Present Value of
Cash Flows -5000
432.6
923 0
2400
.29 0
369.8
672
1422.
566 0
657.6
212 0 0
NPV
5283.
037
2.
There are various investment appraisal techniques that can be used by the companies to analyze
the projects such as NPV, PP, Discounted PP, IRR, ARR and the others.
NPV:
Advantages
NPV considers all the cash flow weather it is related income and expenses.
This method is also useful to determine the profitability which is essential to measure the
efficiency of project.
Disadvantages
There is no any set guideline that helps to evaluate required rate of return.
This method is limited to compare the projects of different sizes due to which the chances of
accurate results have been reduces (Finance Management, 2019A).
INVESTMENT 8
Payback Period
Advantages
The main advantage of this method is to evaluate the time in which the company can recover the
interest expenses.
It is very easy method to calculate the time as compare to the other appraisal techniques.
It is also easy to understand the concepts
Disadvantages
In this method, cash flow produced has been ignored after the end of payback period due to
which the total return amount of project has been affected.
This method also ignores the time value of money.
It ignores the timing of cash inflows with the payback period (Accounting Skills, 2019).
Discounted PP
Advantages
The main advantage of the discounted payback period is that it helps to examine the liquidity and
uncertainty risk of the project.
This method considers the time value of money while determining payback period.
It is easy to determine the discounted payback period.
This method determines the actual risk those are involved in a project.
INVESTMENT 9
Disadvantages
The main disadvantage of this appraisal method is not to take the account into cash flows coming
in after break-even.
This method is fails to evaluate the investment return weather it will increases the firm’s value or
not.
It is also difficult to calculate the discounted PP when there are multiple number of negative cash
flows (Finance Management, 2019b).
ARR (Average Rate of Return)
Advantages
ARR is appraisal techniques that consider the concept of net earnings i.e. earnings after tax and
depreciation which is essential to evaluate the appropriate result.
It helps to compare the new projects with the cost reducing projects or other projects.
It helps to satisfy the interest of the owners as they are highly interest in return on investment
(Money Matters, 2019).
Disadvantages
This method is not able to evaluate the fair rate of return which is required to estimate the
efficiency of project.
It does not consider the external factors that affect the profitability of the projects.
Disadvantages
The main disadvantage of this appraisal method is not to take the account into cash flows coming
in after break-even.
This method is fails to evaluate the investment return weather it will increases the firm’s value or
not.
It is also difficult to calculate the discounted PP when there are multiple number of negative cash
flows (Finance Management, 2019b).
ARR (Average Rate of Return)
Advantages
ARR is appraisal techniques that consider the concept of net earnings i.e. earnings after tax and
depreciation which is essential to evaluate the appropriate result.
It helps to compare the new projects with the cost reducing projects or other projects.
It helps to satisfy the interest of the owners as they are highly interest in return on investment
(Money Matters, 2019).
Disadvantages
This method is not able to evaluate the fair rate of return which is required to estimate the
efficiency of project.
It does not consider the external factors that affect the profitability of the projects.
Secure Best Marks with AI Grader
Need help grading? Try our AI Grader for instant feedback on your assignments.
INVESTMENT 10
In this method, time factor has been ignored which is one of the primary weaknesses of the
average as it creates difficulties to measure the alternative uses of funds (CFI, 2019).
IRR (Interest Rate of Return)
Advantages
The main advantage of IRR method is that it provides the appropriate rate of return of each
project as compare to the cost of the investment.
It also considers the time value of money that helps to measure the future earning potential of
money.
This method is more accurate and credible.
It is easy to calculate and understand just because of simplicity (Alkaraan, 2017).
Disadvantages
The disadvantage of this method is that it does not recognize the important factors like future
costs, project duration, and the size of project.
IRR simply compares the project’s cash flow with the project’s existing cost excluding these
factors.
This method ignores the re-investment rate which is major factor to evaluate the project rate of
return (Lanctot, 2019).
INVESTMENT 11
3.
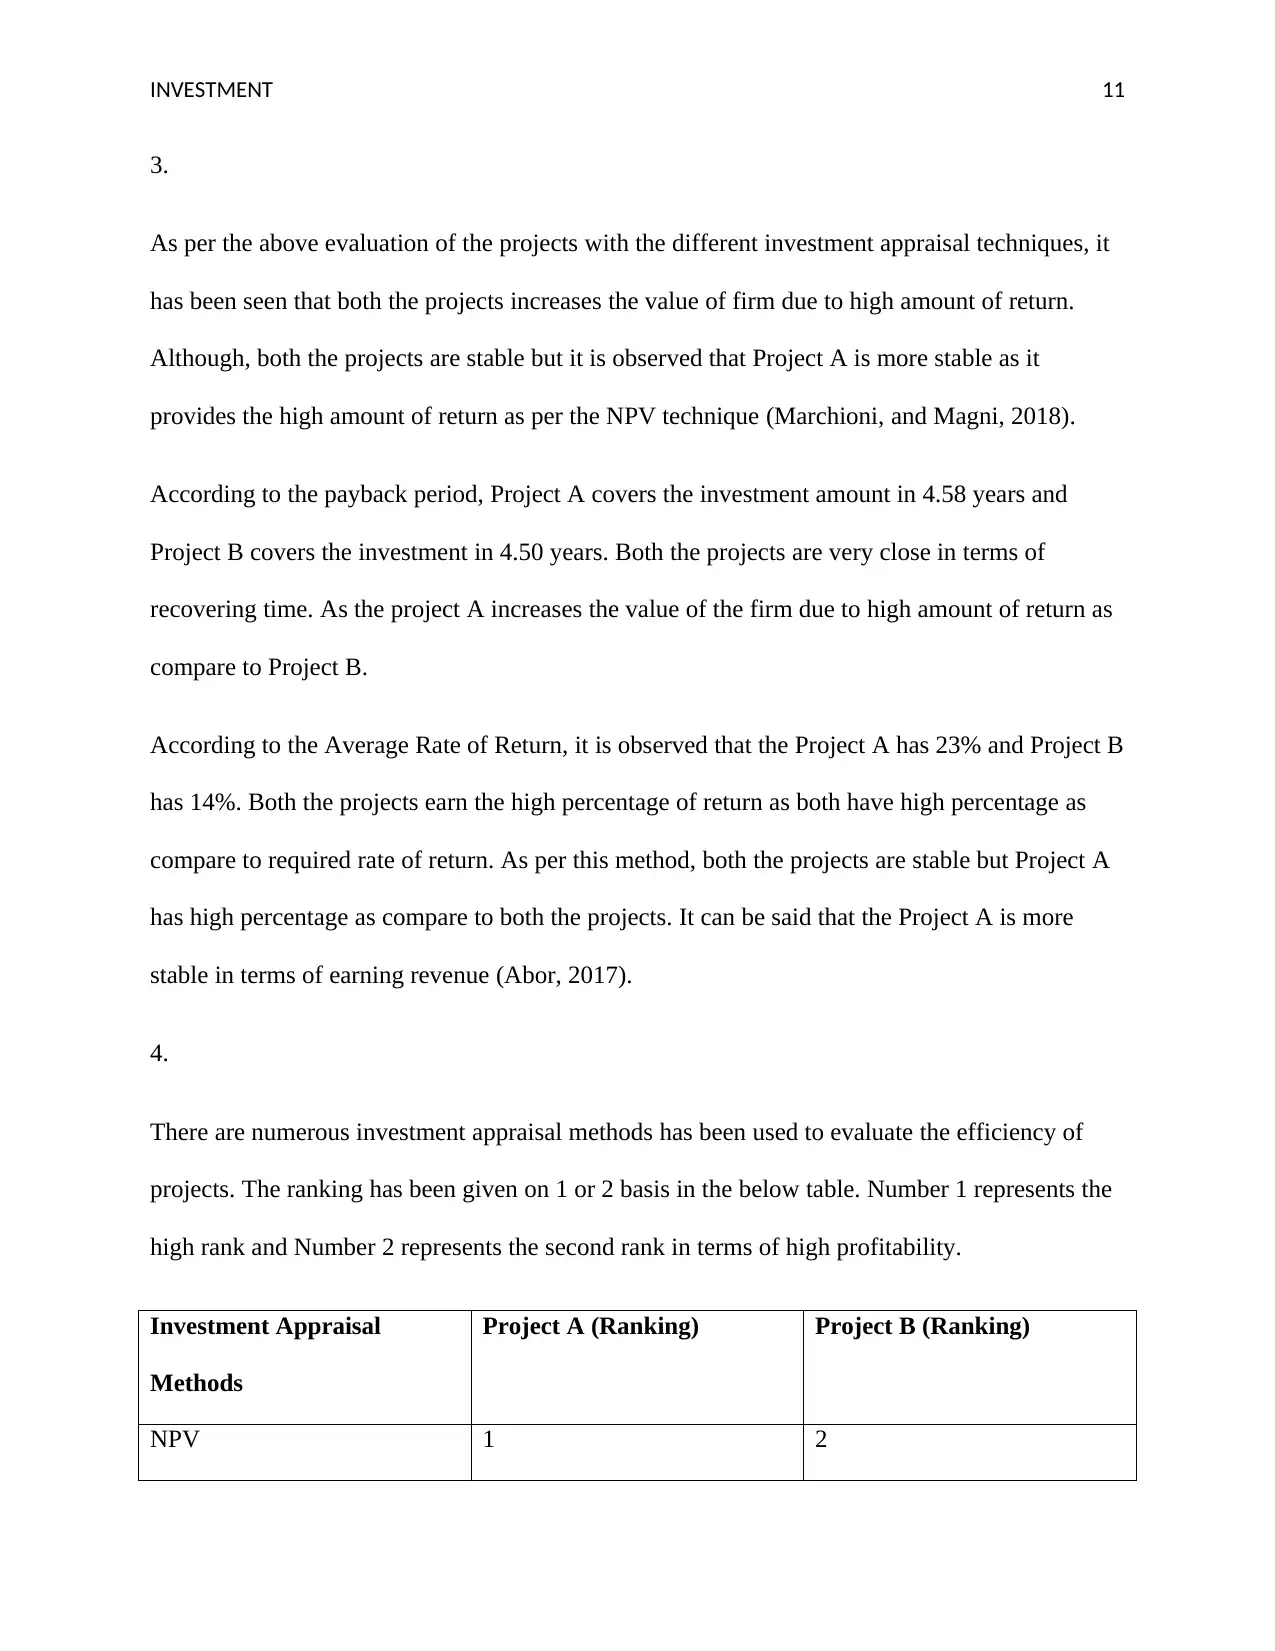
As per the above evaluation of the projects with the different investment appraisal techniques, it
has been seen that both the projects increases the value of firm due to high amount of return.
Although, both the projects are stable but it is observed that Project A is more stable as it
provides the high amount of return as per the NPV technique (Marchioni, and Magni, 2018).
According to the payback period, Project A covers the investment amount in 4.58 years and
Project B covers the investment in 4.50 years. Both the projects are very close in terms of
recovering time. As the project A increases the value of the firm due to high amount of return as
compare to Project B.
According to the Average Rate of Return, it is observed that the Project A has 23% and Project B
has 14%. Both the projects earn the high percentage of return as both have high percentage as
compare to required rate of return. As per this method, both the projects are stable but Project A
has high percentage as compare to both the projects. It can be said that the Project A is more
stable in terms of earning revenue (Abor, 2017).
4.
There are numerous investment appraisal methods has been used to evaluate the efficiency of
projects. The ranking has been given on 1 or 2 basis in the below table. Number 1 represents the
high rank and Number 2 represents the second rank in terms of high profitability.
Investment Appraisal
Methods
Project A (Ranking) Project B (Ranking)
NPV 1 2
3.
As per the above evaluation of the projects with the different investment appraisal techniques, it
has been seen that both the projects increases the value of firm due to high amount of return.
Although, both the projects are stable but it is observed that Project A is more stable as it
provides the high amount of return as per the NPV technique (Marchioni, and Magni, 2018).
According to the payback period, Project A covers the investment amount in 4.58 years and
Project B covers the investment in 4.50 years. Both the projects are very close in terms of
recovering time. As the project A increases the value of the firm due to high amount of return as
compare to Project B.
According to the Average Rate of Return, it is observed that the Project A has 23% and Project B
has 14%. Both the projects earn the high percentage of return as both have high percentage as
compare to required rate of return. As per this method, both the projects are stable but Project A
has high percentage as compare to both the projects. It can be said that the Project A is more
stable in terms of earning revenue (Abor, 2017).
4.
There are numerous investment appraisal methods has been used to evaluate the efficiency of
projects. The ranking has been given on 1 or 2 basis in the below table. Number 1 represents the
high rank and Number 2 represents the second rank in terms of high profitability.
Investment Appraisal
Methods
Project A (Ranking) Project B (Ranking)
NPV 1 2

INVESTMENT 12
Payback Period 2 1
Average Rate of Return 1 2
Interest Rate of Return 1 2
Discounted Rate of Return 2 1
As per the ranking, it can be said that Project A is more beneficial for the organization to gets the
good return. Project A is more appropriate according to the calculation of different method of
investment appraisal.
Paraphrase This Document
Need a fresh take? Get an instant paraphrase of this document with our AI Paraphraser
INVESTMENT 13
References
Abor, J.Y. (2017) Evaluating Capital Investment Decisions: Capital Budgeting. In
Entrepreneurial Finance for MSMEs (pp. 293-320). Palgrave Macmillan, Cham.
Accounting Skills. (2019) What Is Payback Period? (With Advantages & Disadvantages).
Available From: https://accountantskills.com/what-is-payback-period-what-are-the-advantages-
and-disadvantages-of-payback-period/[Accessed 19/2/2020].
Alkaraan, F. (2017) Strategic investment appraisal: multidisciplinary perspectives. Advances in
Mergers and Acquisitions, p.67.
CFI. (2019) ARR – Accounting Rate of Return. Available From:
https://corporatefinanceinstitute.com/resources/knowledge/accounting/arr-accounting-rate-of-
return/ [Accessed 19/2/2020].
Finance Management. (2019A) Advantages and Disadvantages of NPV. Available From:
https://efinancemanagement.com/investment-decisions/advantages-and-disadvantages-of-npv
[Accessed 19/2/2020].
Finance Management. (2019B) Discounted Payback Period. Available From:
https://efinancemanagement.com/investment-decisions/discounted-payback-period [Accessed
19/2/2020].

INVESTMENT 14
Lanctot, P. (2019) The Advantages and Disadvantages of the Internal Rate of Return Method.
Available From: https://smallbusiness.chron.com/advantages-disadvantages-internal-rate-return-
method-60935.html [Accessed 19/2/2020].
Marchioni, A. and Magni, C.A. (2018) Investment decisions and sensitivity analysis: NPV-
consistency of rates of return. European Journal of Operational Research, 268(1), pp.361-372.
Money Matters. (2019) Accounting Rate of Return (ARR) Method | Advantages | Disadvantages.
Available From: https://accountlearning.com/accounting-rate-of-return-method-advantages-
disadvantages/ [Accessed 19/2/2020].
1 out of 15
Related Documents

Your All-in-One AI-Powered Toolkit for Academic Success.
+13062052269
info@desklib.com
Available 24*7 on WhatsApp / Email
![[object Object]](/_next/static/media/star-bottom.7253800d.svg)
Unlock your academic potential
© 2024 | Zucol Services PVT LTD | All rights reserved.