Investment Appraisal Techniques and Liquidity Ratios for Company A
VerifiedAdded on 2023/05/28
|12
|2339
|77
AI Summary
This article discusses investment appraisal techniques and liquidity ratios for Company A. It provides advantages and disadvantages of each investment appraisal method and suggests ways to improve the liquidity ratios. The article also identifies cash flow and overtrading problems faced by the company.
Contribute Materials
Your contribution can guide someone’s learning journey. Share your
documents today.

Running head: FINANCE 0
Finance
Finance
Secure Best Marks with AI Grader
Need help grading? Try our AI Grader for instant feedback on your assignments.

FINANCE 1
Contents
PART A......................................................................................................................................2
PART B......................................................................................................................................7
References................................................................................................................................11
FINANCE 2
PART A
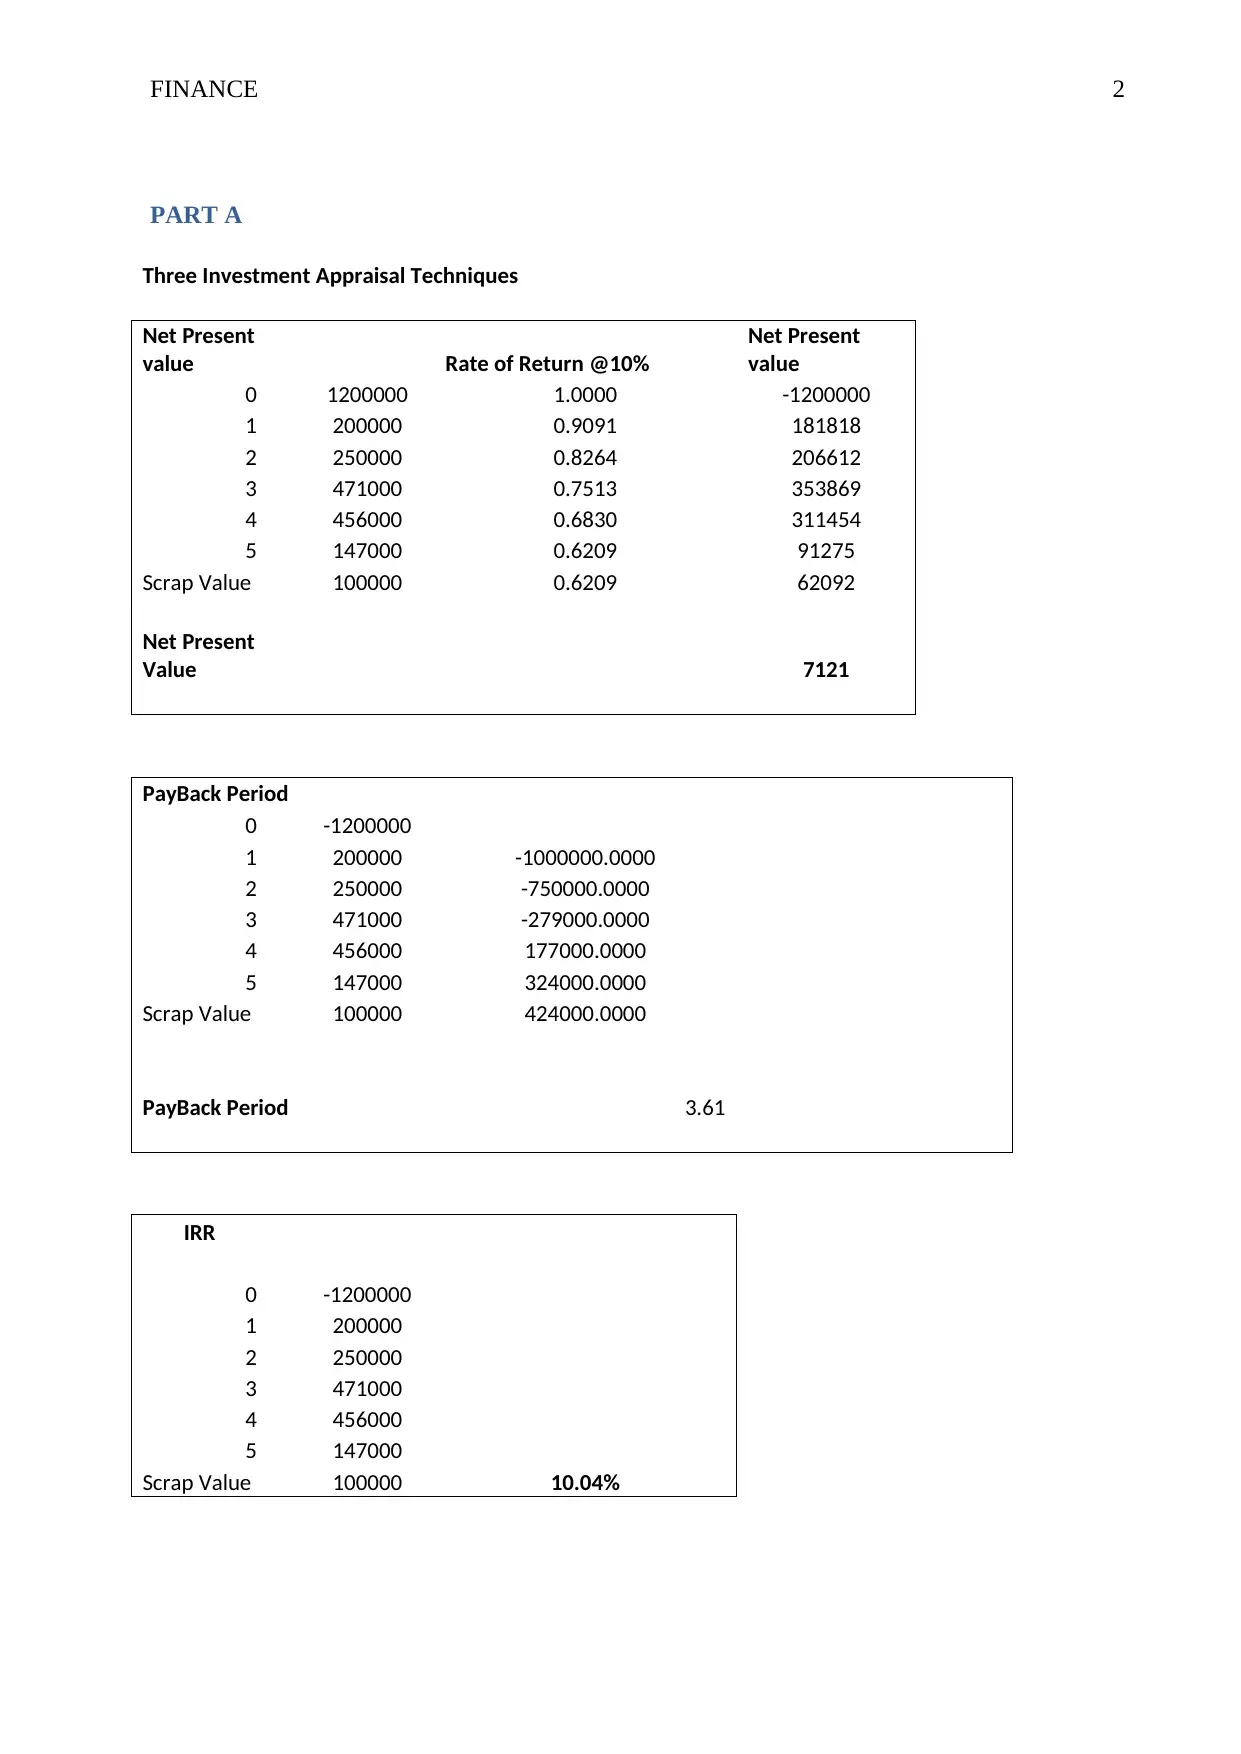
Three Investment Appraisal Techniques
Net Present
value Rate of Return @10%
Net Present
value
0 1200000 1.0000 -1200000
1 200000 0.9091 181818
2 250000 0.8264 206612
3 471000 0.7513 353869
4 456000 0.6830 311454
5 147000 0.6209 91275
Scrap Value 100000 0.6209 62092
Net Present
Value 7121
PayBack Period
0 -1200000
1 200000 -1000000.0000
2 250000 -750000.0000
3 471000 -279000.0000
4 456000 177000.0000
5 147000 324000.0000
Scrap Value 100000 424000.0000
PayBack Period 3.61
IRR
0 -1200000
1 200000
2 250000
3 471000
4 456000
5 147000
Scrap Value 100000 10.04%
PART A
Three Investment Appraisal Techniques
Net Present
value Rate of Return @10%
Net Present
value
0 1200000 1.0000 -1200000
1 200000 0.9091 181818
2 250000 0.8264 206612
3 471000 0.7513 353869
4 456000 0.6830 311454
5 147000 0.6209 91275
Scrap Value 100000 0.6209 62092
Net Present
Value 7121
PayBack Period
0 -1200000
1 200000 -1000000.0000
2 250000 -750000.0000
3 471000 -279000.0000
4 456000 177000.0000
5 147000 324000.0000
Scrap Value 100000 424000.0000
PayBack Period 3.61
IRR
0 -1200000
1 200000
2 250000
3 471000
4 456000
5 147000
Scrap Value 100000 10.04%
FINANCE 3
It is advised to company to buy the project because the IRR is more than the present rate, the
payback period is 3.61 and in comparison to the 4 years and the net present value is positive
therefore the project can be bought. The other relevant considerations that are used in
decision making of the company are adjusted present value, relative rankings of the projects
and the modified internal rate of return and apart from this the factors affecting the company
(Osborne, 2010).
Advantages of investment appraisal methods
Net Present value method
Under the net present value method the main motive of the firm is to create the wealth with
the help of the existing and the future resources to produce the goods and the services. It is
basically the difference between the present value of the inflow of the cash and the outflow of
cash. This method is used to determine the profitability of the projected investment (Setiawan
and Fahrurrozi, 2017).
The advantages of using the net present value to determine the viability of the business
are as follows.
The most obvious advantage of the net present value method is the consideration of
the value of the dollar. According to the NPV method the value of the future dollar is
less than a dollar today. NPV basically gives importance to the time value of money.
Secondly the NPV method also deals with the creation of the value of the investment
for the potential investors and by how much in terms of the dollars. This helps in
maximisation of the value of the firm (Schwarzbichler, Steiner and Turnheim, 2018)
Thirdly it recognises the total merits that are arising from the proposals over the life
time. Since this method is particularly helpful in selection of the mutually exclusive
Secure Best Marks with AI Grader
Need help grading? Try our AI Grader for instant feedback on your assignments.
FINANCE 4
projects there are many alternatives available to create the new opportunities for the
investor.
The NPV method assists in the wealth maximisation of the shareholders.
Demerits
The biggest advantage of this method is the cost of capital is not the accurate cost of capital.
Since the cost of capital vary between too low and too high the opportunities for the
investments also vary and from making the suboptimal investments to forgoing too many
good investments Christersson, Vimpari and Junnila, 2015).
When the size of the two projects is different the application of the NPV value fails.
Since the size of the output is mostly determined by the size of the input the
comparison becomes impossible for the investors.
The appropriate discounted rate is difficult to calculate and becomes complex in
nature. This method may not give the satisfactory results and the shorter economic life
of the project does is not associated with much of the importance.
Payback Period
The payback period of an investment is determined in the number of years. This method
generally recognises the return of the original initial investment in a particular project. When
the payback period is calculated, the cash inflows from the project are equivalent the
outflows of the same. The length of the time the process takes is ultimately the payback
period for the investment made (Kaplan and Atkinson, 2015).
Following are some of the advantages of the payback period.
FINANCE 5
This is the simplest form of method of the investment appraisal. It is easy to
understand and is most cores to the business which lacks the appropriate skills and is
necessary to fulfil the other techniques as well.
The companies are compelled to make investments in the projects that are off shortest
payback period.
This method is most suitable when the near future is quite uncertain. The risk of the
project is determined by payback period of the project. Higher the payback period,
higher is the risk, lower the payback period, the risk is cumulatively less. Therefore it
exhibits the direct relationship (Copiello, 2016)
. After discussing the pros of the company there are some cons as well that are
outlined below.
Payback period requires the secondary comparison factor to make a relevance of it. It
becomes impossible to decode whether the investment shall be accepted or rejected
when the payback period is compared to the arbitrary managerial target.
This method is a reliable measure of liquidity more rather than the profitability. This
method ignore the generation of cash beyond the payback period. Therefore it fails to
consider the entire life of the project (Santandrea, Sironi, Grassi and Giorgino, 2017)
IRR
Under the IRR method the rate is in terms of the percentage that organises the capital
investment appraisals and makes the future cash flows and the cost of capital equivalent. It is
the return equating the net cash flows with the initial outlay. Also the rate of computing the
IRR depends on rates of the bank and the cost of the funds often called as the personal
discounting rate (Patrick and French, 2016)
.
FINANCE 6
Following are the merits of the IRR method
This method takes into consideration the time value of money.
Both the indirect and the direct cash flows are considered in this method
Lastly this method is the easiest method to operate and understand and thereafter the
implications of these methods are higher in comparison to the other methods.
Demerits of IRR
IRR produces the variety of rates which at times can be confusing.
Projects selected based on the IRR may or may not be profitable
The fluctuating interest rates are ignored completely.
Methods which are widely used in industry are outlined below
The most commonly used method of the appraisal of the investment which is used by the
industry is the payback period. This method is mostly common for the energy efficient
investments and the operational ones followed by the IRR and the NPV methods. The main
reason behind the utilisation of this method in the industry is the simplicity in terms of the
voluminous investments. This helps the organisations in ranking of the projects according to
the ability of the repayment of the money in the quickest manner. The control of the cash is
usually done with the help of this method (Osborne and O'Reilly, 2015)
PART B
Liquidity Ratios
Current ratio 2017 2016
Paraphrase This Document
Need a fresh take? Get an instant paraphrase of this document with our AI Paraphraser
FINANCE 7
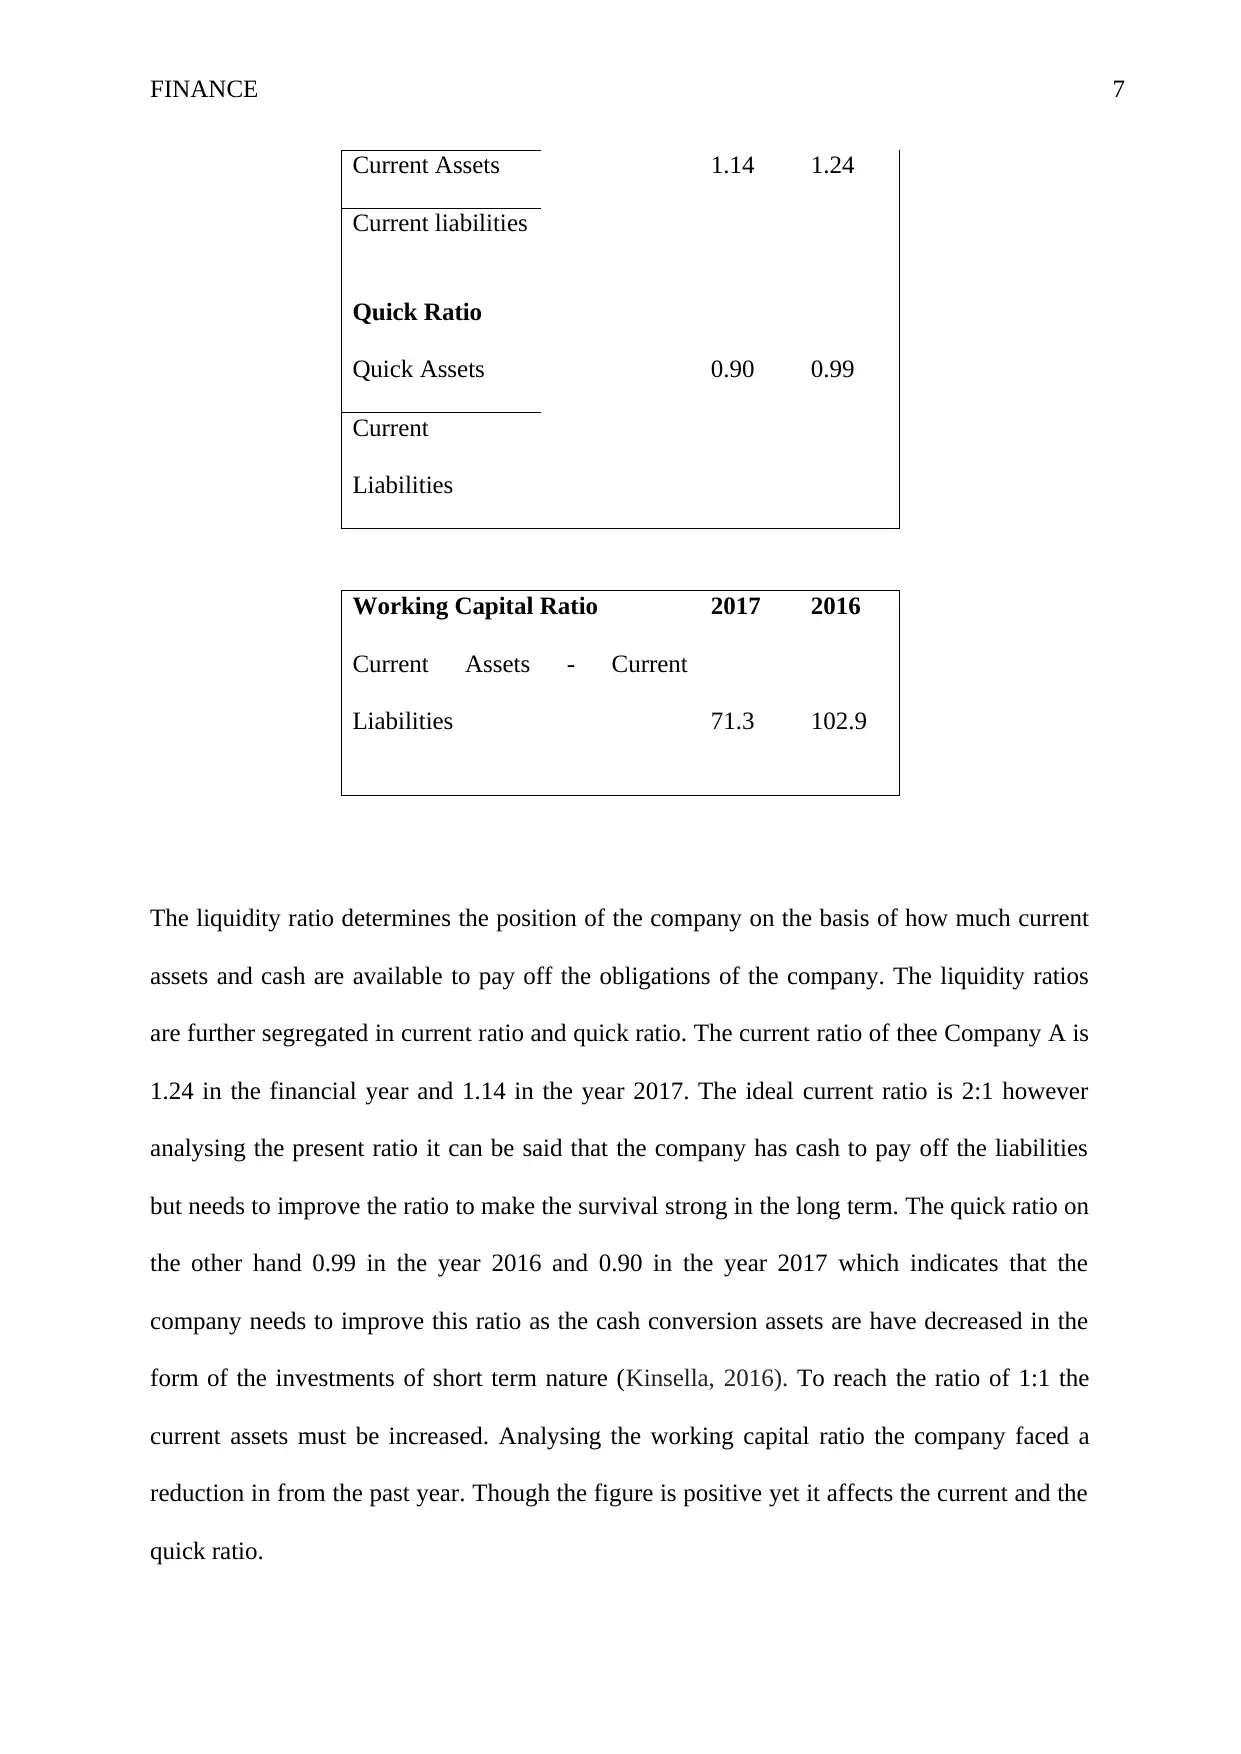
Current Assets 1.14 1.24
Current liabilities
Quick Ratio
Quick Assets 0.90 0.99
Current
Liabilities
Working Capital Ratio 2017 2016
Current Assets - Current
Liabilities 71.3 102.9
The liquidity ratio determines the position of the company on the basis of how much current
assets and cash are available to pay off the obligations of the company. The liquidity ratios
are further segregated in current ratio and quick ratio. The current ratio of thee Company A is
1.24 in the financial year and 1.14 in the year 2017. The ideal current ratio is 2:1 however
analysing the present ratio it can be said that the company has cash to pay off the liabilities
but needs to improve the ratio to make the survival strong in the long term. The quick ratio on
the other hand 0.99 in the year 2016 and 0.90 in the year 2017 which indicates that the
company needs to improve this ratio as the cash conversion assets are have decreased in the
form of the investments of short term nature (Kinsella, 2016). To reach the ratio of 1:1 the
current assets must be increased. Analysing the working capital ratio the company faced a
reduction in from the past year. Though the figure is positive yet it affects the current and the
quick ratio.
FINANCE 8
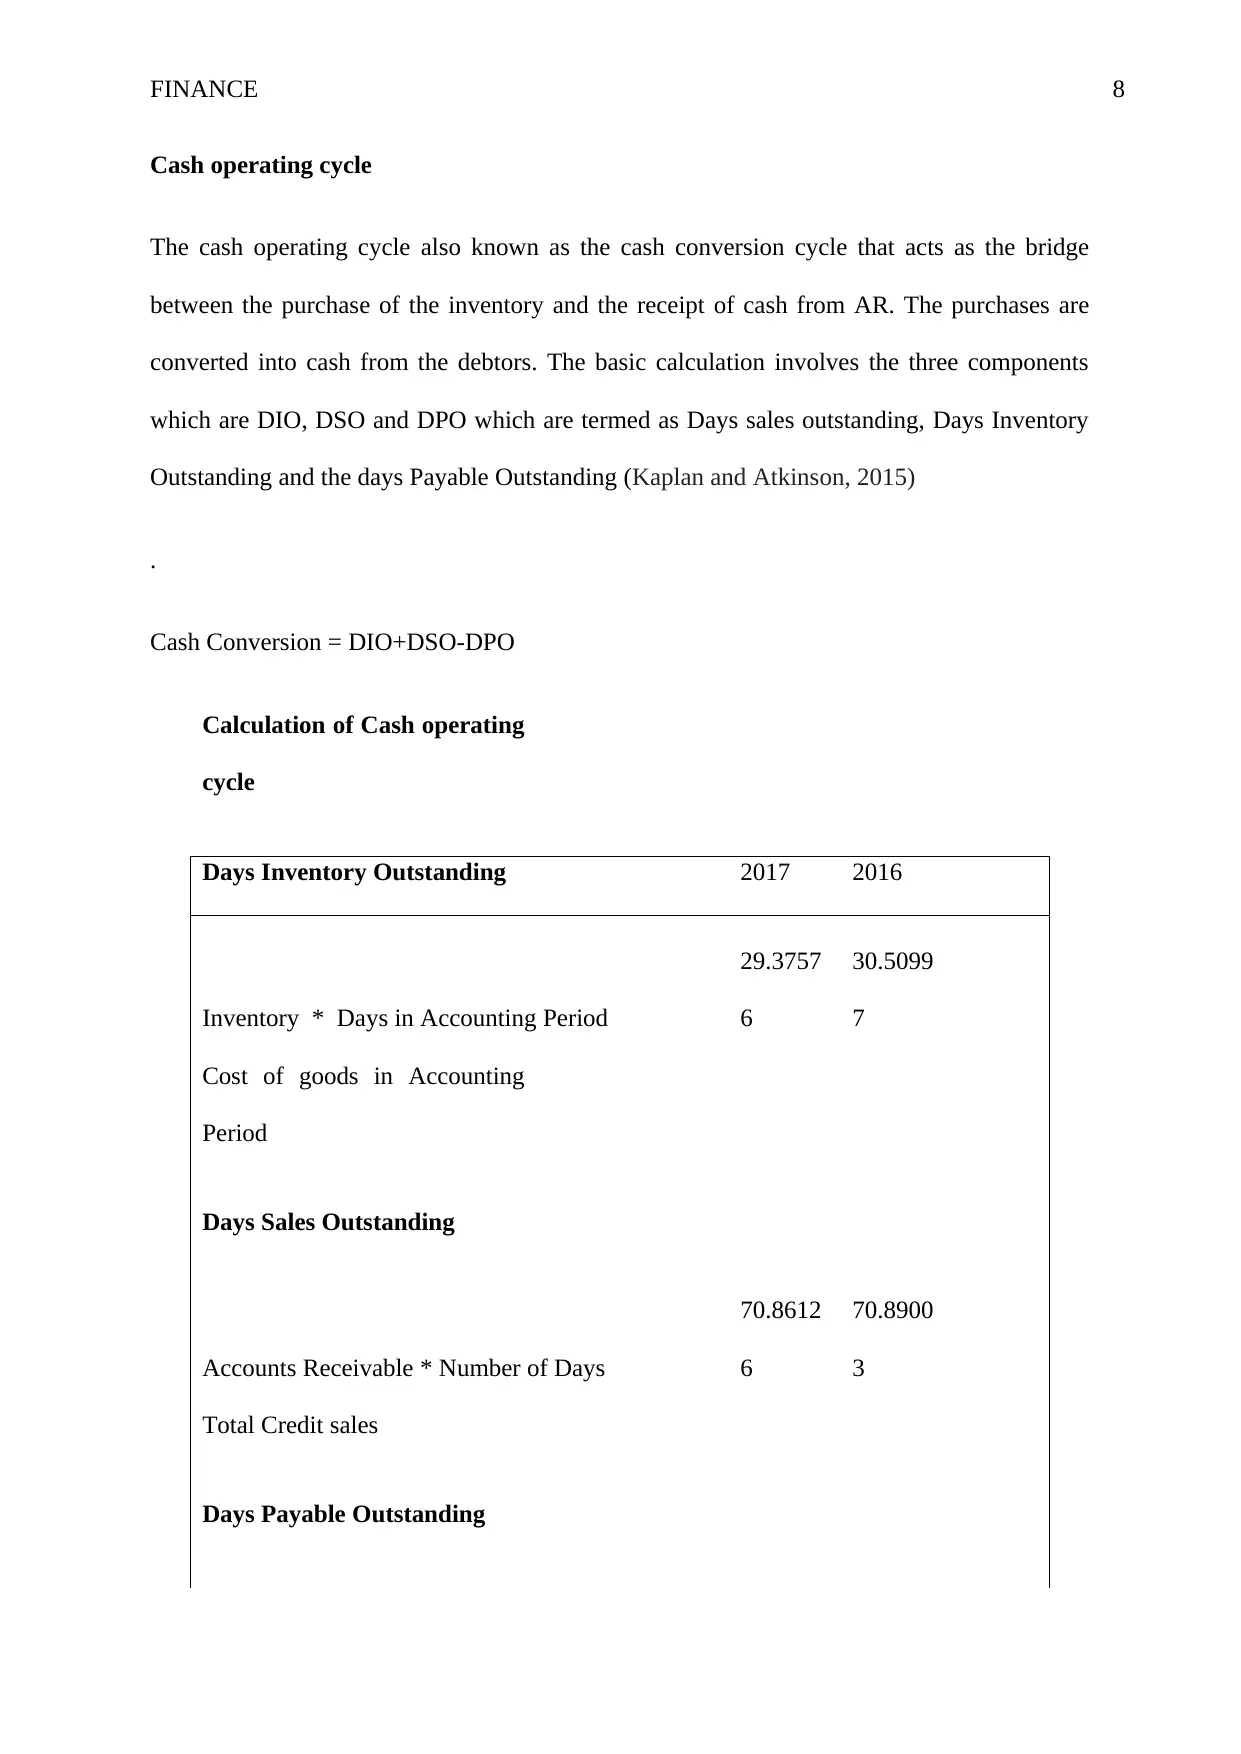
Cash operating cycle
The cash operating cycle also known as the cash conversion cycle that acts as the bridge
between the purchase of the inventory and the receipt of cash from AR. The purchases are
converted into cash from the debtors. The basic calculation involves the three components
which are DIO, DSO and DPO which are termed as Days sales outstanding, Days Inventory
Outstanding and the days Payable Outstanding (Kaplan and Atkinson, 2015)
.
Cash Conversion = DIO+DSO-DPO
Calculation of Cash operating
cycle
Days Inventory Outstanding 2017 2016
Inventory * Days in Accounting Period
29.3757
6
30.5099
7
Cost of goods in Accounting
Period
Days Sales Outstanding
Accounts Receivable * Number of Days
70.8612
6
70.8900
3
Total Credit sales
Days Payable Outstanding
FINANCE 9
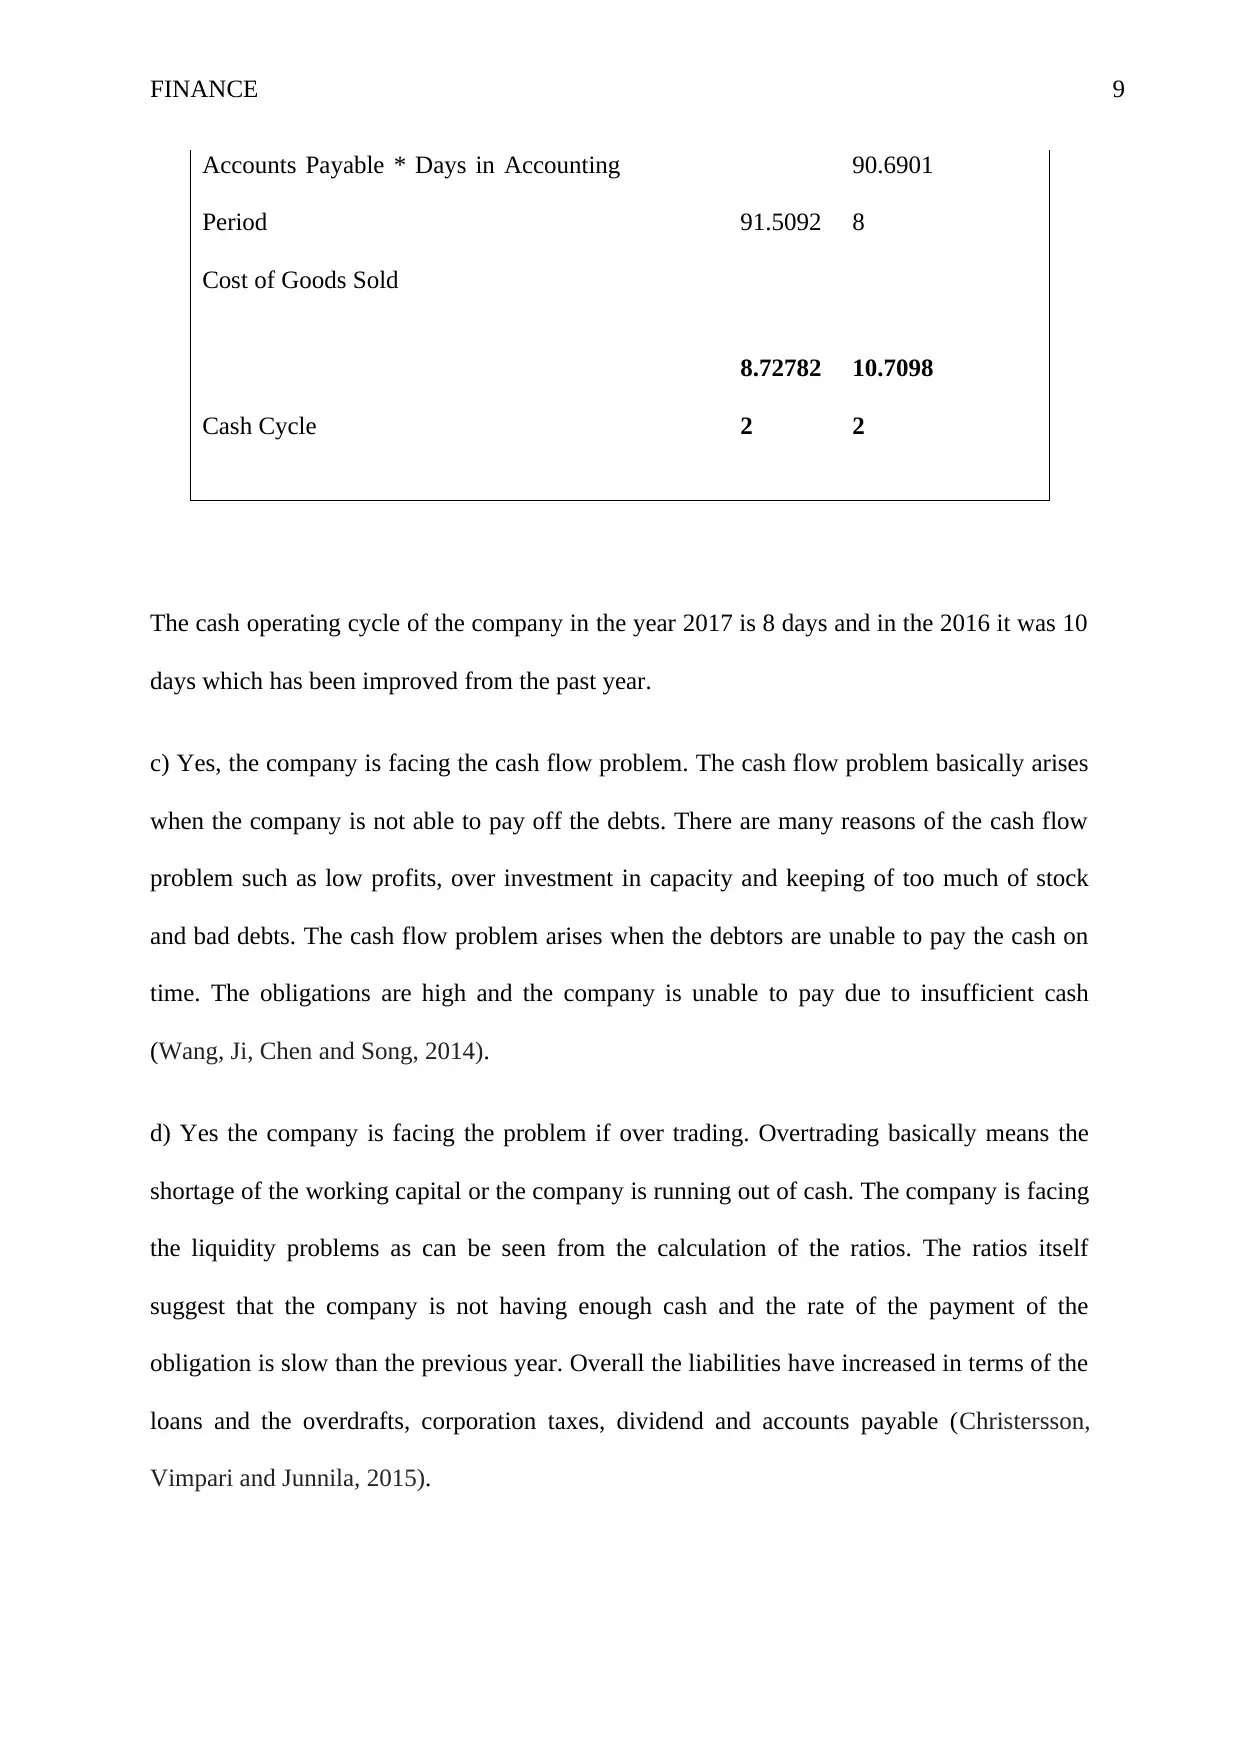
Accounts Payable * Days in Accounting
Period 91.5092
90.6901
8
Cost of Goods Sold
Cash Cycle
8.72782
2
10.7098
2
The cash operating cycle of the company in the year 2017 is 8 days and in the 2016 it was 10
days which has been improved from the past year.
c) Yes, the company is facing the cash flow problem. The cash flow problem basically arises
when the company is not able to pay off the debts. There are many reasons of the cash flow
problem such as low profits, over investment in capacity and keeping of too much of stock
and bad debts. The cash flow problem arises when the debtors are unable to pay the cash on
time. The obligations are high and the company is unable to pay due to insufficient cash
(Wang, Ji, Chen and Song, 2014).
d) Yes the company is facing the problem if over trading. Overtrading basically means the
shortage of the working capital or the company is running out of cash. The company is facing
the liquidity problems as can be seen from the calculation of the ratios. The ratios itself
suggest that the company is not having enough cash and the rate of the payment of the
obligation is slow than the previous year. Overall the liabilities have increased in terms of the
loans and the overdrafts, corporation taxes, dividend and accounts payable (Christersson,
Vimpari and Junnila, 2015).
Secure Best Marks with AI Grader
Need help grading? Try our AI Grader for instant feedback on your assignments.
FINANCE 10
References
Ben-Horin, M. and Kroll, Y., (2017) A simple intuitive NPV-IRR consistent ranking. The
Quarterly Review of Economics and Finance, 66, pp.108-114.
Christersson, M., Vimpari, J. and Junnila, S., (2015) Assessment of financial potential of real
estate energy efficiency investments–a discounted cash flow approach. Sustainable Cities and
Society, 18, pp.66-73.
Copiello, S., (2016) A Discounted Cash Flow variant to detect the optimal amount of
additional burdens in Public-Private Partnership transactions. MethodsX, 3, pp.195-204.
Del Fabbro, B., Valentinčič, A. and Gubina, A.F., (2016) An adequate required rate of return
for grid-connected PV systems. Solar Energy, 132, pp.73-83.
Kaplan, R.S. and Atkinson, A.A., (2015) Advanced management accounting. PHI Learning.
Kinsella, J.J., (2016) Ratio metric current measurement. U.S. Patent Application 14/971,939.
Lane, K. and Rosewall, T., (2015) Firms’ investment decisions and interest rates. Reserve
Bank of Australia Bulletin. June quarter, pp.1-7.
Osborne, M. and O'Reilly, E., (2015) A model illustrating multiple interest rate analysis
(MIRA).
Osborne, M.J., (2010) A resolution to the NPV–IRR debate?. The Quarterly Review of
Economics and Finance, 50(2), pp.234-239.
Patrick, M. and French, N., (2016) The internal rate of return (IRR): projections, benchmarks
and pitfalls. Journal of Property Investment & Finance, 34(6), pp.664-669.
FINANCE 11
Santandrea, M., Sironi, A., Grassi, L. and Giorgino, M., (2017) Concentration risk and
internal rate of return: Evidence from the infrastructure equity market. International Journal
of Project Management, 35(3), pp.241-251.
Schwarzbichler, M., Steiner, C. and Turnheim, D., (2018) Economic Portfolio Decisions.
In Financial Steering (pp. 253-264). Springer, Cham.
Setiawan, D. and Fahrurrozi, N.R., (2017) November. Feasibility analysis with capital
budgeting backbone network fiber optic cable west palapa ring. In Broadband
Communication, Wireless Sensors and Powering (BCWSP), 2017 International Conference
on (pp. 1-4). IEEE.
Wang, Y., Ji, Y., Chen, X. and Song, C., (2014) Inflation, operating cycle, and cash
holdings. China Journal of Accounting Research, 7(4), pp.263-276.
1 out of 12
Related Documents


Your All-in-One AI-Powered Toolkit for Academic Success.
+13062052269
info@desklib.com
Available 24*7 on WhatsApp / Email
![[object Object]](/_next/static/media/star-bottom.7253800d.svg)
Unlock your academic potential
© 2024 | Zucol Services PVT LTD | All rights reserved.