Corporate Finance: Investment Decision Analysis for Blue Mountain Ltd
VerifiedAdded on 2023/01/09
|8
|2294
|21
Report
AI Summary
This report provides a comprehensive analysis of an investment decision project evaluation for Blue Mountain Ltd, focusing on corporate finance principles. Part A of the report examines the investment decision to introduce a new product, including the calculation of Net Present Value (NPV), Internal Rate of Return (IRR), Profitability Index (PI), and Payback Period. The financial analysis utilizes Excel formulas to assess the project's viability. Part B delves into dividend policy and capital structure, discussing the principle of dividend irrelevance and its implications, as well as the impact of debt acquisition and capital expenditure on a company's financial health. The report concludes by highlighting the importance of considering both investment decisions and financial policies to maximize shareholder value, referencing key financial concepts and relevant academic literature. The analysis includes a discussion on the impact of dividend policy and capital structure decisions on the company's financial health and valuation.

Investment decision -
project evaluation
project evaluation
Paraphrase This Document
Need a fresh take? Get an instant paraphrase of this document with our AI Paraphraser
INTRODUCTION
Corporate finance is the financing section which interacts with how companies
approach with sources of financing, capital structure and investment decisions (Johnson, 2019).It
main focuses mainly on optimizing shareholder interest through long-term and short-term
strategic preparation and the execution of various approaches. Capital expenditure initiatives
vary from business management operations to investment banking.
In this report, investment decision for Blue Mountain Ltd in order to introduce new product
is discussed. In addition, the part B of report describes the financial decision included dividend
and capital structure is elaborated.
PART A
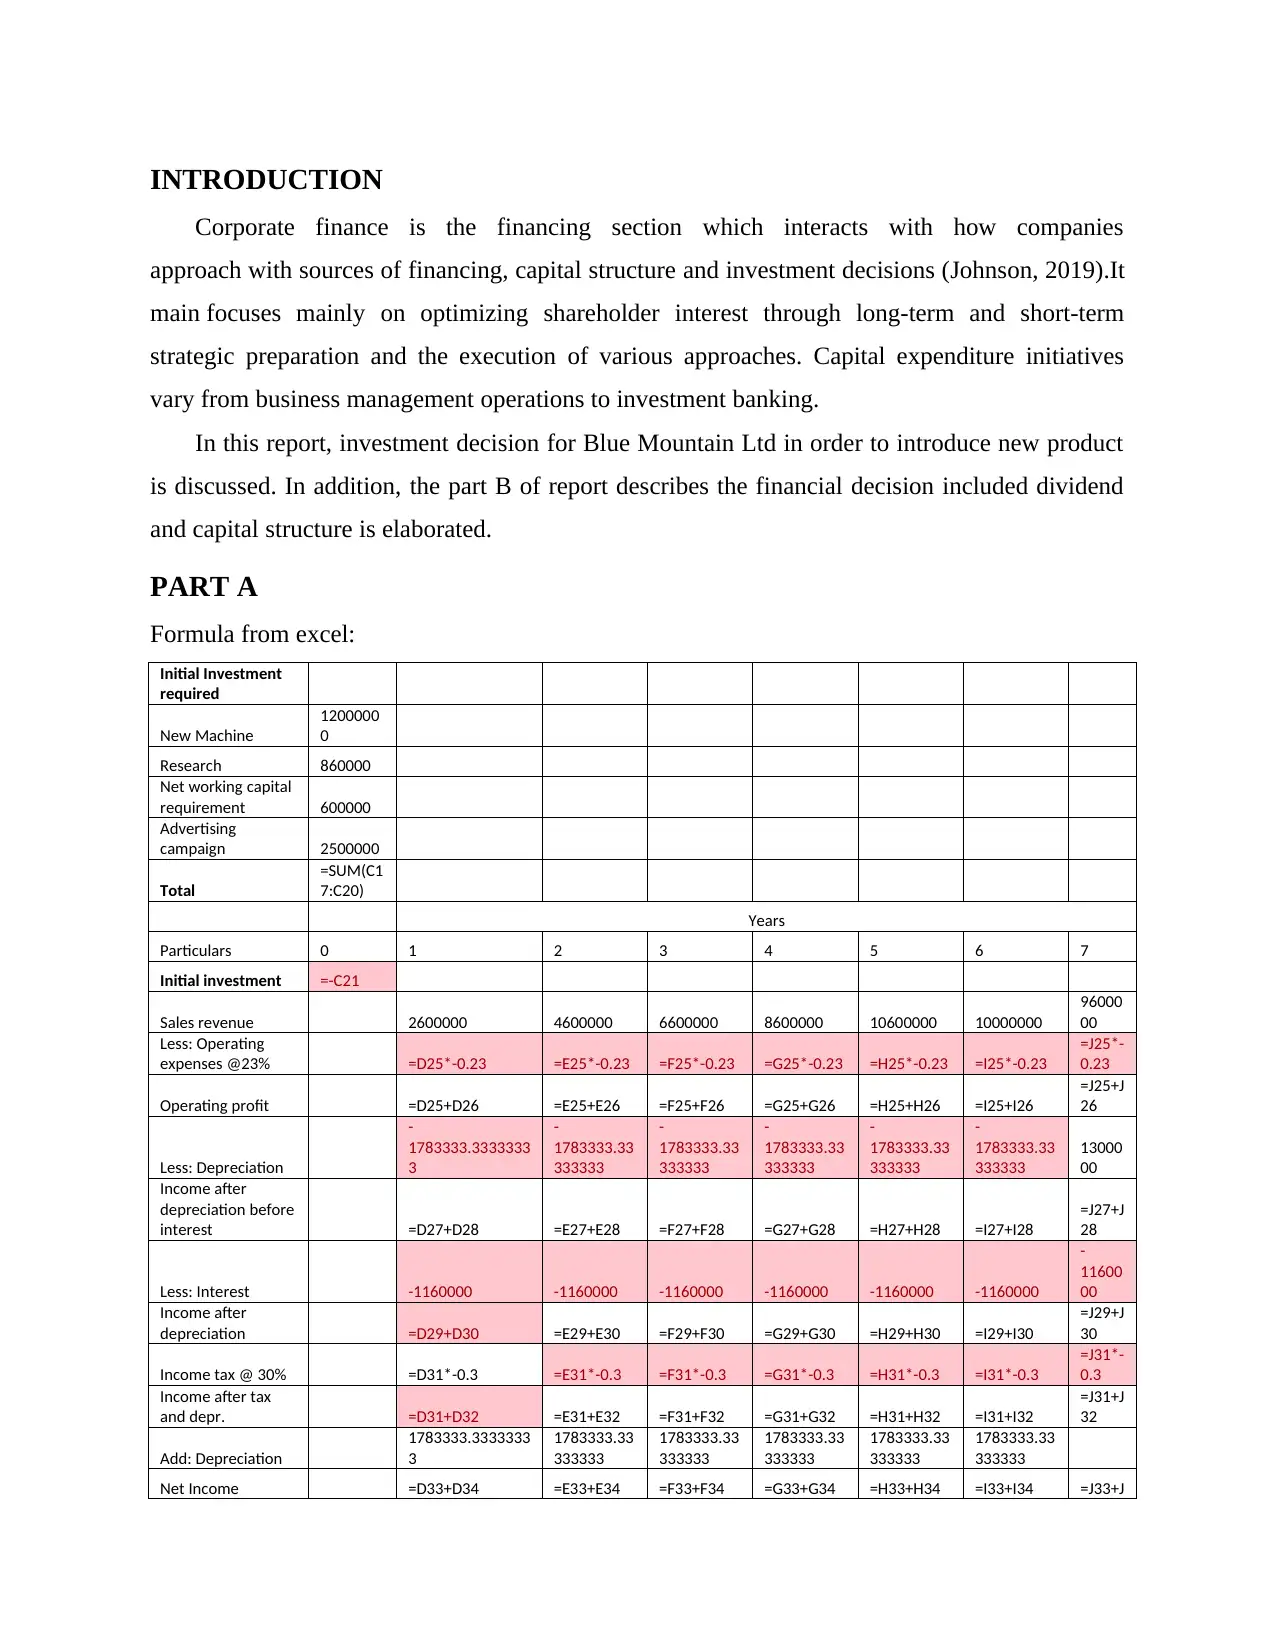
Formula from excel:
Initial Investment
required
New Machine
1200000
0
Research 860000
Net working capital
requirement 600000
Advertising
campaign 2500000
Total
=SUM(C1
7:C20)
Years
Particulars 0 1 2 3 4 5 6 7
Initial investment =-C21
Sales revenue 2600000 4600000 6600000 8600000 10600000 10000000
96000
00
Less: Operating
expenses @23% =D25*-0.23 =E25*-0.23 =F25*-0.23 =G25*-0.23 =H25*-0.23 =I25*-0.23
=J25*-
0.23
Operating profit =D25+D26 =E25+E26 =F25+F26 =G25+G26 =H25+H26 =I25+I26
=J25+J
26
Less: Depreciation
-
1783333.3333333
3
-
1783333.33
333333
-
1783333.33
333333
-
1783333.33
333333
-
1783333.33
333333
-
1783333.33
333333
13000
00
Income after
depreciation before
interest =D27+D28 =E27+E28 =F27+F28 =G27+G28 =H27+H28 =I27+I28
=J27+J
28
Less: Interest -1160000 -1160000 -1160000 -1160000 -1160000 -1160000
-
11600
00
Income after
depreciation =D29+D30 =E29+E30 =F29+F30 =G29+G30 =H29+H30 =I29+I30
=J29+J
30
Income tax @ 30% =D31*-0.3 =E31*-0.3 =F31*-0.3 =G31*-0.3 =H31*-0.3 =I31*-0.3
=J31*-
0.3
Income after tax
and depr. =D31+D32 =E31+E32 =F31+F32 =G31+G32 =H31+H32 =I31+I32
=J31+J
32
Add: Depreciation
1783333.3333333
3
1783333.33
333333
1783333.33
333333
1783333.33
333333
1783333.33
333333
1783333.33
333333
Net Income =D33+D34 =E33+E34 =F33+F34 =G33+G34 =H33+H34 =I33+I34 =J33+J
Corporate finance is the financing section which interacts with how companies
approach with sources of financing, capital structure and investment decisions (Johnson, 2019).It
main focuses mainly on optimizing shareholder interest through long-term and short-term
strategic preparation and the execution of various approaches. Capital expenditure initiatives
vary from business management operations to investment banking.
In this report, investment decision for Blue Mountain Ltd in order to introduce new product
is discussed. In addition, the part B of report describes the financial decision included dividend
and capital structure is elaborated.
PART A
Formula from excel:
Initial Investment
required
New Machine
1200000
0
Research 860000
Net working capital
requirement 600000
Advertising
campaign 2500000
Total
=SUM(C1
7:C20)
Years
Particulars 0 1 2 3 4 5 6 7
Initial investment =-C21
Sales revenue 2600000 4600000 6600000 8600000 10600000 10000000
96000
00
Less: Operating
expenses @23% =D25*-0.23 =E25*-0.23 =F25*-0.23 =G25*-0.23 =H25*-0.23 =I25*-0.23
=J25*-
0.23
Operating profit =D25+D26 =E25+E26 =F25+F26 =G25+G26 =H25+H26 =I25+I26
=J25+J
26
Less: Depreciation
-
1783333.3333333
3
-
1783333.33
333333
-
1783333.33
333333
-
1783333.33
333333
-
1783333.33
333333
-
1783333.33
333333
13000
00
Income after
depreciation before
interest =D27+D28 =E27+E28 =F27+F28 =G27+G28 =H27+H28 =I27+I28
=J27+J
28
Less: Interest -1160000 -1160000 -1160000 -1160000 -1160000 -1160000
-
11600
00
Income after
depreciation =D29+D30 =E29+E30 =F29+F30 =G29+G30 =H29+H30 =I29+I30
=J29+J
30
Income tax @ 30% =D31*-0.3 =E31*-0.3 =F31*-0.3 =G31*-0.3 =H31*-0.3 =I31*-0.3
=J31*-
0.3
Income after tax
and depr. =D31+D32 =E31+E32 =F31+F32 =G31+G32 =H31+H32 =I31+I32
=J31+J
32
Add: Depreciation
1783333.3333333
3
1783333.33
333333
1783333.33
333333
1783333.33
333333
1783333.33
333333
1783333.33
333333
Net Income =D33+D34 =E33+E34 =F33+F34 =G33+G34 =H33+H34 =I33+I34 =J33+J
34
Add: Additional
revenue after tax 1160000 1160000 1160000 1160000 1160000 1160000
11600
00
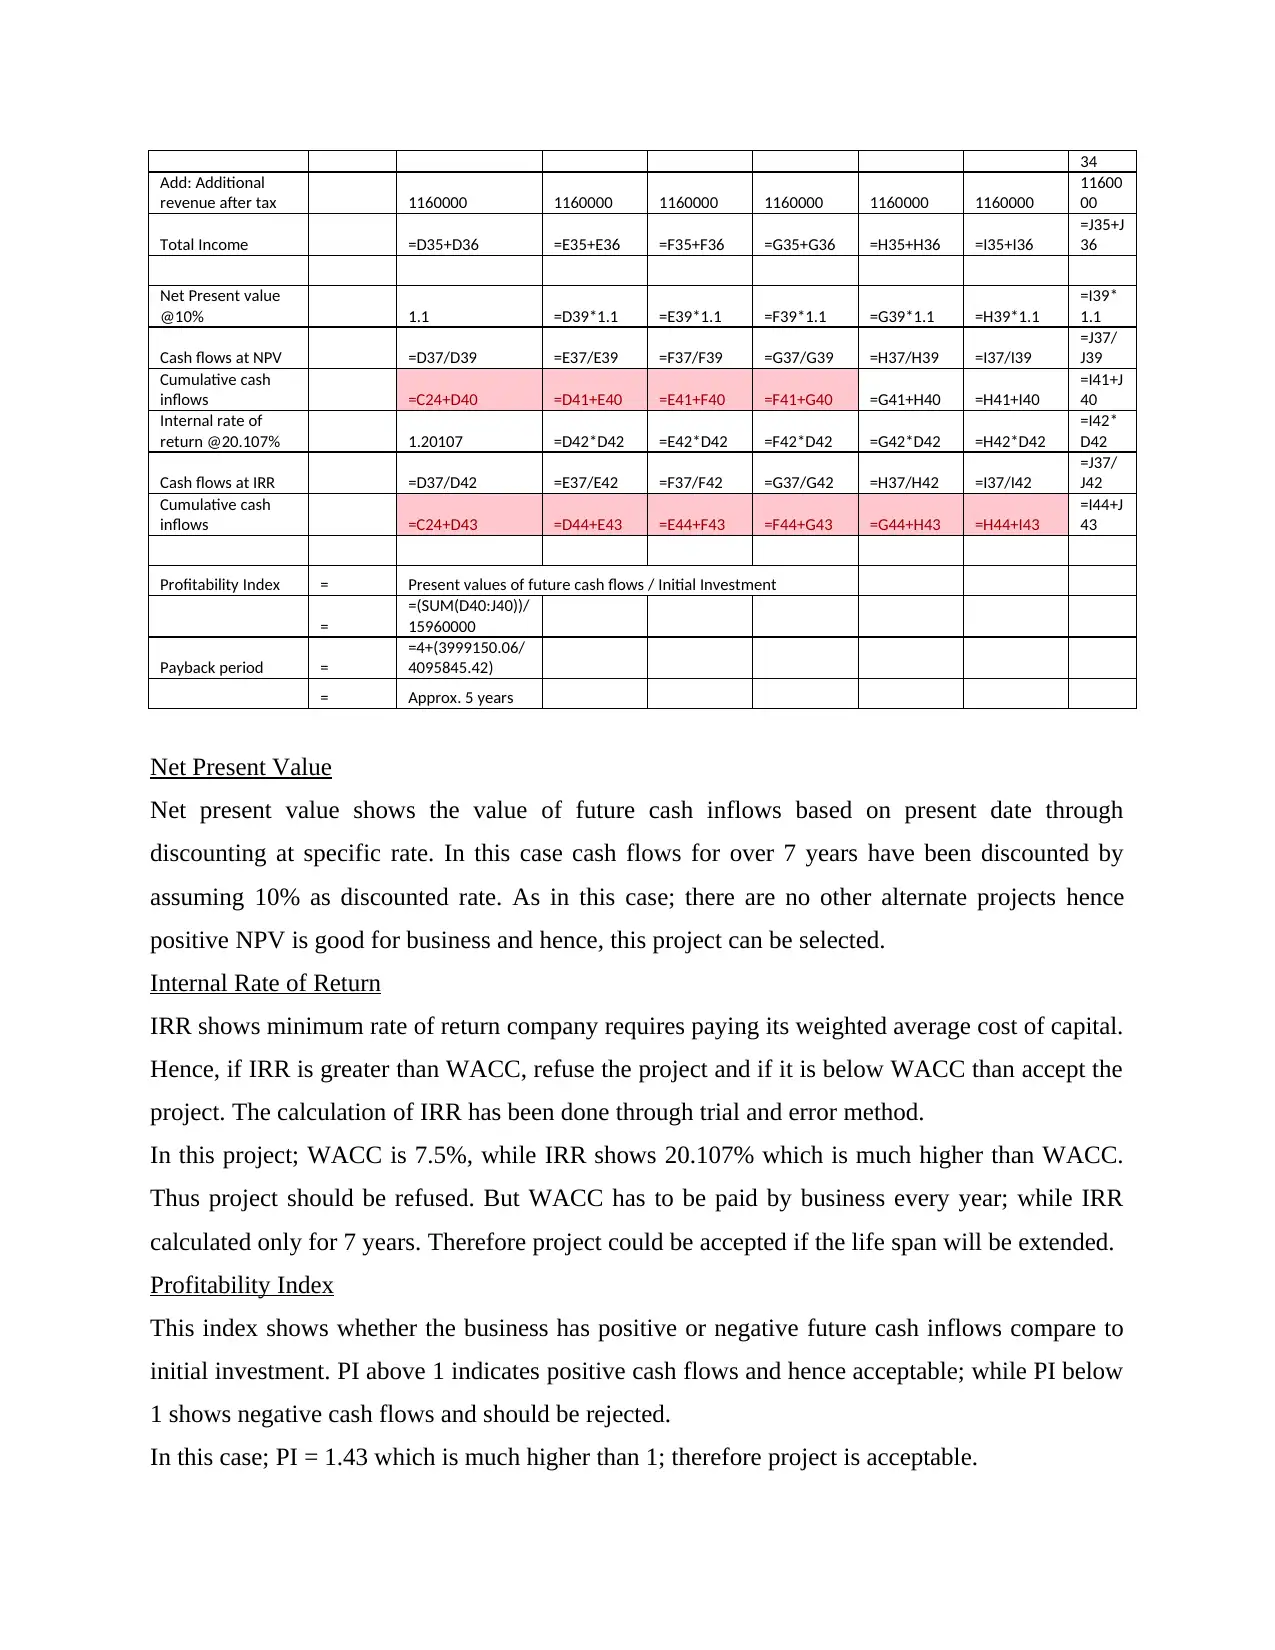
Total Income =D35+D36 =E35+E36 =F35+F36 =G35+G36 =H35+H36 =I35+I36
=J35+J
36
Net Present value
@10% 1.1 =D39*1.1 =E39*1.1 =F39*1.1 =G39*1.1 =H39*1.1
=I39*
1.1
Cash flows at NPV =D37/D39 =E37/E39 =F37/F39 =G37/G39 =H37/H39 =I37/I39
=J37/
J39
Cumulative cash
inflows =C24+D40 =D41+E40 =E41+F40 =F41+G40 =G41+H40 =H41+I40
=I41+J
40
Internal rate of
return @20.107% 1.20107 =D42*D42 =E42*D42 =F42*D42 =G42*D42 =H42*D42
=I42*
D42
Cash flows at IRR =D37/D42 =E37/E42 =F37/F42 =G37/G42 =H37/H42 =I37/I42
=J37/
J42
Cumulative cash
inflows =C24+D43 =D44+E43 =E44+F43 =F44+G43 =G44+H43 =H44+I43
=I44+J
43
Profitability Index = Present values of future cash flows / Initial Investment
=
=(SUM(D40:J40))/
15960000
Payback period =
=4+(3999150.06/
4095845.42)
= Approx. 5 years
Net Present Value
Net present value shows the value of future cash inflows based on present date through
discounting at specific rate. In this case cash flows for over 7 years have been discounted by
assuming 10% as discounted rate. As in this case; there are no other alternate projects hence
positive NPV is good for business and hence, this project can be selected.
Internal Rate of Return
IRR shows minimum rate of return company requires paying its weighted average cost of capital.
Hence, if IRR is greater than WACC, refuse the project and if it is below WACC than accept the
project. The calculation of IRR has been done through trial and error method.
In this project; WACC is 7.5%, while IRR shows 20.107% which is much higher than WACC.
Thus project should be refused. But WACC has to be paid by business every year; while IRR
calculated only for 7 years. Therefore project could be accepted if the life span will be extended.
Profitability Index
This index shows whether the business has positive or negative future cash inflows compare to
initial investment. PI above 1 indicates positive cash flows and hence acceptable; while PI below
1 shows negative cash flows and should be rejected.
In this case; PI = 1.43 which is much higher than 1; therefore project is acceptable.
Add: Additional
revenue after tax 1160000 1160000 1160000 1160000 1160000 1160000
11600
00
Total Income =D35+D36 =E35+E36 =F35+F36 =G35+G36 =H35+H36 =I35+I36
=J35+J
36
Net Present value
@10% 1.1 =D39*1.1 =E39*1.1 =F39*1.1 =G39*1.1 =H39*1.1
=I39*
1.1
Cash flows at NPV =D37/D39 =E37/E39 =F37/F39 =G37/G39 =H37/H39 =I37/I39
=J37/
J39
Cumulative cash
inflows =C24+D40 =D41+E40 =E41+F40 =F41+G40 =G41+H40 =H41+I40
=I41+J
40
Internal rate of
return @20.107% 1.20107 =D42*D42 =E42*D42 =F42*D42 =G42*D42 =H42*D42
=I42*
D42
Cash flows at IRR =D37/D42 =E37/E42 =F37/F42 =G37/G42 =H37/H42 =I37/I42
=J37/
J42
Cumulative cash
inflows =C24+D43 =D44+E43 =E44+F43 =F44+G43 =G44+H43 =H44+I43
=I44+J
43
Profitability Index = Present values of future cash flows / Initial Investment
=
=(SUM(D40:J40))/
15960000
Payback period =
=4+(3999150.06/
4095845.42)
= Approx. 5 years
Net Present Value
Net present value shows the value of future cash inflows based on present date through
discounting at specific rate. In this case cash flows for over 7 years have been discounted by
assuming 10% as discounted rate. As in this case; there are no other alternate projects hence
positive NPV is good for business and hence, this project can be selected.
Internal Rate of Return
IRR shows minimum rate of return company requires paying its weighted average cost of capital.
Hence, if IRR is greater than WACC, refuse the project and if it is below WACC than accept the
project. The calculation of IRR has been done through trial and error method.
In this project; WACC is 7.5%, while IRR shows 20.107% which is much higher than WACC.
Thus project should be refused. But WACC has to be paid by business every year; while IRR
calculated only for 7 years. Therefore project could be accepted if the life span will be extended.
Profitability Index
This index shows whether the business has positive or negative future cash inflows compare to
initial investment. PI above 1 indicates positive cash flows and hence acceptable; while PI below
1 shows negative cash flows and should be rejected.
In this case; PI = 1.43 which is much higher than 1; therefore project is acceptable.
⊘ This is a preview!⊘
Do you want full access?
Subscribe today to unlock all pages.
Trusted by 1+ million students worldwide
Payback period
There’s no other project from which payback period could be matched; here discounted payback
period at the rate of 10% has been considered. The result shows initial investment can be covered
before 5th year and hence it is acceptable.
PART B
Dividend policy and capital structure:
The principle of dividend irrelevance maintains the assumption that dividends have little
impact on the market price of a firm. A dividend is usually a monetary pay out paid to the
owners from a company's earnings as a compensation for investment in the corporation. The
principle of capital structure irrelevance goes on to state that dividends will harm the potential of
a firm to remain profitable over the long run because the capital will be best spent reinvested in
the business to produce income (Lerner and Seru, 2017).It also implies that the announcement of
a corporation and the distribution of dividends will have little as well as minor impact on the
market price. Unless this principle is valid, then dividends will not contribute positively to the
market price of a business. The theory's assumption is that the potential of a corporation to make
a profit and expand its profits defines the market interest of a company which influences the
share price; not investment returns. Many who engage in the principle of capital structure
irrelevance claim that dividends give investors little additional value, and in some situations
suggest that cash flows will harm the company's financial position.
The hypothesis of dividend irrelevance claims that perhaps the economics works
successfully and that every dividend distribution would result in a decrease in the share price
even by sum of the dividend. For example, if the market price is $10, and the corporation paid a
profit of $1, the market would decline to $9 a share, a few days later. Keeping the shares for the
distribution then produces little advantage because the market price moves lower with the same
sum of the payment.Though this stock may fall after the dividends was already paid, such stocks
are retained by several dividend-seeking buyers for the steady dividends they give, generating an
enduring degree of demand. Therefore, a firm's stock price is influenced mostly by the dividend
strategy of the business. In a company bookkeeper or analyst conduct valuation experiments to
assess the inherent value of a portfolio. They also include considerations such as cash dividend
Paraphrase This Document
Need a fresh take? Get an instant paraphrase of this document with our AI Paraphraser
as well as financial results and contextual metrics, including standards of personnel, economic
conditions and an appreciation of the role of the business in the market.
The principle of dividend irrelevance implies that the payment of dividends, that is never an
uncommon phenomenon, will damage corporations' economic well-being (Gullifer and Payne,
2015).
Debt acquisition
Dividends will harm a corporation if the business takes on loans to fund their dividend
pay-out money in the form of selling bonds to creditors or leveraging from a banking credit
facilities. Failure to control its leverage, weak management execution and external influences,
like sluggish economic development, may all contribute to the problems of a company.
Industries who do not offer dividends, though, have more capital at hand to allow investments,
grow in properties, and pay off the mortgage with the extra funds.
CAPEX spending
In case if a firm does not spend by capital spending (CAPEX) in its industry, there will be
a reduction in the value of the corporation as profits and undermine the profitability over time.
Capital spending is a major commitment that businesses undertake in maintaining long-term
financial wellbeing, which may involve purchasing houses, infrastructure, facilities, which
acquisitions. Investors purchasing dividend-paying securities seek to determine how a
management team is successfully juggling the dividend pay-outs and investing in their future
(Dang, Li and Yang, 2018).
Considering the principle of irrelevance dividends, a number of investors rely on dividends
while running their investments. For example an actual income policy, aims to define assets that
benefit out of regular returns (i.e. dividend and accrued interest). Although still fairly risk-averse,
existing sales approaches may be integrated through a continuum of risk along a variety of
decision processes.
Income focused plans are typically tailored to homeowners or risk-averse buyers. Such
income-seeking investors are buying securities of proven companies that have the track history
of regularly paying a dividend but are at lower risk of losing a dividend pay-out.Blue-chip
companies typically offer predictable dividends such as the International corporations who were
in business for many years, including Coca-Cola, Disney, PepsiCo, Walmart and McDonald's.
Such businesses are global players of their respective markets and have established brands with
strong quality, overcoming numerous economic downturns. Dividends may also assist in equity
plans that are based on capital management. If a fund takes a loss from a stock market downturn,
dividend returns may partially mitigate such declines, retaining hard-earned profits for an
investor (Damodaran, 2016).
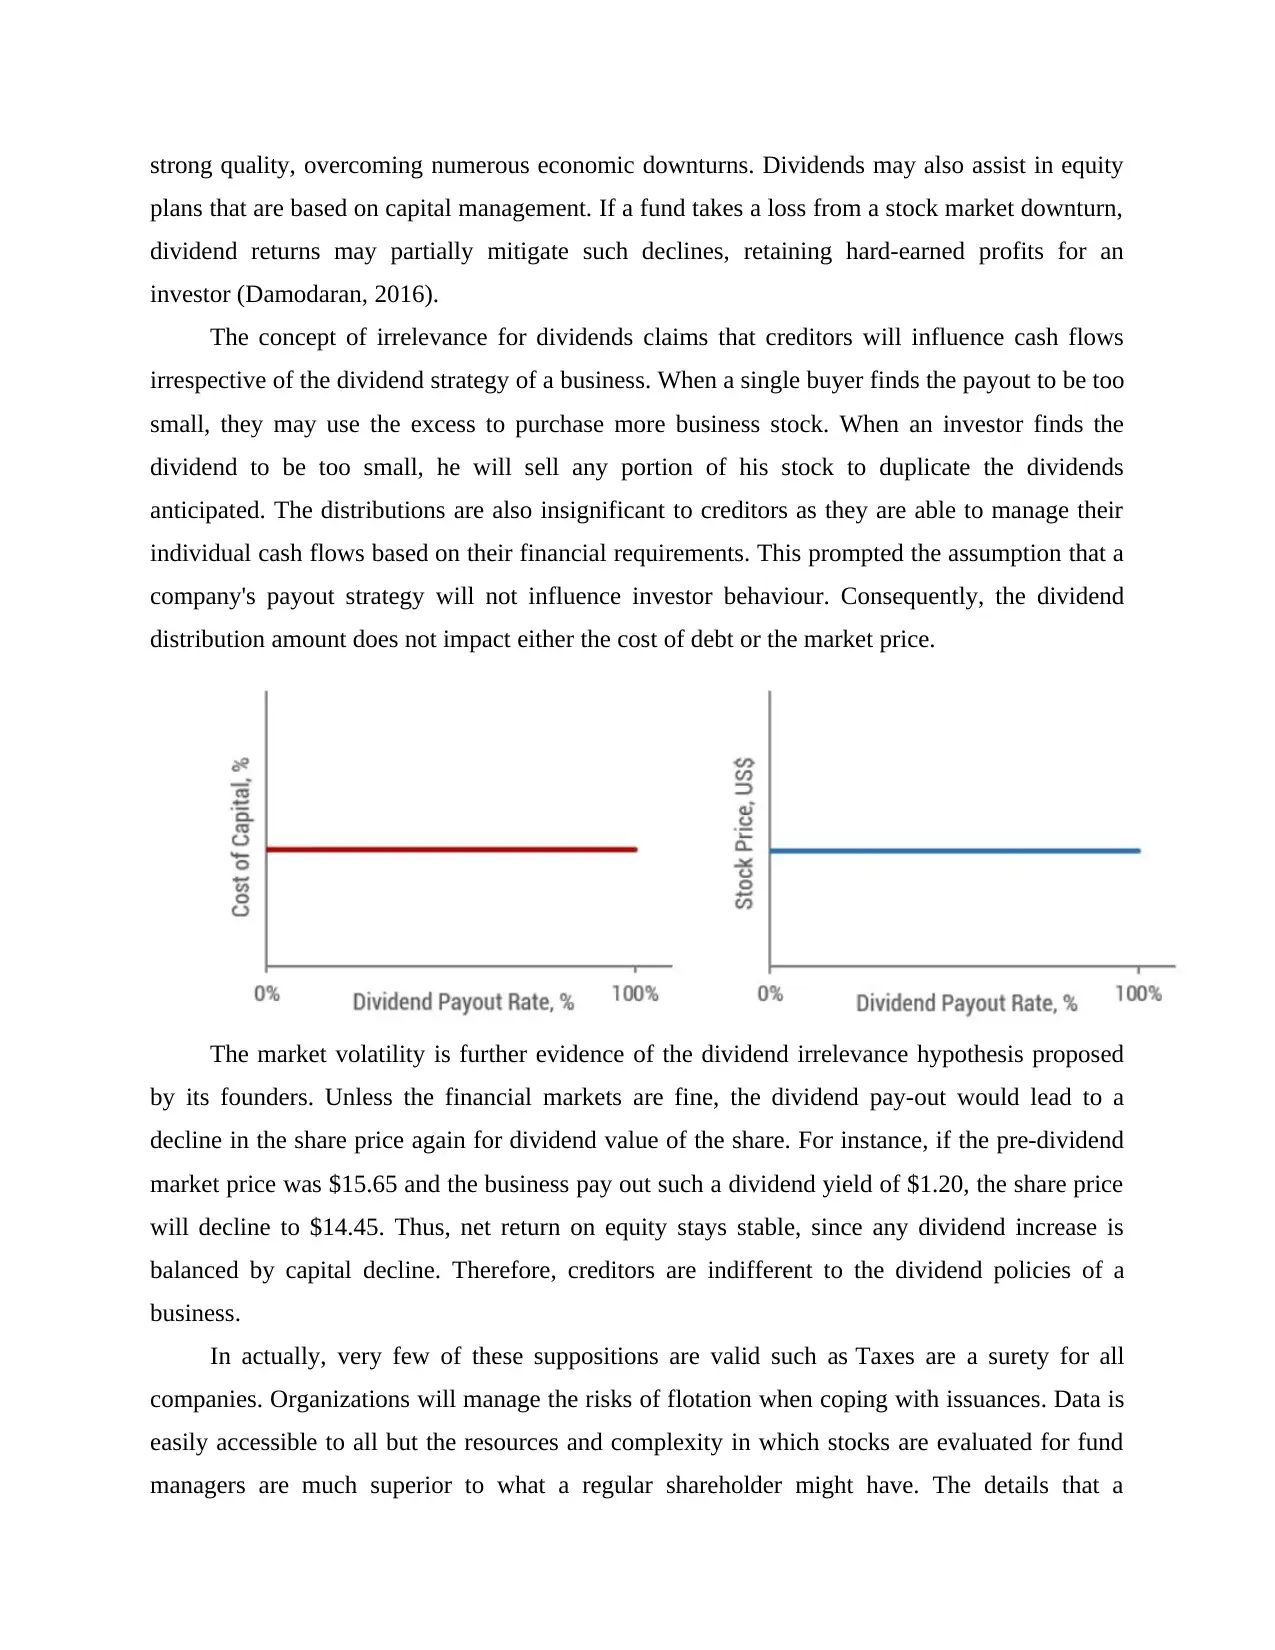
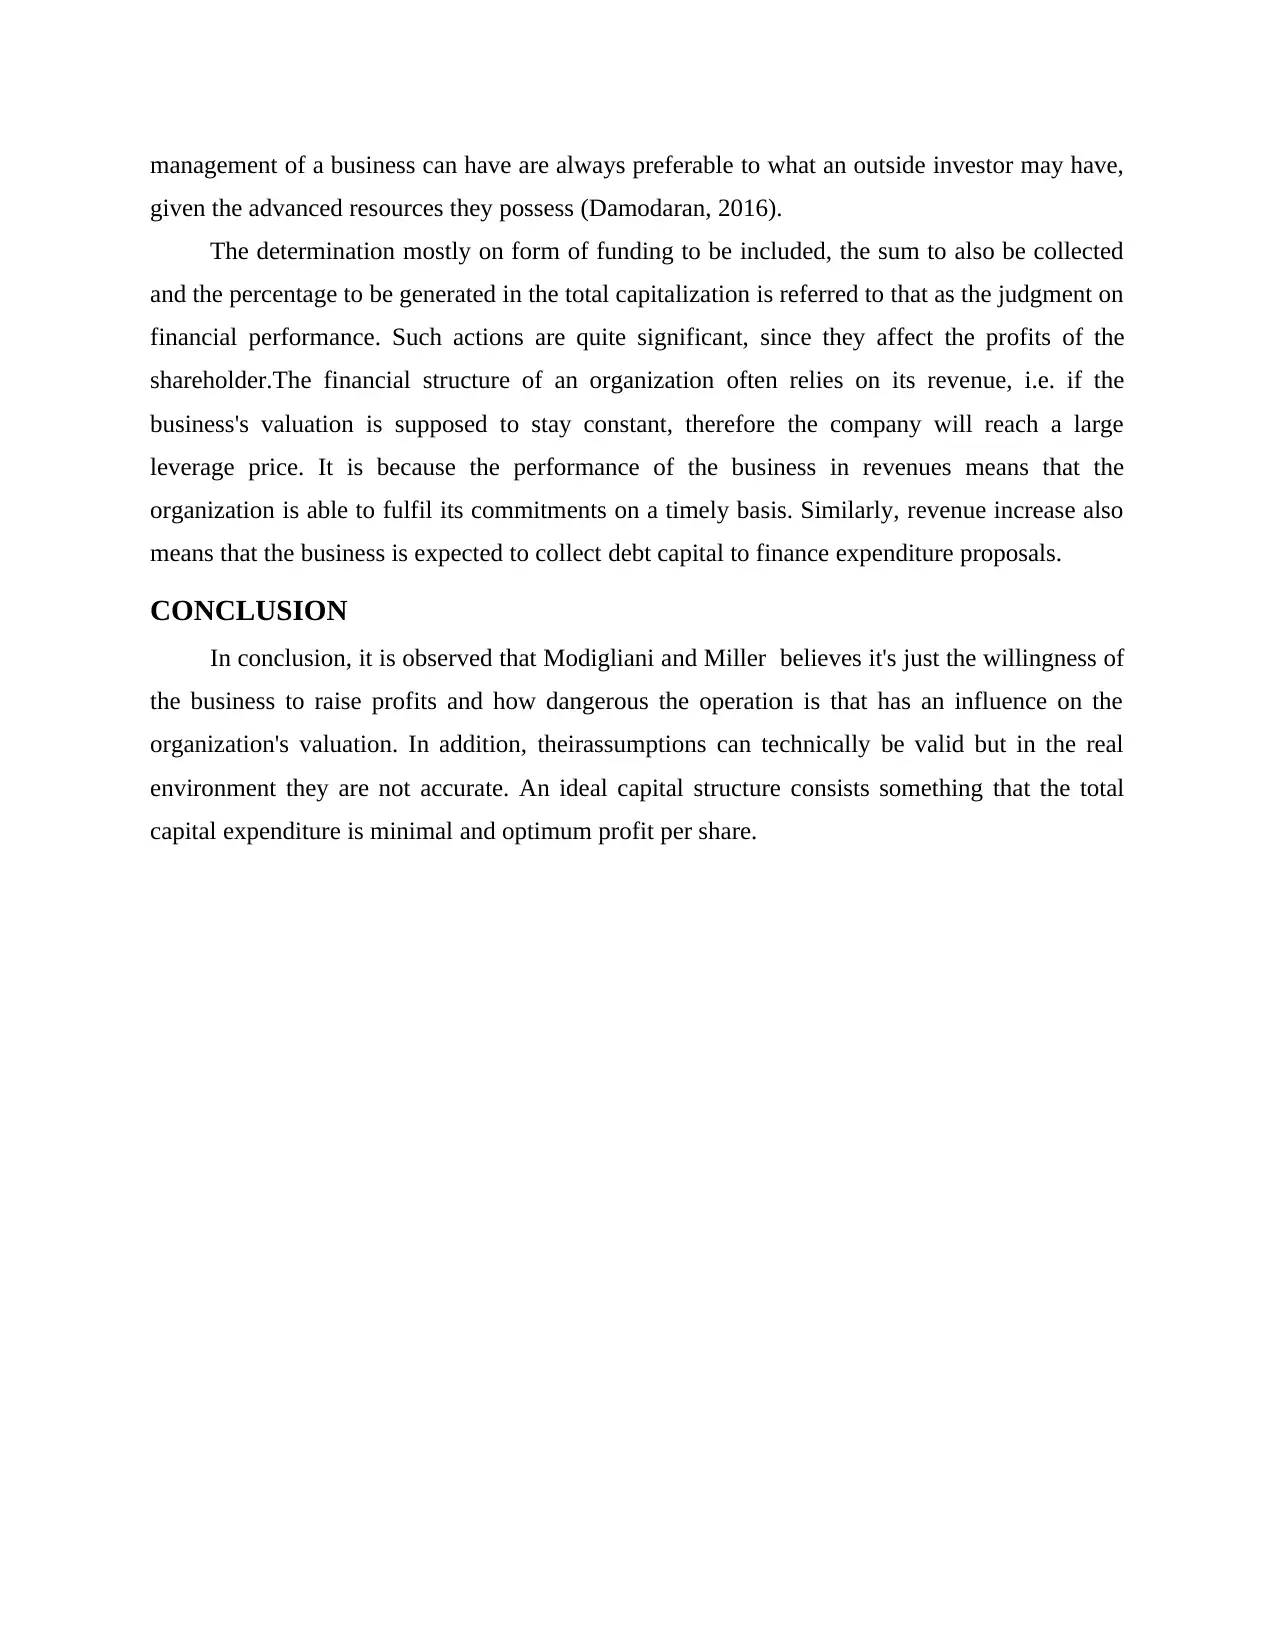
The concept of irrelevance for dividends claims that creditors will influence cash flows
irrespective of the dividend strategy of a business. When a single buyer finds the payout to be too
small, they may use the excess to purchase more business stock. When an investor finds the
dividend to be too small, he will sell any portion of his stock to duplicate the dividends
anticipated. The distributions are also insignificant to creditors as they are able to manage their
individual cash flows based on their financial requirements. This prompted the assumption that a
company's payout strategy will not influence investor behaviour. Consequently, the dividend
distribution amount does not impact either the cost of debt or the market price.
The market volatility is further evidence of the dividend irrelevance hypothesis proposed
by its founders. Unless the financial markets are fine, the dividend pay-out would lead to a
decline in the share price again for dividend value of the share. For instance, if the pre-dividend
market price was $15.65 and the business pay out such a dividend yield of $1.20, the share price
will decline to $14.45. Thus, net return on equity stays stable, since any dividend increase is
balanced by capital decline. Therefore, creditors are indifferent to the dividend policies of a
business.
In actually, very few of these suppositions are valid such as Taxes are a surety for all
companies. Organizations will manage the risks of flotation when coping with issuances. Data is
easily accessible to all but the resources and complexity in which stocks are evaluated for fund
managers are much superior to what a regular shareholder might have. The details that a
plans that are based on capital management. If a fund takes a loss from a stock market downturn,
dividend returns may partially mitigate such declines, retaining hard-earned profits for an
investor (Damodaran, 2016).
The concept of irrelevance for dividends claims that creditors will influence cash flows
irrespective of the dividend strategy of a business. When a single buyer finds the payout to be too
small, they may use the excess to purchase more business stock. When an investor finds the
dividend to be too small, he will sell any portion of his stock to duplicate the dividends
anticipated. The distributions are also insignificant to creditors as they are able to manage their
individual cash flows based on their financial requirements. This prompted the assumption that a
company's payout strategy will not influence investor behaviour. Consequently, the dividend
distribution amount does not impact either the cost of debt or the market price.
The market volatility is further evidence of the dividend irrelevance hypothesis proposed
by its founders. Unless the financial markets are fine, the dividend pay-out would lead to a
decline in the share price again for dividend value of the share. For instance, if the pre-dividend
market price was $15.65 and the business pay out such a dividend yield of $1.20, the share price
will decline to $14.45. Thus, net return on equity stays stable, since any dividend increase is
balanced by capital decline. Therefore, creditors are indifferent to the dividend policies of a
business.
In actually, very few of these suppositions are valid such as Taxes are a surety for all
companies. Organizations will manage the risks of flotation when coping with issuances. Data is
easily accessible to all but the resources and complexity in which stocks are evaluated for fund
managers are much superior to what a regular shareholder might have. The details that a
⊘ This is a preview!⊘
Do you want full access?
Subscribe today to unlock all pages.
Trusted by 1+ million students worldwide
management of a business can have are always preferable to what an outside investor may have,
given the advanced resources they possess (Damodaran, 2016).
The determination mostly on form of funding to be included, the sum to also be collected
and the percentage to be generated in the total capitalization is referred to that as the judgment on
financial performance. Such actions are quite significant, since they affect the profits of the
shareholder.The financial structure of an organization often relies on its revenue, i.e. if the
business's valuation is supposed to stay constant, therefore the company will reach a large
leverage price. It is because the performance of the business in revenues means that the
organization is able to fulfil its commitments on a timely basis. Similarly, revenue increase also
means that the business is expected to collect debt capital to finance expenditure proposals.
CONCLUSION
In conclusion, it is observed that Modigliani and Miller believes it's just the willingness of
the business to raise profits and how dangerous the operation is that has an influence on the
organization's valuation. In addition, theirassumptions can technically be valid but in the real
environment they are not accurate. An ideal capital structure consists something that the total
capital expenditure is minimal and optimum profit per share.
Paraphrase This Document
Need a fresh take? Get an instant paraphrase of this document with our AI Paraphraser

REFERENCES
Books and Journals
Damodaran, A., 2016. Damodaran on valuation: security analysis for investment and corporate
finance (Vol. 324). John Wiley & Sons.
Dang, C., Li, Z.F. and Yang, C., 2018.Measuring firm size in empirical corporate
finance. Journal of Banking & Finance, 86, pp.159-176.
Gullifer, L. and Payne, J., 2015. Corporate finance law: principles and policy. Bloomsbury
Publishing.
Johnson, M., 2019. Corporate finance and the securities laws.Wolters Kluwer Law & Business.
Lerner, J. and Seru, A., 2017. The use and misuse of patent data: Issues for corporate finance
and beyond (No. w24053). National Bureau of Economic Research.
1 out of 8
Related Documents


Your All-in-One AI-Powered Toolkit for Academic Success.
+13062052269
info@desklib.com
Available 24*7 on WhatsApp / Email
![[object Object]](/_next/static/media/star-bottom.7253800d.svg)
Unlock your academic potential
Copyright © 2020–2026 A2Z Services. All Rights Reserved. Developed and managed by ZUCOL.