NIT6130 - Investment and Profitability Analysis in Australia
VerifiedAdded on 2023/06/16
|15
|2395
|443
Report
AI Summary
This report investigates the relationship between investment and profitability levels within Australian companies, utilizing secondary data from the Australian Prudential Regulation Authority (APRA) spanning from 2000 onwards. The study employs a descriptive design and mixed-methods approach, focusing on companies in agriculture, mining, automobile, and service sectors. Data pre-processing techniques, including filtration and resampling, are applied to refine the raw data, followed by dimension reduction to focus on relevant features. A fixed-effects regression model is used to analyze the impact of investment and labor motivation on net profit. The findings suggest that investment significantly influences profitability, while the impact of labor motivation is less direct. The report concludes that not all organizational changes affect profitability, and investment changes have a more immediate impact on a firm's financial performance. Desklib provides access to similar solved assignments and study resources for students.

Running head: THE RELATIONSHIP BETWEEN INVESTMENTANDPROFITABILITY 1
THE RELATIONSHIP BETWEEN INVESTMENT AND PROFITABILITY LEVEL OF
AUSTRALIAN COMPANIES.
by
Course:
Tutor:
University:
Department:
Date:
THE RELATIONSHIP BETWEEN INVESTMENT AND PROFITABILITY LEVEL OF
AUSTRALIAN COMPANIES.
by
Course:
Tutor:
University:
Department:
Date:
Paraphrase This Document
Need a fresh take? Get an instant paraphrase of this document with our AI Paraphraser
THE RELATIONSHIP BETWEEN INVESTMENTANDPROFITABILITY
Table of Contents
List of Tables..............................................................................................................................3
List of Figures............................................................................................................................4
1.0 Gathering of Data.................................................................................................................5
1.1 Sources of Data....................................................................................................................5
1.2 Storage of Data.....................................................................................................................6
2.0 Study Design and Execution................................................................................................6
2.1 Data Pre-processing.............................................................................................................6
2.2 Dimension Reduction...........................................................................................................7
2.3 Study Design........................................................................................................................8
2.3.1 Research Design process...............................................................................................8
2.3.2 Population......................................................................................................................9
2.3.3 Sample...........................................................................................................................9
2.3.4 Data Collection..............................................................................................................9
2.3.5 Data Analysis.................................................................................................................9
2.3.6 Limitations...................................................................................................................10
2.4 Experiment Implementation Records.................................................................................11
2.4.1 Study Findings.............................................................................................................11
3.0 Research Findings and Analysis........................................................................................12
3.1 The Estimated Outcomes...................................................................................................12
3.2 Summary of Expected Findings.........................................................................................12
4.0 Plan Methodology and Analysis of Findings.....................................................................13
References:...............................................................................................................................15
List of Tables
Table 1: Data Collection............................................................................................................5

THE RELATIONSHIP BETWEEN INVESTMENTANDPROFITABILITY
Table 2: Data Storage.................................................................................................................6
Table 3: Selection and Reduction of Data..................................................................................8
Table 4: Descriptive features of the Net Profits, Investments and Labour Motivations for the
period of 2000- 2005................................................................................................................11
Table 5: Regression Model Analysis.......................................................................................11
Table 6: Coefficients of Regression.........................................................................................11
⊘ This is a preview!⊘
Do you want full access?
Subscribe today to unlock all pages.
Trusted by 1+ million students worldwide

THE RELATIONSHIP BETWEEN INVESTMENTANDPROFITABILITY
List of Figures
Figure 1: Data Pre-processing....................................................................................................7
Figure 2: Data collection and analysis procedure....................................................................10
List of Figures
Figure 1: Data Pre-processing....................................................................................................7
Figure 2: Data collection and analysis procedure....................................................................10
Paraphrase This Document
Need a fresh take? Get an instant paraphrase of this document with our AI Paraphraser
THE RELATIONSHIP BETWEEN INVESTMENTANDPROFITABILITY 5
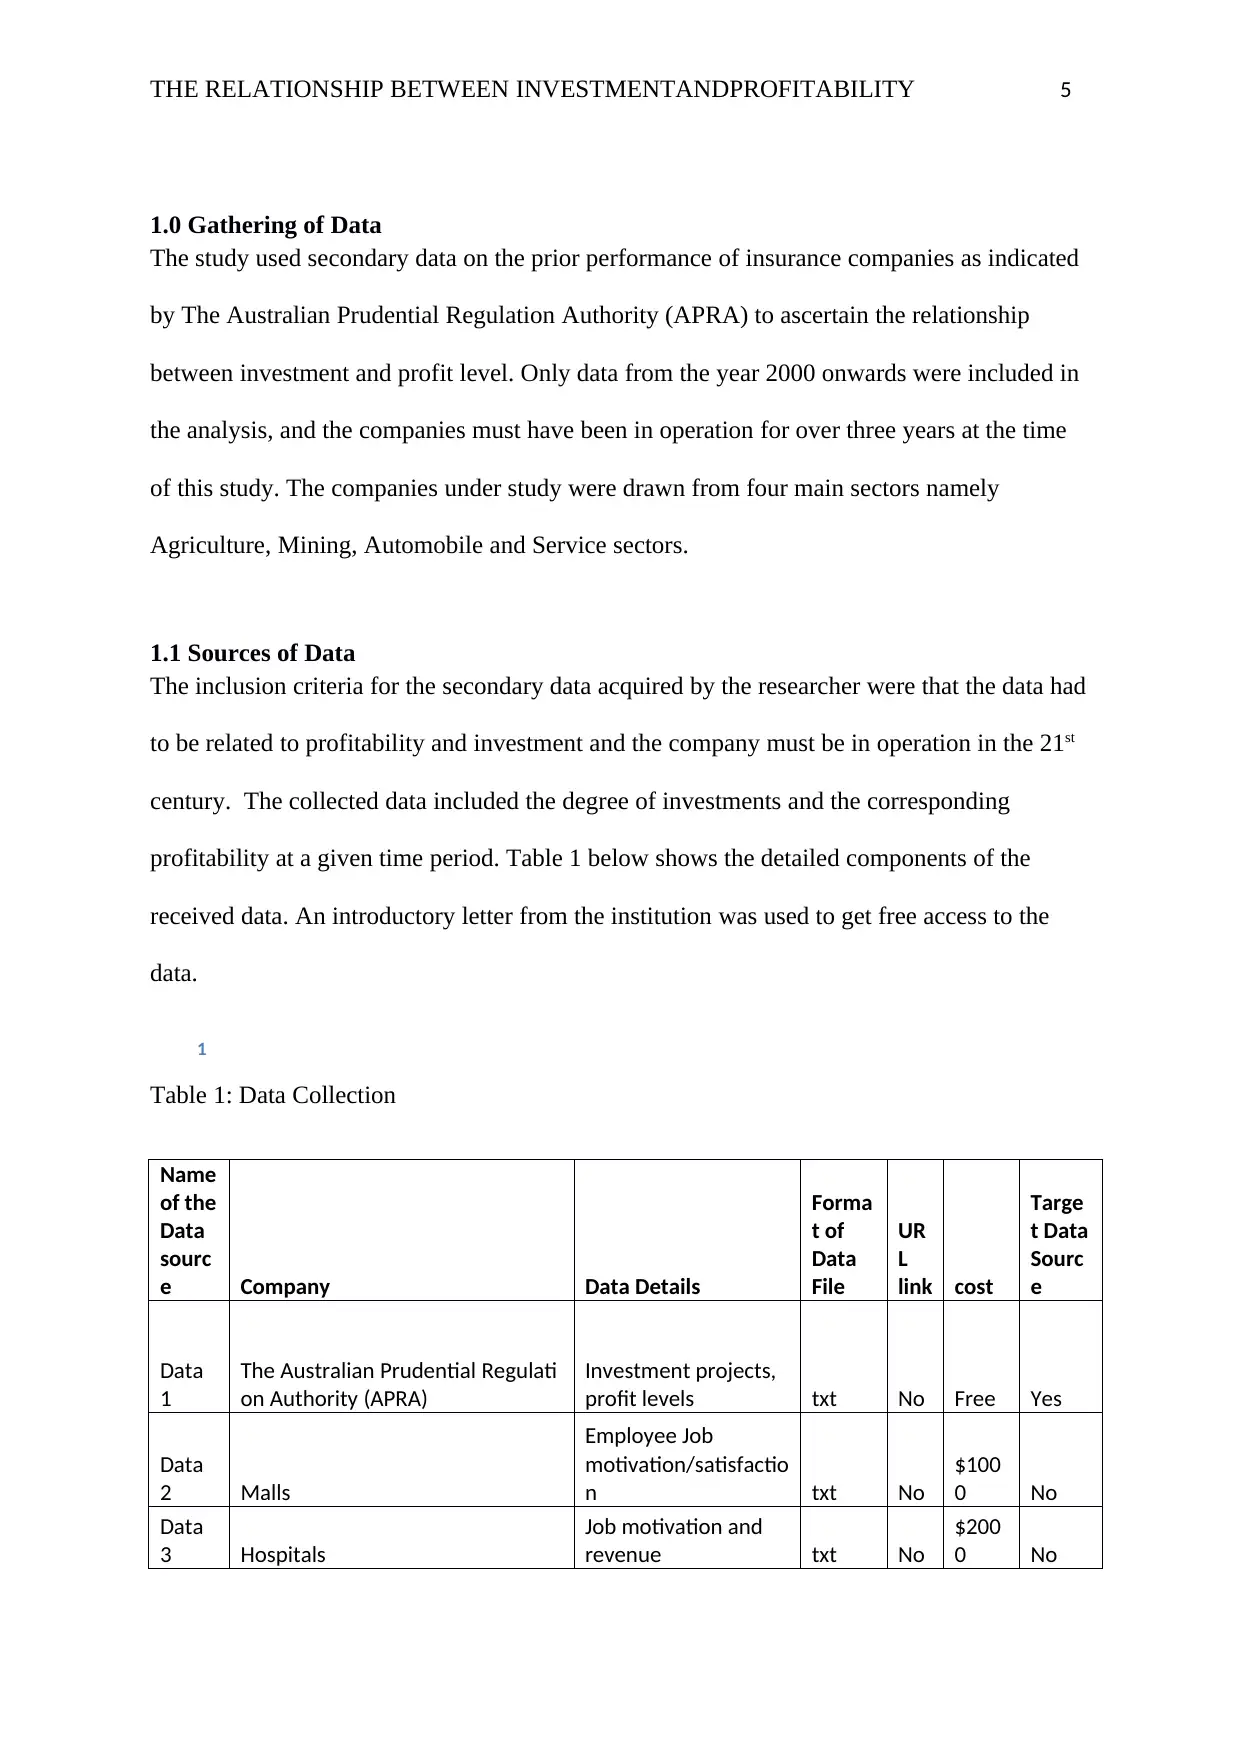
1.0 Gathering of Data
The study used secondary data on the prior performance of insurance companies as indicated
by The Australian Prudential Regulation Authority (APRA) to ascertain the relationship
between investment and profit level. Only data from the year 2000 onwards were included in
the analysis, and the companies must have been in operation for over three years at the time
of this study. The companies under study were drawn from four main sectors namely
Agriculture, Mining, Automobile and Service sectors.
1.1 Sources of Data
The inclusion criteria for the secondary data acquired by the researcher were that the data had
to be related to profitability and investment and the company must be in operation in the 21st
century. The collected data included the degree of investments and the corresponding
profitability at a given time period. Table 1 below shows the detailed components of the
received data. An introductory letter from the institution was used to get free access to the
data.
Table 1 Table 1: Data Collection
Table 1: Data Collection
Name
of the
Data
sourc
e Company Data Details
Forma
t of
Data
File
UR
L
link cost
Targe
t Data
Sourc
e
Data
1
The Australian Prudential Regulati
on Authority (APRA)
Investment projects,
profit levels txt No Free Yes
Data
2 Malls
Employee Job
motivation/satisfactio
n txt No
$100
0 No
Data
3 Hospitals
Job motivation and
revenue txt No
$200
0 No
THE RELATIONSHIP BETWEEN INVESTMENTANDPROFITABILITY 6
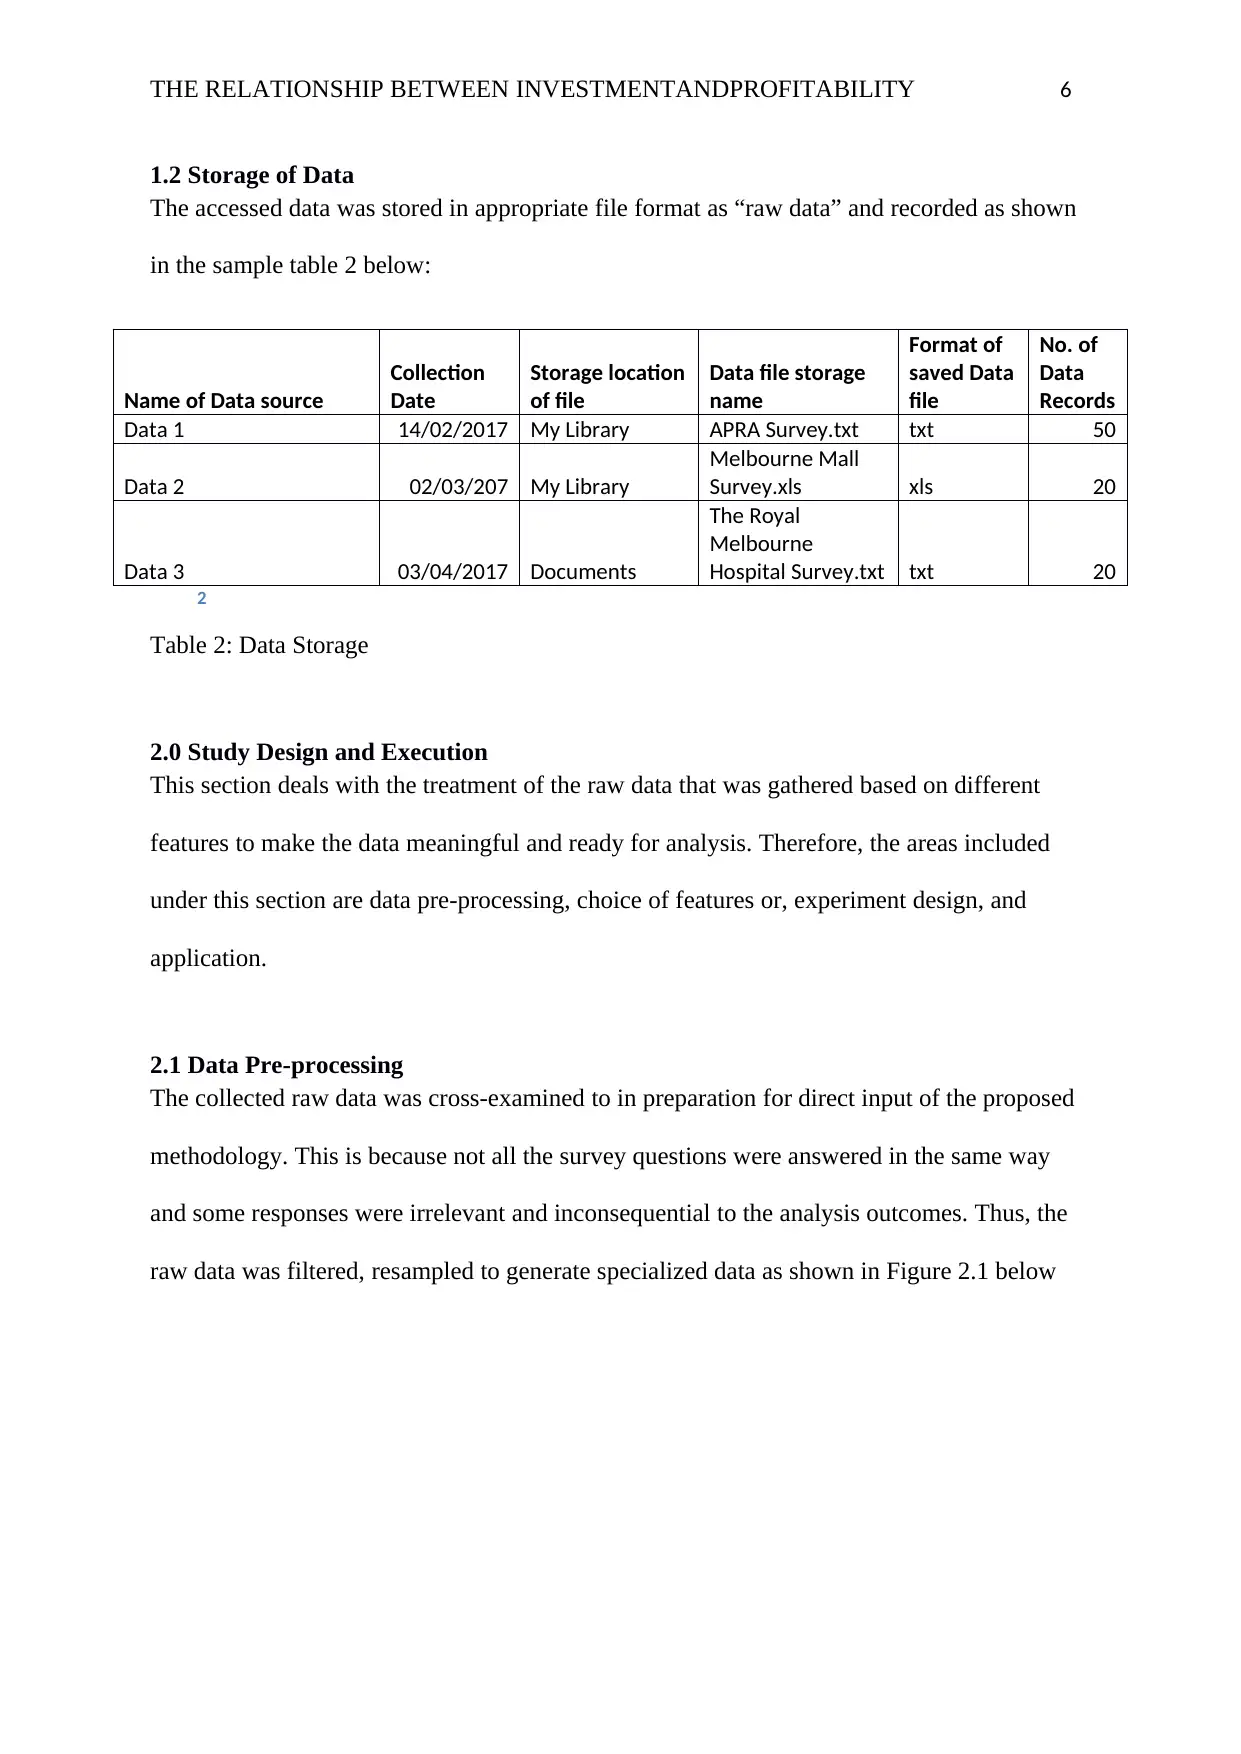
1.2 Storage of Data
The accessed data was stored in appropriate file format as “raw data” and recorded as shown
in the sample table 2 below:
Name of Data source
Collection
Date
Storage location
of file
Data file storage
name
Format of
saved Data
file
No. of
Data
Records
Data 1 14/02/2017 My Library APRA Survey.txt txt 50
Data 2 02/03/207 My Library
Melbourne Mall
Survey.xls xls 20
Data 3 03/04/2017 Documents
The Royal
Melbourne
Hospital Survey.txt txt 20
Table 2 Table 2: Data Storage
Table 2: Data Storage
2.0 Study Design and Execution
This section deals with the treatment of the raw data that was gathered based on different
features to make the data meaningful and ready for analysis. Therefore, the areas included
under this section are data pre-processing, choice of features or, experiment design, and
application.
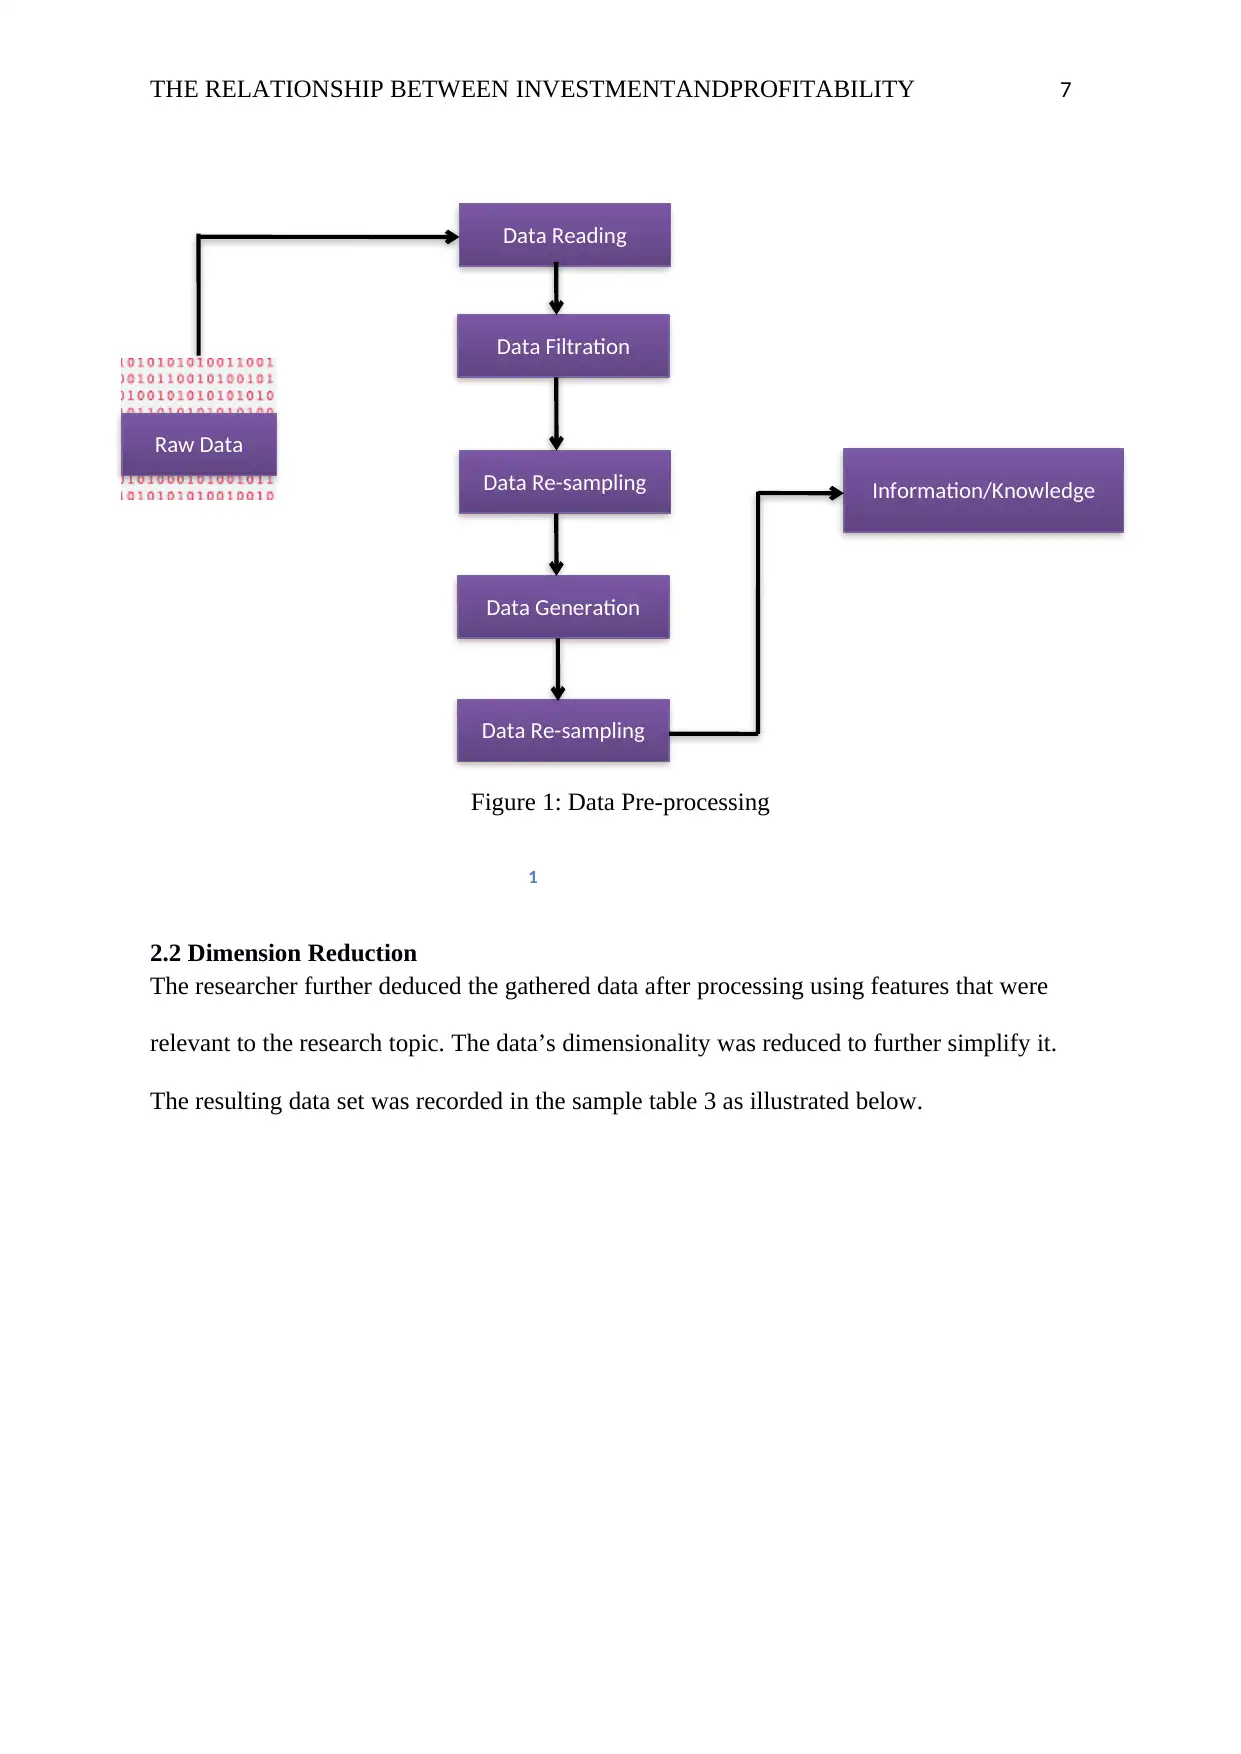
2.1 Data Pre-processing
The collected raw data was cross-examined to in preparation for direct input of the proposed
methodology. This is because not all the survey questions were answered in the same way
and some responses were irrelevant and inconsequential to the analysis outcomes. Thus, the
raw data was filtered, resampled to generate specialized data as shown in Figure 2.1 below
1.2 Storage of Data
The accessed data was stored in appropriate file format as “raw data” and recorded as shown
in the sample table 2 below:
Name of Data source
Collection
Date
Storage location
of file
Data file storage
name
Format of
saved Data
file
No. of
Data
Records
Data 1 14/02/2017 My Library APRA Survey.txt txt 50
Data 2 02/03/207 My Library
Melbourne Mall
Survey.xls xls 20
Data 3 03/04/2017 Documents
The Royal
Melbourne
Hospital Survey.txt txt 20
Table 2 Table 2: Data Storage
Table 2: Data Storage
2.0 Study Design and Execution
This section deals with the treatment of the raw data that was gathered based on different
features to make the data meaningful and ready for analysis. Therefore, the areas included
under this section are data pre-processing, choice of features or, experiment design, and
application.
2.1 Data Pre-processing
The collected raw data was cross-examined to in preparation for direct input of the proposed
methodology. This is because not all the survey questions were answered in the same way
and some responses were irrelevant and inconsequential to the analysis outcomes. Thus, the
raw data was filtered, resampled to generate specialized data as shown in Figure 2.1 below
⊘ This is a preview!⊘
Do you want full access?
Subscribe today to unlock all pages.
Trusted by 1+ million students worldwide
THE RELATIONSHIP BETWEEN INVESTMENTANDPROFITABILITY 7
Figure 1: Data Pre-processing
Figure 1Figure 1: Data Pre-processing
2.2 Dimension Reduction
The researcher further deduced the gathered data after processing using features that were
relevant to the research topic. The data’s dimensionality was reduced to further simplify it.
The resulting data set was recorded in the sample table 3 as illustrated below.
Data Reading
Data Filtration
Data Re-sampling
Data Generation
Data Re-sampling
Information/Knowledge
Raw Data
Paraphrase This Document
Need a fresh take? Get an instant paraphrase of this document with our AI Paraphraser
THE RELATIONSHIP BETWEEN INVESTMENTANDPROFITABILITY 8
Date
Name
of
Data
sourc
e
Objective
of Pre-
processing
Method of
Pre-processing
Data
Records
(Original
)
Data
Records
(results
)
Original
Feature
s
No.
Result
Feature
s
Name of New Data
File
20/02/201
7 Data 1
Reduce
the data
volume
without
affecting
results
Data
Reduction 50 40 3 3
Final_APRASurvey.tx
t
08/03/207 Data 2
Remove
incomplet
e data Data Cleaning 20 18 6 6
Final_Melbourne
Mall Survey.xls
08/04/201
7 Data 3
Adding
new
features
inferred by
the
current
attributes
Data
transformatio
n 20 18 6 8
Final_The Royal
Melbourne Hospital
Survey.txt
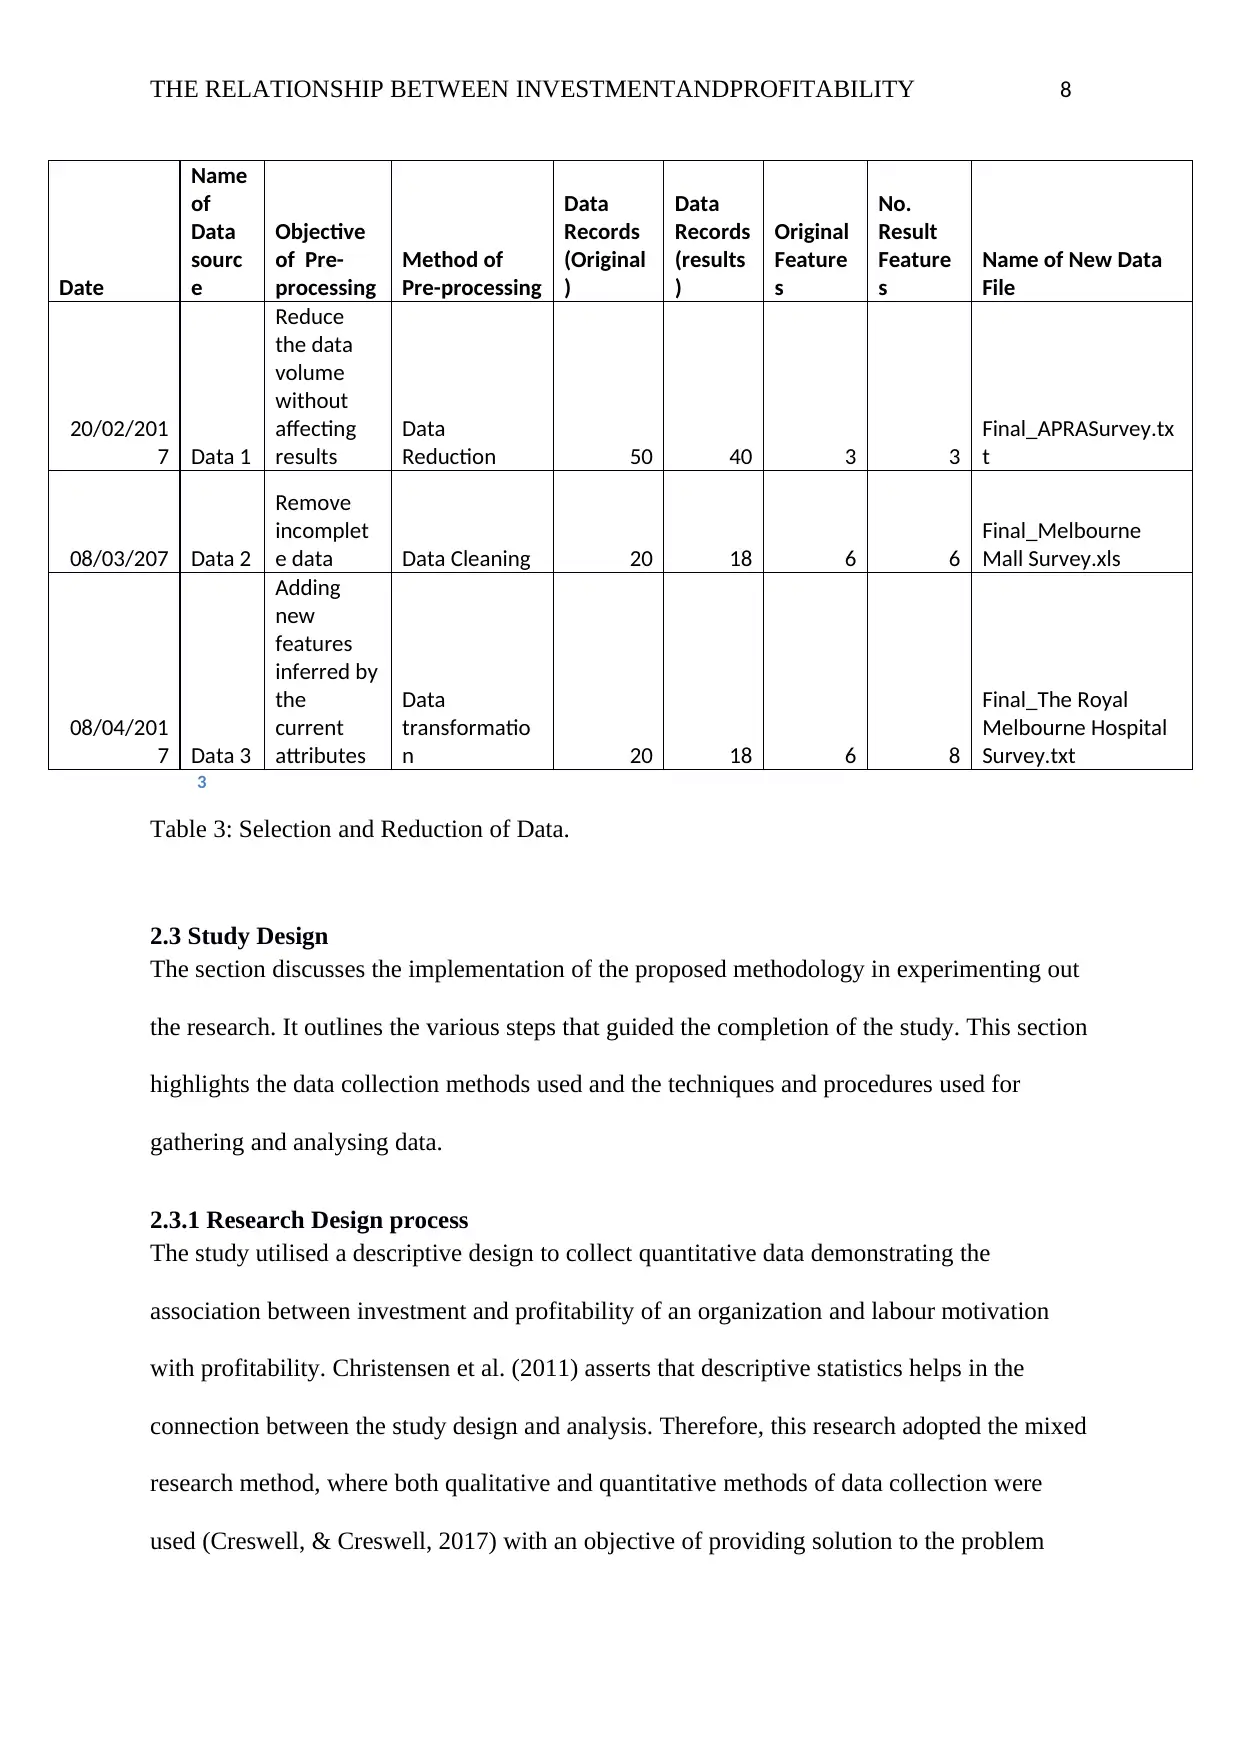
Table 3 Table 3: Selection and Reduction of Data.
Table 3: Selection and Reduction of Data.
2.3 Study Design
The section discusses the implementation of the proposed methodology in experimenting out
the research. It outlines the various steps that guided the completion of the study. This section
highlights the data collection methods used and the techniques and procedures used for
gathering and analysing data.
2.3.1 Research Design process
The study utilised a descriptive design to collect quantitative data demonstrating the
association between investment and profitability of an organization and labour motivation
with profitability. Christensen et al. (2011) asserts that descriptive statistics helps in the
connection between the study design and analysis. Therefore, this research adopted the mixed
research method, where both qualitative and quantitative methods of data collection were
used (Creswell, & Creswell, 2017) with an objective of providing solution to the problem
Date
Name
of
Data
sourc
e
Objective
of Pre-
processing
Method of
Pre-processing
Data
Records
(Original
)
Data
Records
(results
)
Original
Feature
s
No.
Result
Feature
s
Name of New Data
File
20/02/201
7 Data 1
Reduce
the data
volume
without
affecting
results
Data
Reduction 50 40 3 3
Final_APRASurvey.tx
t
08/03/207 Data 2
Remove
incomplet
e data Data Cleaning 20 18 6 6
Final_Melbourne
Mall Survey.xls
08/04/201
7 Data 3
Adding
new
features
inferred by
the
current
attributes
Data
transformatio
n 20 18 6 8
Final_The Royal
Melbourne Hospital
Survey.txt
Table 3 Table 3: Selection and Reduction of Data.
Table 3: Selection and Reduction of Data.
2.3 Study Design
The section discusses the implementation of the proposed methodology in experimenting out
the research. It outlines the various steps that guided the completion of the study. This section
highlights the data collection methods used and the techniques and procedures used for
gathering and analysing data.
2.3.1 Research Design process
The study utilised a descriptive design to collect quantitative data demonstrating the
association between investment and profitability of an organization and labour motivation
with profitability. Christensen et al. (2011) asserts that descriptive statistics helps in the
connection between the study design and analysis. Therefore, this research adopted the mixed
research method, where both qualitative and quantitative methods of data collection were
used (Creswell, & Creswell, 2017) with an objective of providing solution to the problem
THE RELATIONSHIP BETWEEN INVESTMENTANDPROFITABILITY 9
statement. Data relating to investment and profitability of the various Australian companies
that were affected by globalisation were considered. The Australian Prudential Regulation
Authority (APRA) provided the access to the data after the submission of an introductory
letter from the University.
2.3.2 Population
The target population this survey comprised of all the companies that were affected by
globalisation in Australia and were still in operation in the 21st Century. According to the
Australian Prudential Regulation Authority (APRA), 78% of Australian companies that were
affected by globalisation and only half of them were still in operation in the 21st Century.
2.3.3 Sample
A simple random sampling method was adopted. 20 corporations were selected for the survey
from the existing population provided by APRA. A representative sample is that which
ensures that all subjects in the population study have an equal chance of selection (Saunders,
2011). Therefore, all the companies that fitted the selection criteria had an equal chance of
being selected. The study was conducted for a period of five months.
2.3.4 Data Collection
The survey used secondary data which was retrieved from the listed companies affected by
globalisation by APRA. The nature of data was the nature of investments and corresponding
profit levels for specific years.
2.3.5 Data Analysis
The gathered data was reviewed for accuracy, completeness and consistency (as shown in
Table 3). A descriptive tool will be used to analyse the data. A fixed effect regression model
was utilised since it assists in examining the influence of variables that change with time
(Cameron, & Trivedi, 2013). A similar model was utilised by Mong’o (2010) to examine the
⊘ This is a preview!⊘
Do you want full access?
Subscribe today to unlock all pages.
Trusted by 1+ million students worldwide
THE RELATIONSHIP BETWEEN INVESTMENTANDPROFITABILITY 10
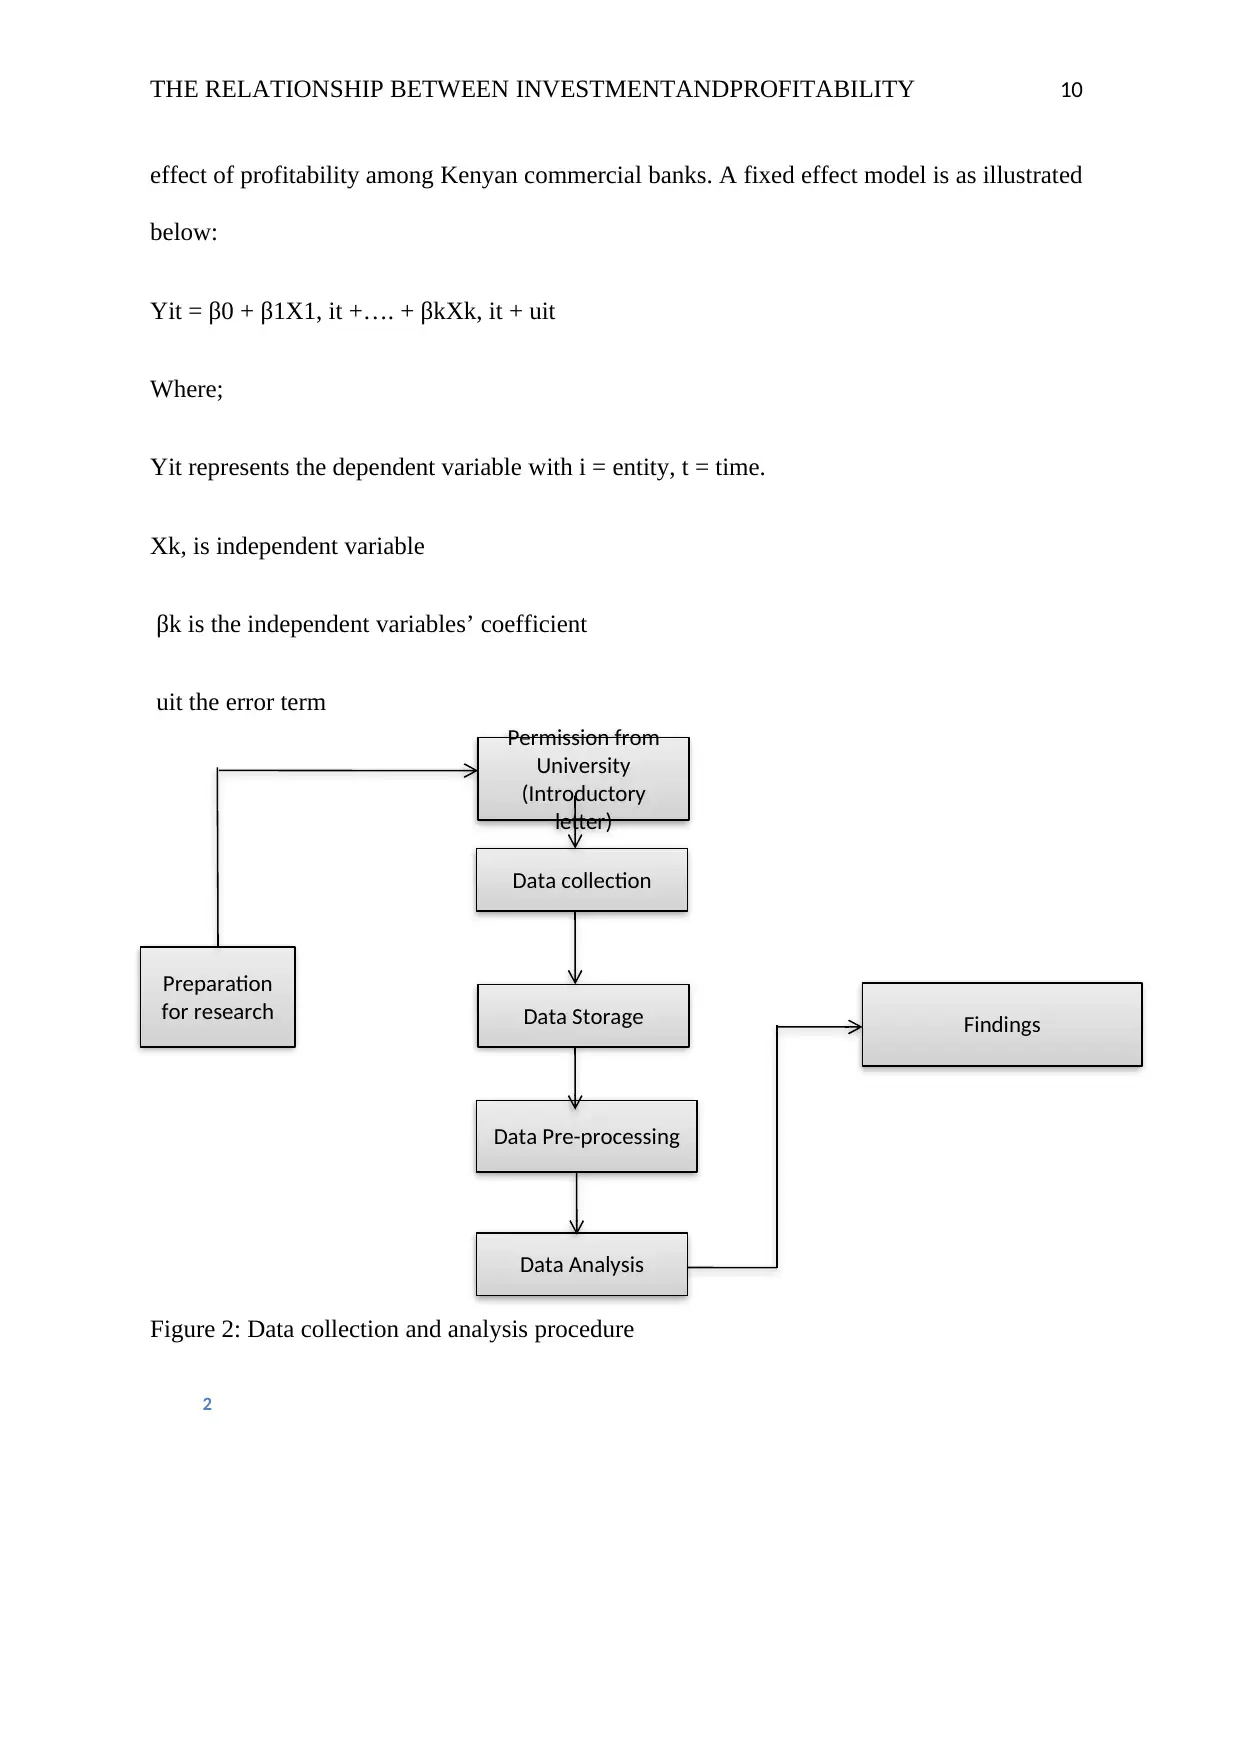
effect of profitability among Kenyan commercial banks. A fixed effect model is as illustrated
below:
Yit = β0 + β1X1, it +…. + βkXk, it + uit
Where;
Yit represents the dependent variable with i = entity, t = time.
Xk, is independent variable
βk is the independent variables’ coefficient
uit the error term
Figure 2: Data collection and analysis procedure
Figure 2 Figure 2: Data collection and analysis procedure
Permission from
University
(Introductory
letter)
Data collection
Data Storage
Data Pre-processing
Data Analysis
Findings
Preparation
for research
Paraphrase This Document
Need a fresh take? Get an instant paraphrase of this document with our AI Paraphraser
THE RELATIONSHIP BETWEEN INVESTMENTANDPROFITABILITY 11
2.3.6 Limitations
The researcher tried to adopt the use of a representative sample, but this was partially
impossible because of the diverse natures of the companies and economic sectors under
which they operate.
The information provided was not verifiable by the researcher because the respective
company respondents might have falsified the information submitted to APRA for their
reasons
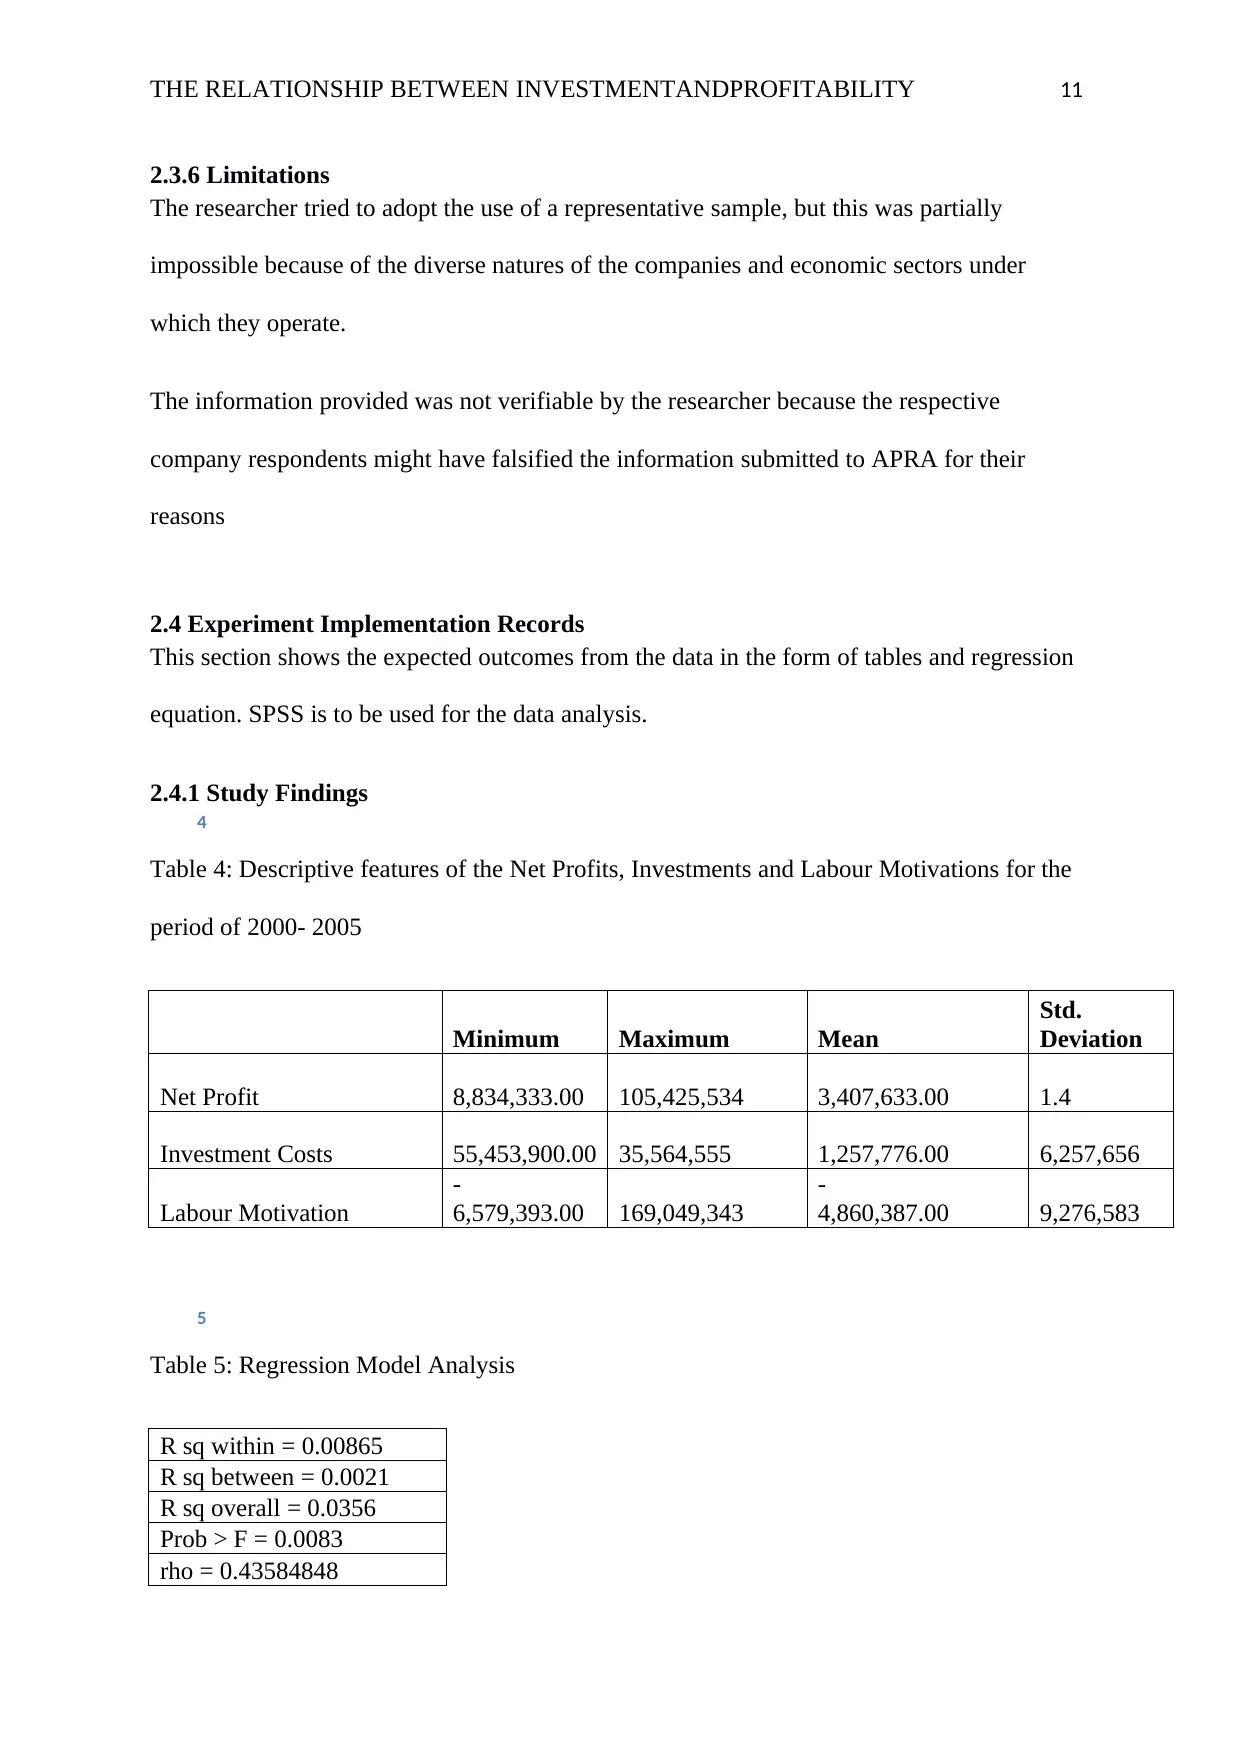
2.4 Experiment Implementation Records
This section shows the expected outcomes from the data in the form of tables and regression
equation. SPSS is to be used for the data analysis.
2.4.1 Study Findings
Table 4 Table 4: Descriptive features of the Net Profits, Investments and Labour Motivations for the period of 2000- 2005
Table 4: Descriptive features of the Net Profits, Investments and Labour Motivations for the
period of 2000- 2005
Minimum Maximum Mean
Std.
Deviation
Net Profit 8,834,333.00 105,425,534 3,407,633.00 1.4
Investment Costs 55,453,900.00 35,564,555 1,257,776.00 6,257,656
Labour Motivation
-
6,579,393.00 169,049,343
-
4,860,387.00 9,276,583
Table 5 Table 5: Regression Model Analysis
Table 5: Regression Model Analysis
R sq within = 0.00865
R sq between = 0.0021
R sq overall = 0.0356
Prob > F = 0.0083
rho = 0.43584848
2.3.6 Limitations
The researcher tried to adopt the use of a representative sample, but this was partially
impossible because of the diverse natures of the companies and economic sectors under
which they operate.
The information provided was not verifiable by the researcher because the respective
company respondents might have falsified the information submitted to APRA for their
reasons
2.4 Experiment Implementation Records
This section shows the expected outcomes from the data in the form of tables and regression
equation. SPSS is to be used for the data analysis.
2.4.1 Study Findings
Table 4 Table 4: Descriptive features of the Net Profits, Investments and Labour Motivations for the period of 2000- 2005
Table 4: Descriptive features of the Net Profits, Investments and Labour Motivations for the
period of 2000- 2005
Minimum Maximum Mean
Std.
Deviation
Net Profit 8,834,333.00 105,425,534 3,407,633.00 1.4
Investment Costs 55,453,900.00 35,564,555 1,257,776.00 6,257,656
Labour Motivation
-
6,579,393.00 169,049,343
-
4,860,387.00 9,276,583
Table 5 Table 5: Regression Model Analysis
Table 5: Regression Model Analysis
R sq within = 0.00865
R sq between = 0.0021
R sq overall = 0.0356
Prob > F = 0.0083
rho = 0.43584848
THE RELATIONSHIP BETWEEN INVESTMENTANDPROFITABILITY 12
Number of Observations =
20
Number of groups = 4
Table 6 Table 6: Coefficients of Regression
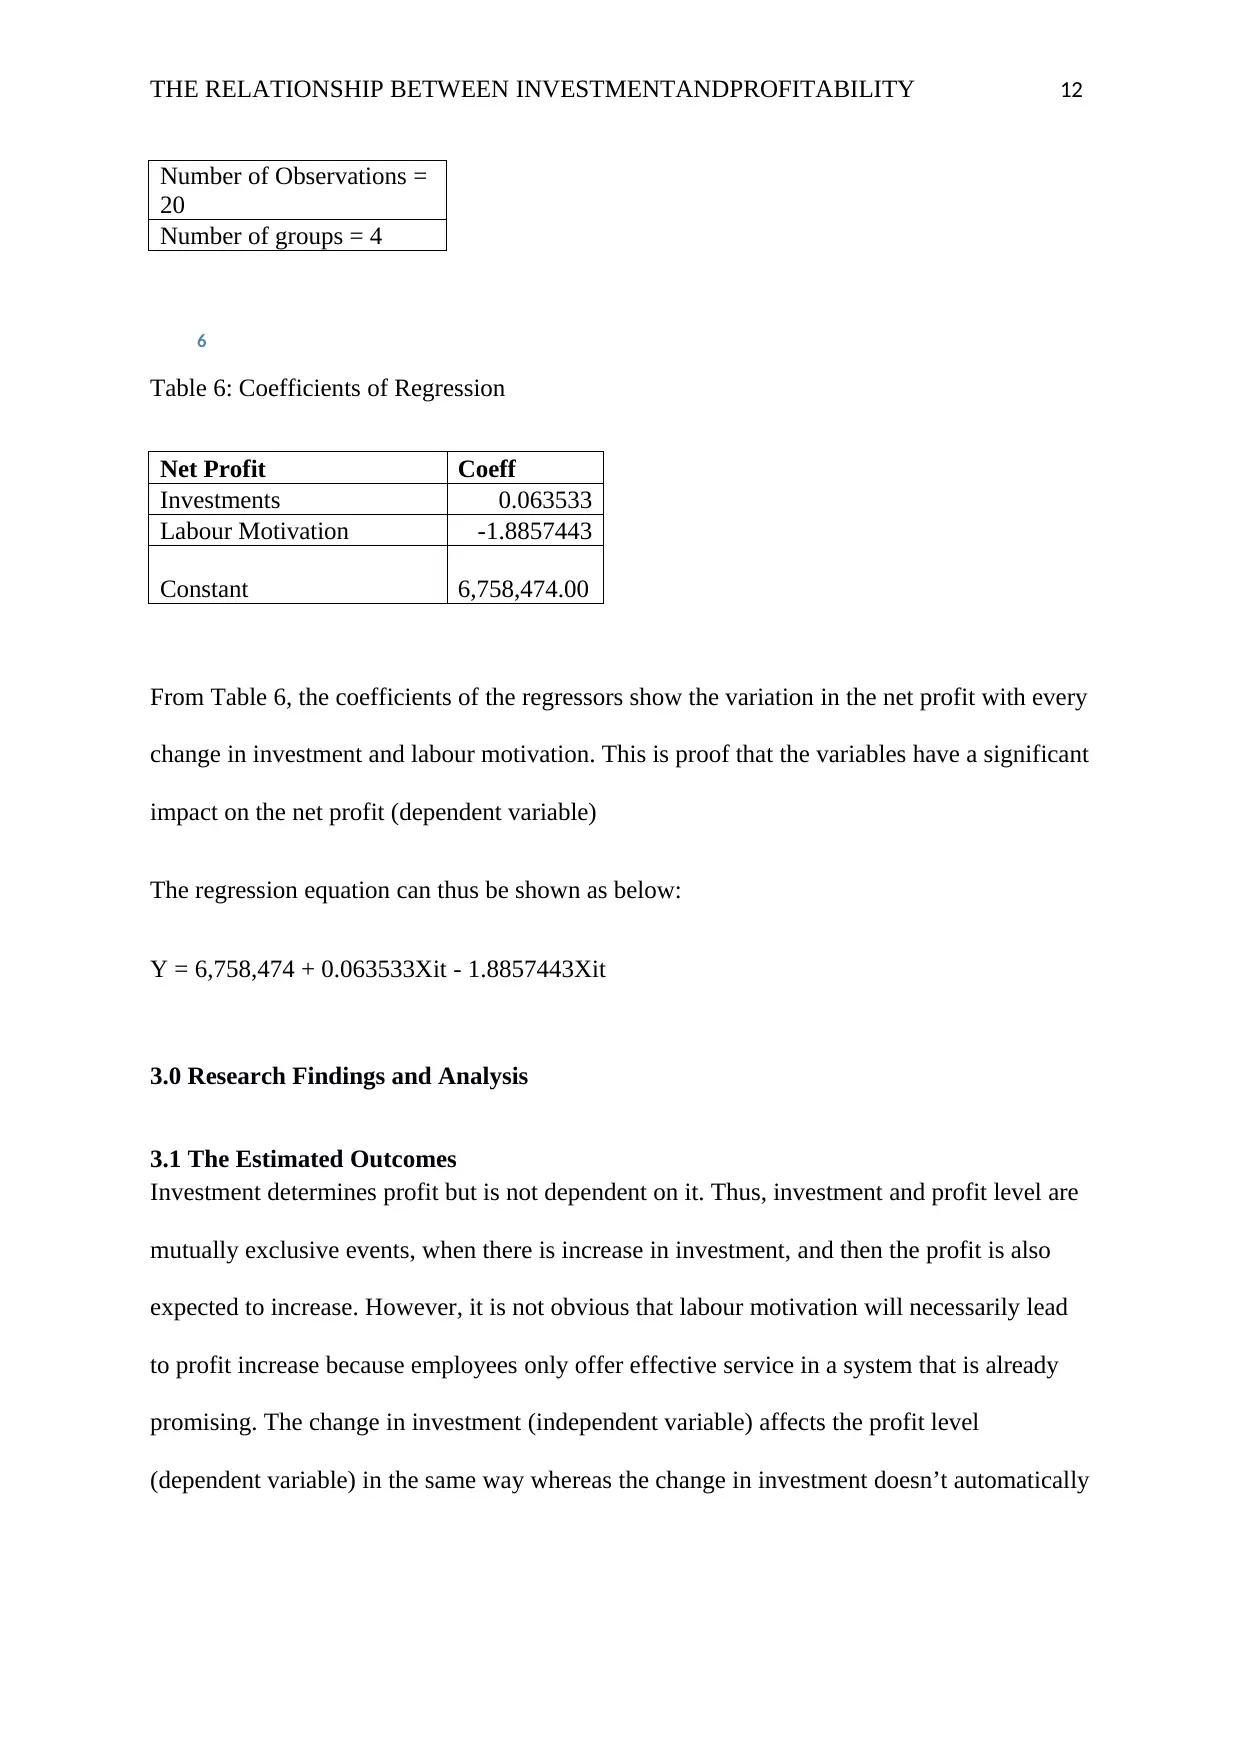
Table 6: Coefficients of Regression
Net Profit Coeff
Investments 0.063533
Labour Motivation -1.8857443
Constant 6,758,474.00
From Table 6, the coefficients of the regressors show the variation in the net profit with every
change in investment and labour motivation. This is proof that the variables have a significant
impact on the net profit (dependent variable)
The regression equation can thus be shown as below:
Y = 6,758,474 + 0.063533Xit - 1.8857443Xit
3.0 Research Findings and Analysis
3.1 The Estimated Outcomes
Investment determines profit but is not dependent on it. Thus, investment and profit level are
mutually exclusive events, when there is increase in investment, and then the profit is also
expected to increase. However, it is not obvious that labour motivation will necessarily lead
to profit increase because employees only offer effective service in a system that is already
promising. The change in investment (independent variable) affects the profit level
(dependent variable) in the same way whereas the change in investment doesn’t automatically
Number of Observations =
20
Number of groups = 4
Table 6 Table 6: Coefficients of Regression
Table 6: Coefficients of Regression
Net Profit Coeff
Investments 0.063533
Labour Motivation -1.8857443
Constant 6,758,474.00
From Table 6, the coefficients of the regressors show the variation in the net profit with every
change in investment and labour motivation. This is proof that the variables have a significant
impact on the net profit (dependent variable)
The regression equation can thus be shown as below:
Y = 6,758,474 + 0.063533Xit - 1.8857443Xit
3.0 Research Findings and Analysis
3.1 The Estimated Outcomes
Investment determines profit but is not dependent on it. Thus, investment and profit level are
mutually exclusive events, when there is increase in investment, and then the profit is also
expected to increase. However, it is not obvious that labour motivation will necessarily lead
to profit increase because employees only offer effective service in a system that is already
promising. The change in investment (independent variable) affects the profit level
(dependent variable) in the same way whereas the change in investment doesn’t automatically
⊘ This is a preview!⊘
Do you want full access?
Subscribe today to unlock all pages.
Trusted by 1+ million students worldwide
1 out of 15
Related Documents


Your All-in-One AI-Powered Toolkit for Academic Success.
+13062052269
info@desklib.com
Available 24*7 on WhatsApp / Email
![[object Object]](/_next/static/media/star-bottom.7253800d.svg)
Unlock your academic potential
Copyright © 2020–2026 A2Z Services. All Rights Reserved. Developed and managed by ZUCOL.