Financial Analysis of Companies and Funds
VerifiedAdded on 2020/04/21
|27
|6108
|356
AI Summary
This assignment requires a comprehensive financial analysis of various entities including companies and investment funds. Students will utilize data from Morningstar to evaluate the financial performance of Ford Motors Company, comparing its stock returns with key financial ratios. Furthermore, students will analyze the performance of different types of funds, such as equity funds (BNPP L1 Equity Best Sell Euro Classic) and bond funds (Fidelity Euro Bond A-Acc-EUR), focusing on their investment strategies and risk profiles. The analysis will also encompass a global total return fund (Templeton Global Total Return A Acc HKD) and a specific example of Gazprom's Eurobonds issued under its EMTN program.
Contribute Materials
Your contribution can guide someone’s learning journey. Share your
documents today.

Investment Strategy
Secure Best Marks with AI Grader
Need help grading? Try our AI Grader for instant feedback on your assignments.
TABLE OF CONTENTS
Question -1.......................................................................................................................................4
Company Profile..........................................................................................................................4
Five Year Performance of the Company.....................................................................................4
Historical return on investment.................................................................................................10
Discounting cash flow analysis and rate of return.....................................................................11
Discounting cash flow analysis and rate of return.....................................................................11
Question-2......................................................................................................................................12
Investment Strategy...................................................................................................................12
Macro economic factors and its impact on financial market.....................................................13
Macroeconomic factors and their relationship with mutual funds............................................15
Asset Allocation.........................................................................................................................16
Risk Factors to be assessed........................................................................................................23
Question-3......................................................................................................................................24
References......................................................................................................................................26
TABLE OF FIGURES
Figure 1: Five year Share price of the Google.................................................................................5
Figure 2: Five Year Share Price of Ford Motors.............................................................................6
Figure 3: Trailing Total Returns of Google.....................................................................................7
Figure 4: 10 Year performance of Google.......................................................................................8
Figure 5: Ten Year Financial Performance of Ford Motors............................................................9
Figure 6: Financial Health Ratios of Ford Motors.........................................................................10
Figure 7: Financial Health Ratios of Google.................................................................................10
Figure 8: Macro economic factors and their sign of relationship with mutual funds....................15
Figure 9: Portfolio profile of Picet- Timber R USD......................................................................17
Figure 10: Graph representing the performance............................................................................18
Figure 11: Associated Risk of the Fund........................................................................................19
Figure 12: Performance History of Schroder ISF Asian Total Ret A1..........................................20
Figure 13: Five Year Performance in %........................................................................................20
Figure 14: Performance History of Fidelity Euro Bond A-Acc-EUR...........................................21
Figure 15: Performance History of BNPP L1 Equity Best Sell Euro Classic (EUR)....................22
Figure 16: Performance Statistics of Templeton Global Bond A Acc (EUR)...............................23
Figure 17: Regression Analysis of Gazprom’s Eurobonds............................................................25
QUESTION -1
Company Profile
Google LLC is a multinational America based technology company providing specialized
services of internet. Some of its services are providing technologies for online advertising,
serving as search engine mechanism, cloud computing and other related software and hardware
services. The company was established in the year 1998 as a private company by two PhD
students of Stanford University, California - Larry Page and Sergey Brin. They owned
approximately 14% of Google’s shares and controlled 56% of the total voting powers of the
stockholder through stock super-voting. The company held an IPO (initial public offering) in the
year 2004 on 19th August. In the same year, the company moved to its headquarters in Mountain
View, California, renamed the corporation as Googleplex (Google Inc. 2017).
The Ford Motor Company, known as "Ford" is a multinational automaker located in America
with headquarters in Dearborn, Michigan, a suburb of Detroit. The company was established by
Henry Ford on June 16, 1903. Ford is engaged in selling automobiles and commercial vehicles
under its own brand name (Ford Motors. 2017). It also sells the most luxury cars under the brand
name of Lincoln. The Ford Company also owns Brazilian based SUV manufacturer, Troller, and
Australian car manufacturer FPV. The company also produced tractors and related automotive
components in the past. Ford owns 8% stake in UK based Aston Martin and a 49% ownership in
Jiangling of China. It also various joint-ventures located in China (Changan Ford), Taiwan (Ford
Lio Ho), Thailand (AutoAlliance), Turkey (Ford Otosan), and Russia (Ford Sollers).
Five Year Performance of the Company
Secure Best Marks with AI Grader
Need help grading? Try our AI Grader for instant feedback on your assignments.
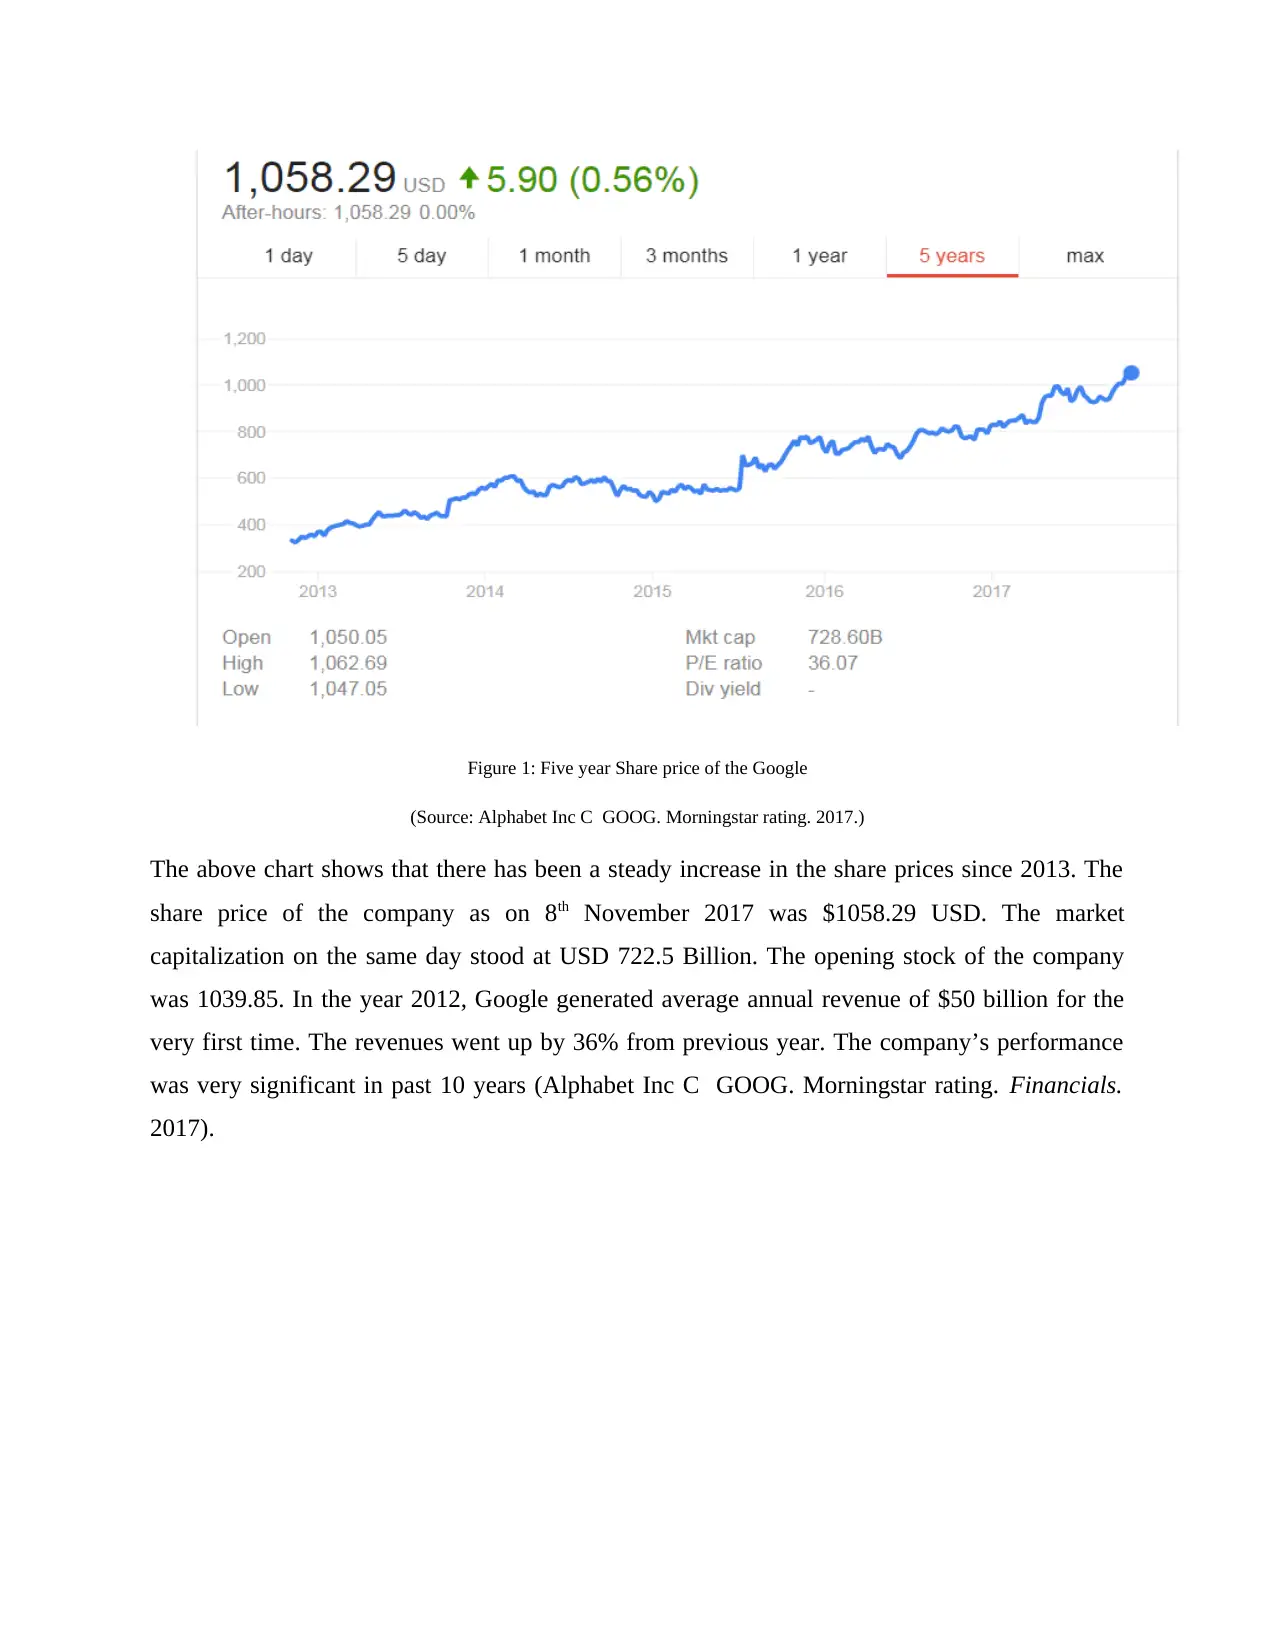
Figure 1: Five year Share price of the Google
(Source: Alphabet Inc C GOOG. Morningstar rating. 2017.)
The above chart shows that there has been a steady increase in the share prices since 2013. The
share price of the company as on 8th November 2017 was $1058.29 USD. The market
capitalization on the same day stood at USD 722.5 Billion. The opening stock of the company
was 1039.85. In the year 2012, Google generated average annual revenue of $50 billion for the
very first time. The revenues went up by 36% from previous year. The company’s performance
was very significant in past 10 years (Alphabet Inc C GOOG. Morningstar rating. Financials.
2017).
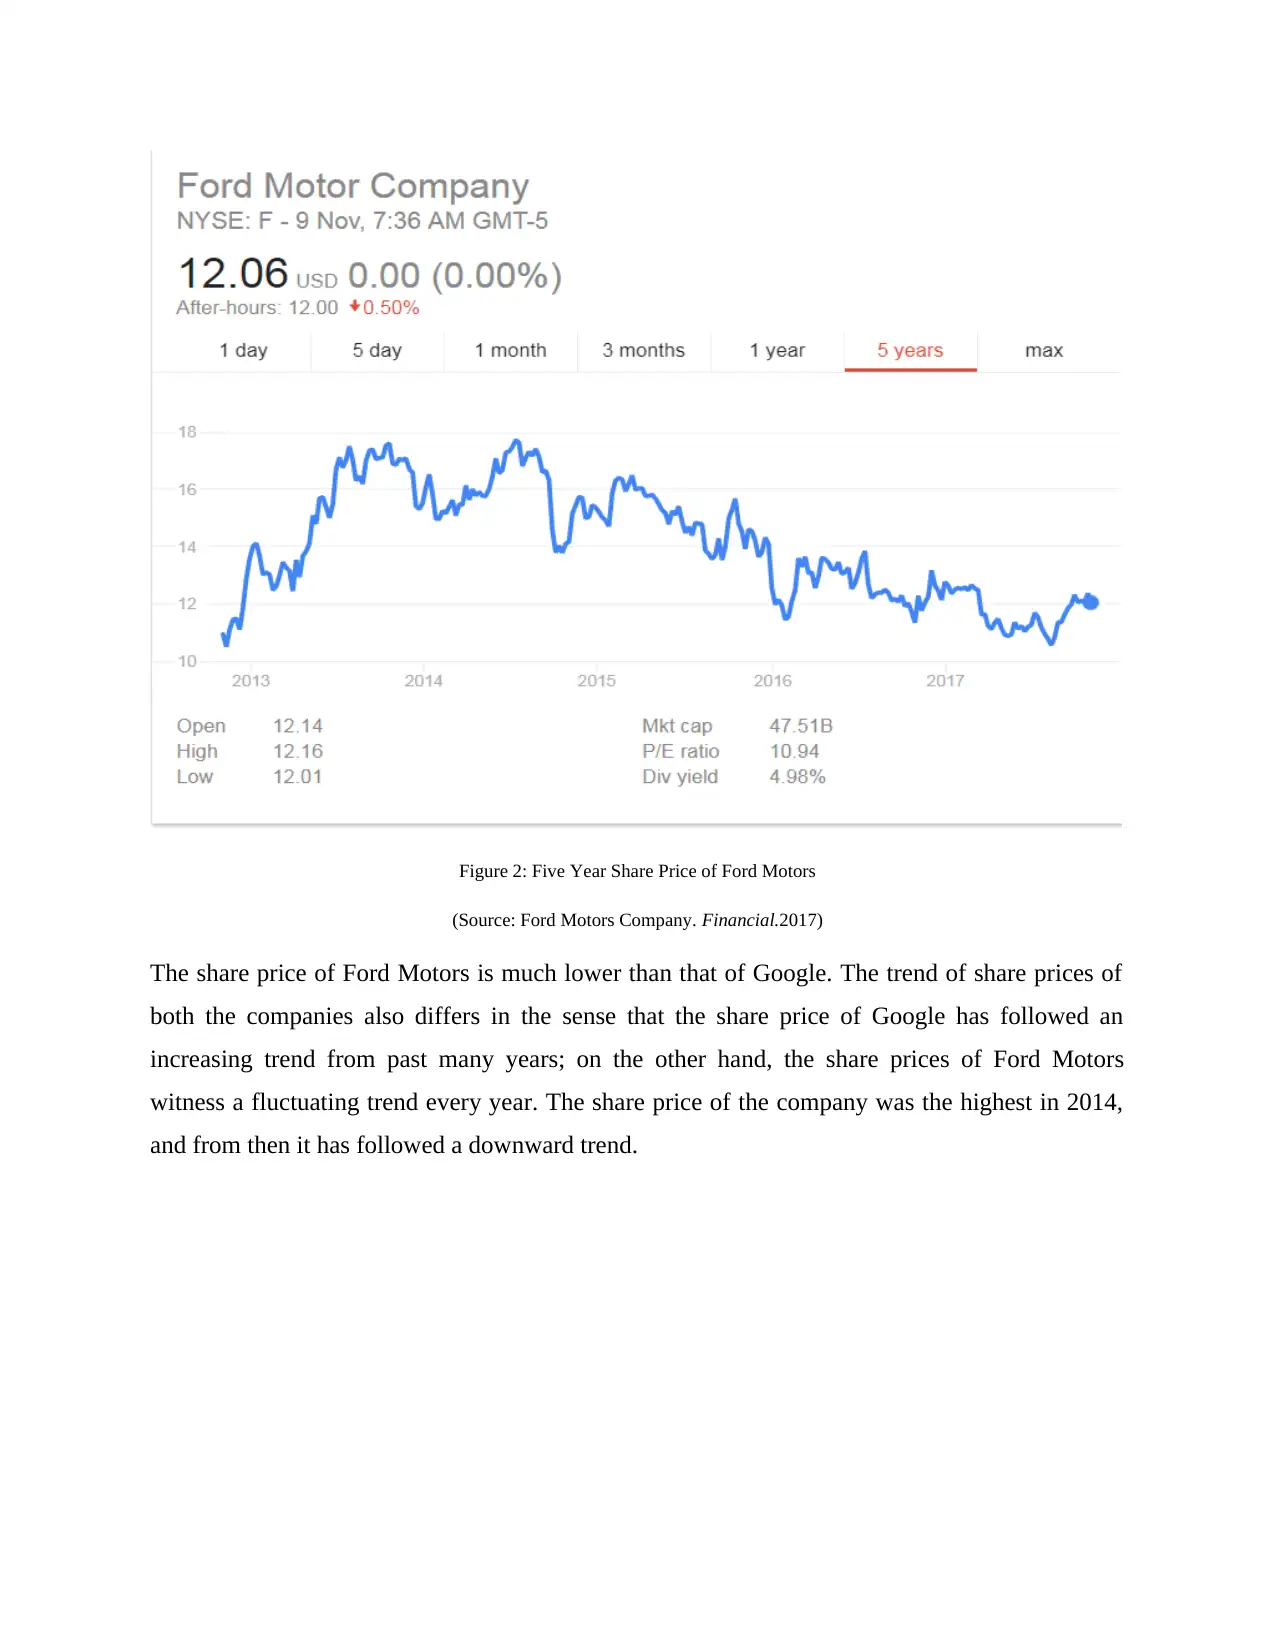
Figure 2: Five Year Share Price of Ford Motors
(Source: Ford Motors Company. Financial.2017)
The share price of Ford Motors is much lower than that of Google. The trend of share prices of
both the companies also differs in the sense that the share price of Google has followed an
increasing trend from past many years; on the other hand, the share prices of Ford Motors
witness a fluctuating trend every year. The share price of the company was the highest in 2014,
and from then it has followed a downward trend.
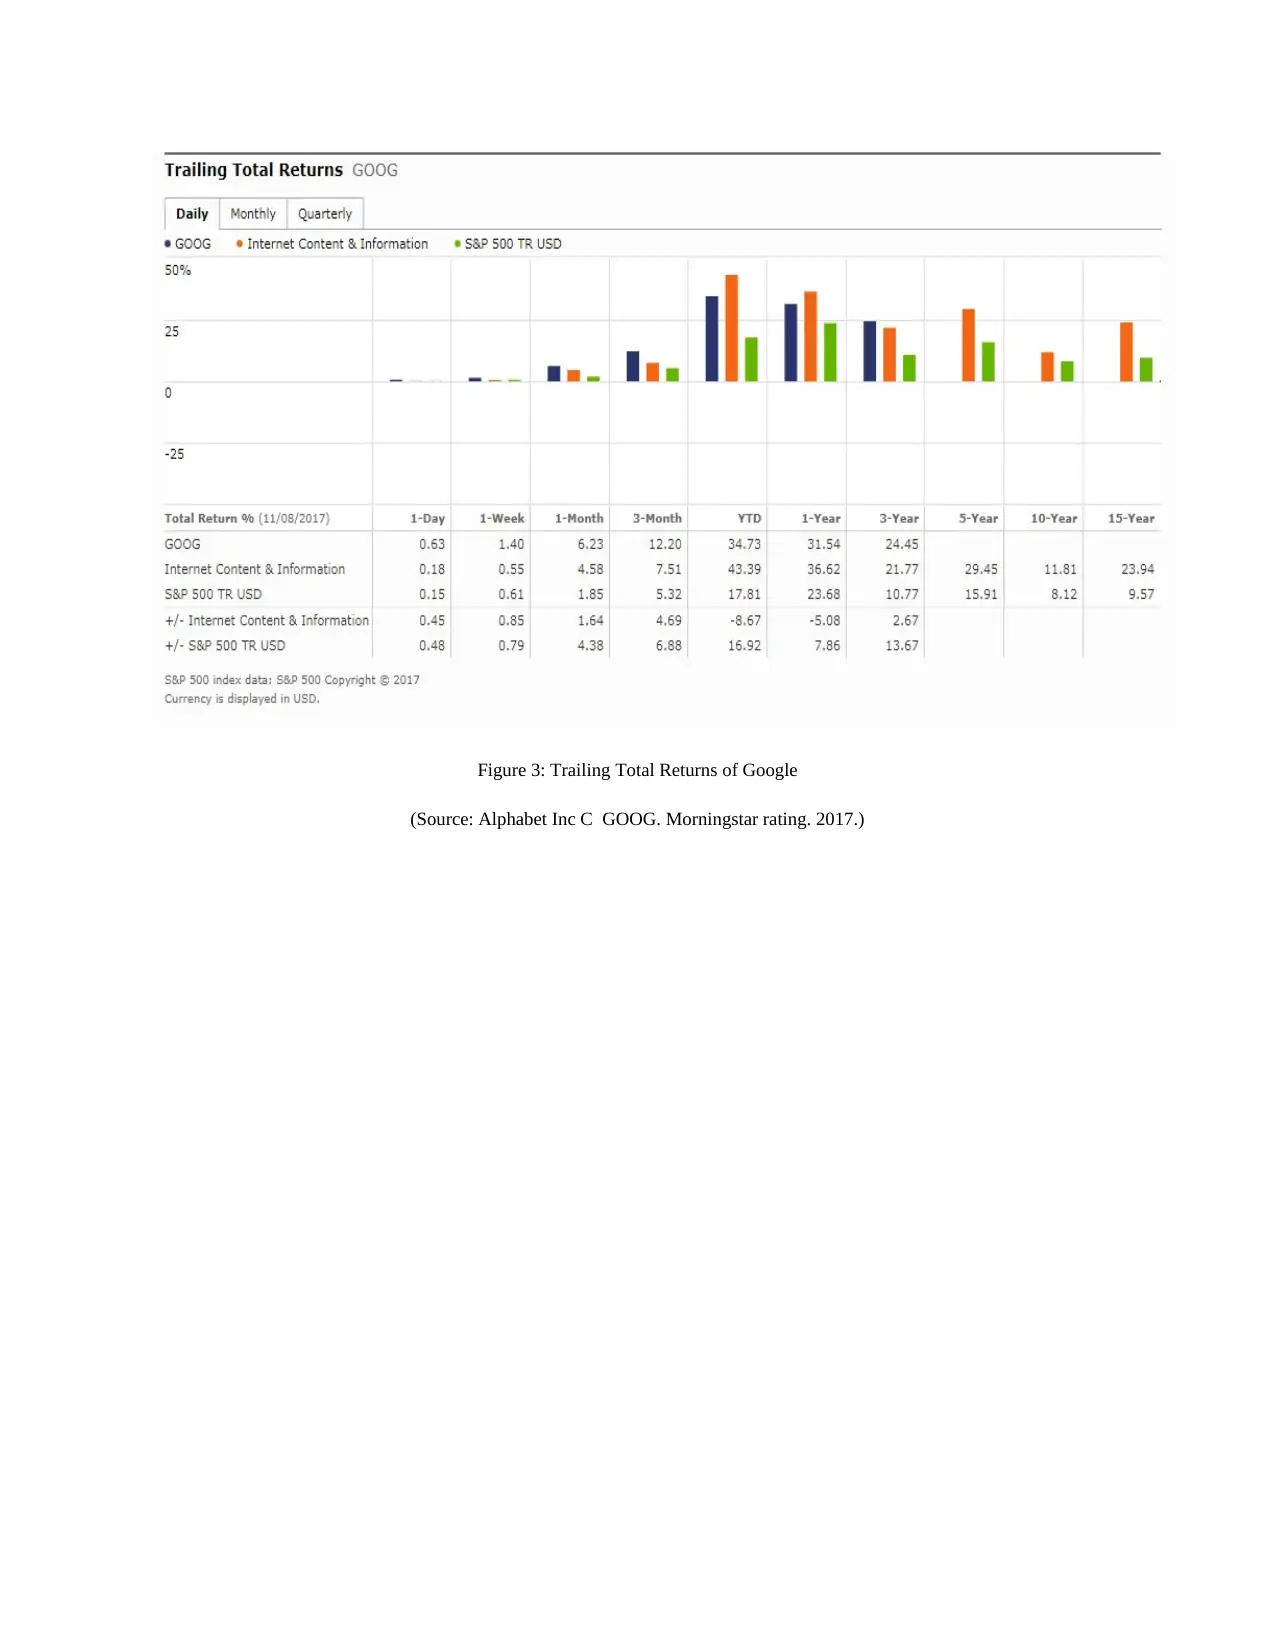
Figure 3: Trailing Total Returns of Google
(Source: Alphabet Inc C GOOG. Morningstar rating. 2017.)
(Source: Alphabet Inc C GOOG. Morningstar rating. 2017.)
Paraphrase This Document
Need a fresh take? Get an instant paraphrase of this document with our AI Paraphraser
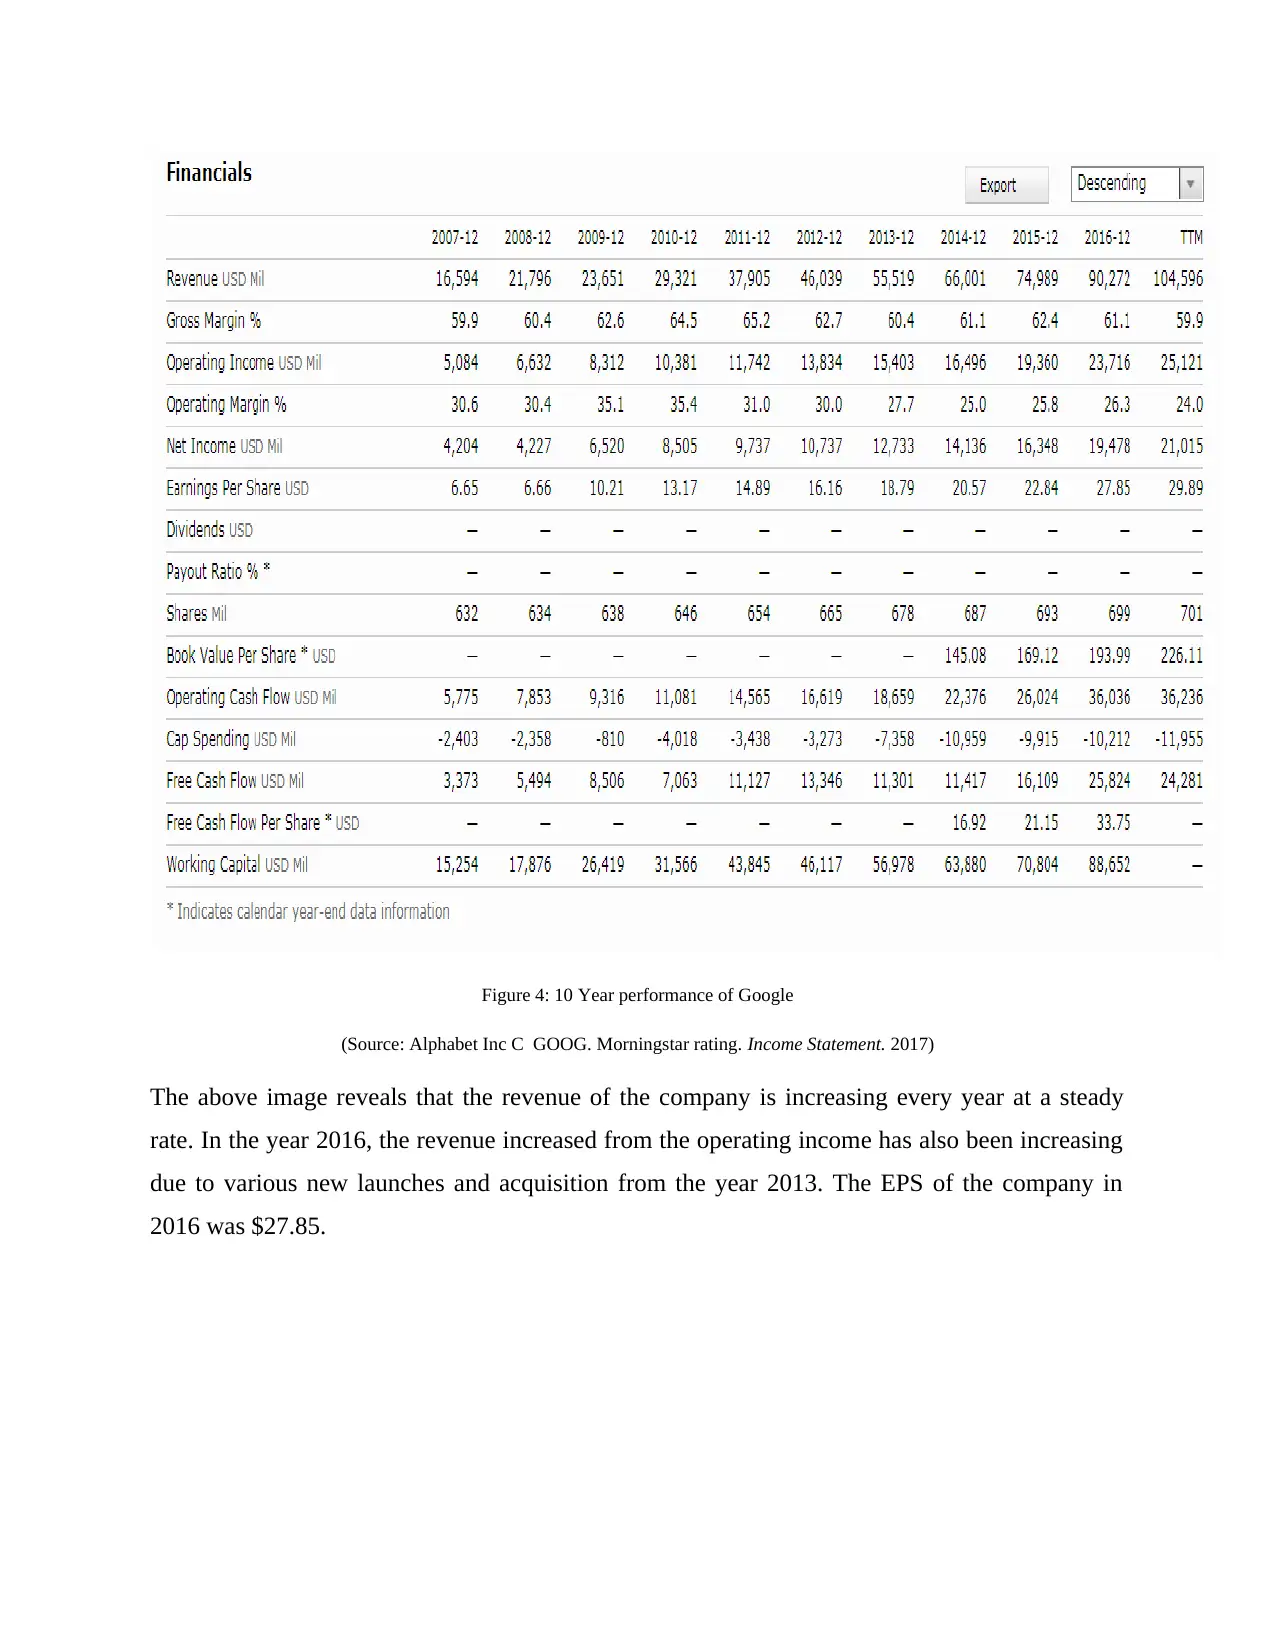
Figure 4: 10 Year performance of Google
(Source: Alphabet Inc C GOOG. Morningstar rating. Income Statement. 2017)
The above image reveals that the revenue of the company is increasing every year at a steady
rate. In the year 2016, the revenue increased from the operating income has also been increasing
due to various new launches and acquisition from the year 2013. The EPS of the company in
2016 was $27.85.
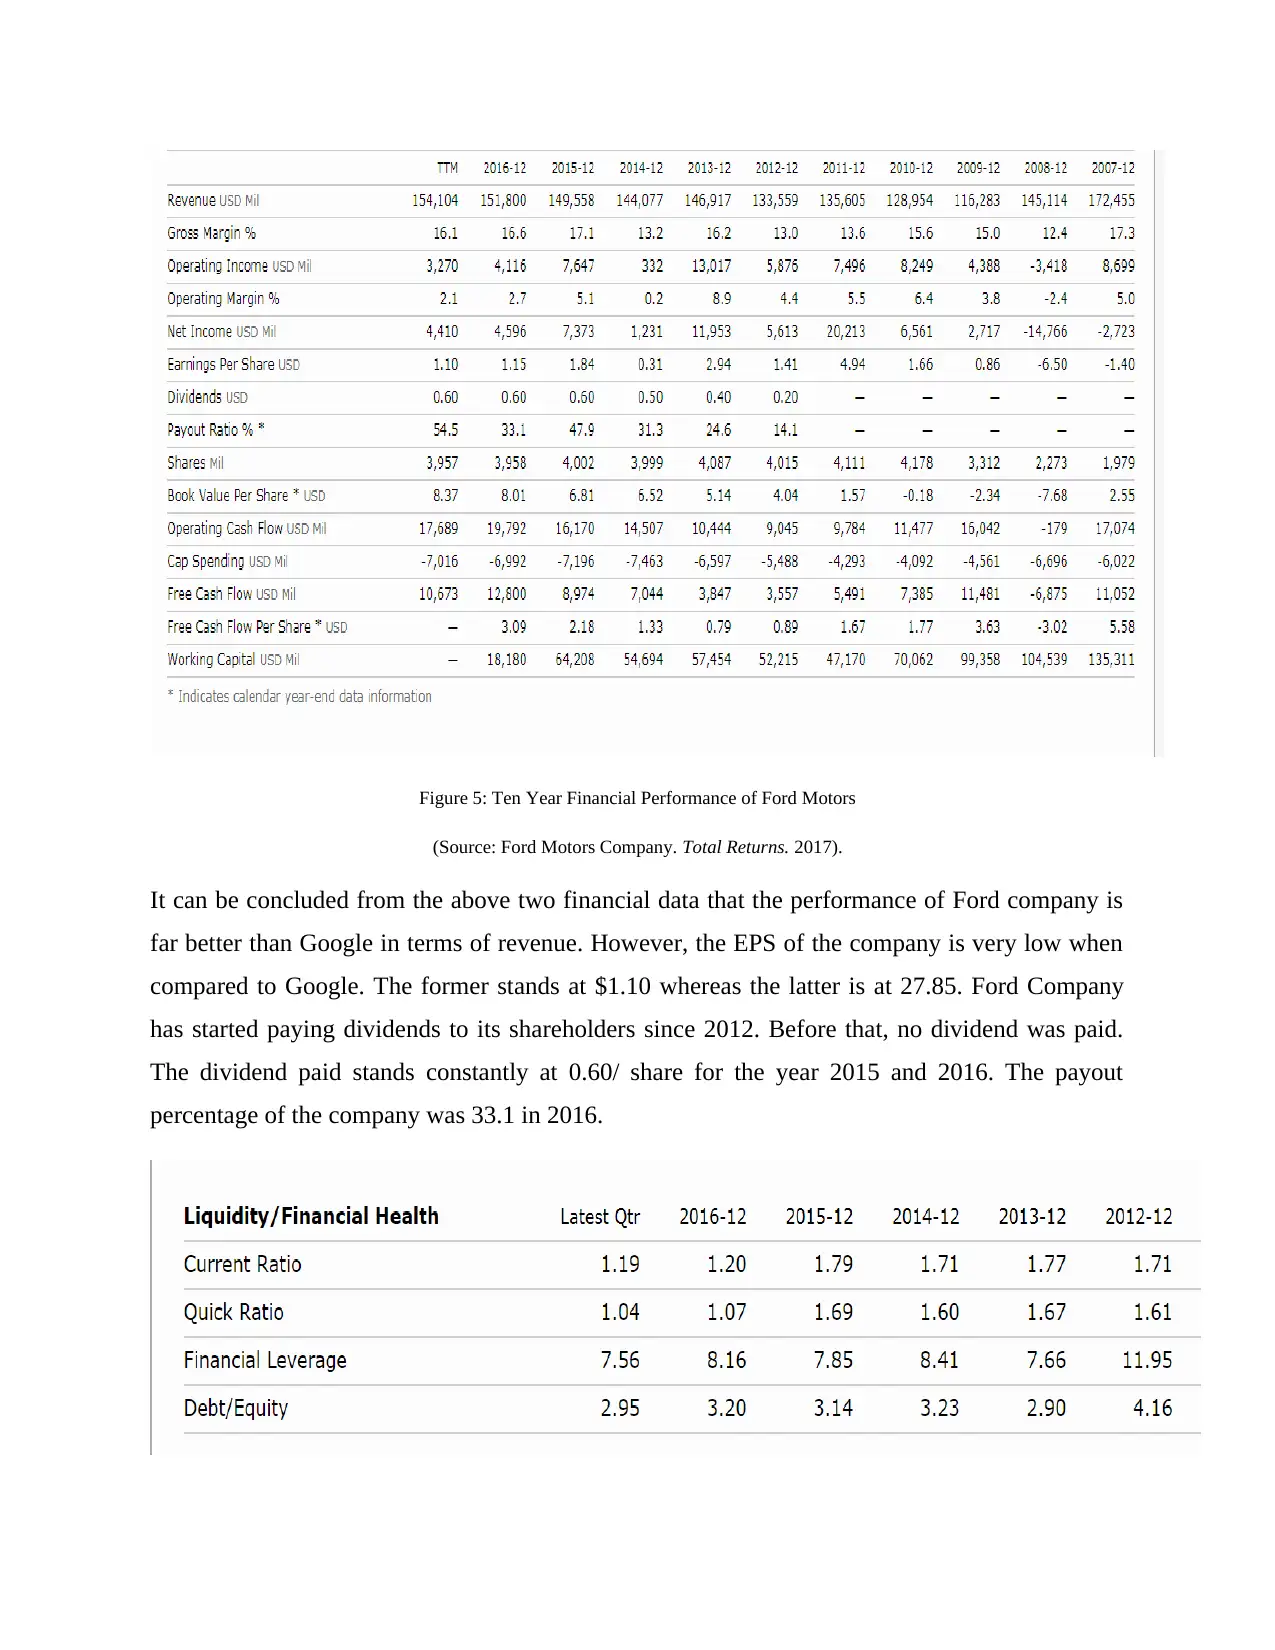
Figure 5: Ten Year Financial Performance of Ford Motors
(Source: Ford Motors Company. Total Returns. 2017).
It can be concluded from the above two financial data that the performance of Ford company is
far better than Google in terms of revenue. However, the EPS of the company is very low when
compared to Google. The former stands at $1.10 whereas the latter is at 27.85. Ford Company
has started paying dividends to its shareholders since 2012. Before that, no dividend was paid.
The dividend paid stands constantly at 0.60/ share for the year 2015 and 2016. The payout
percentage of the company was 33.1 in 2016.
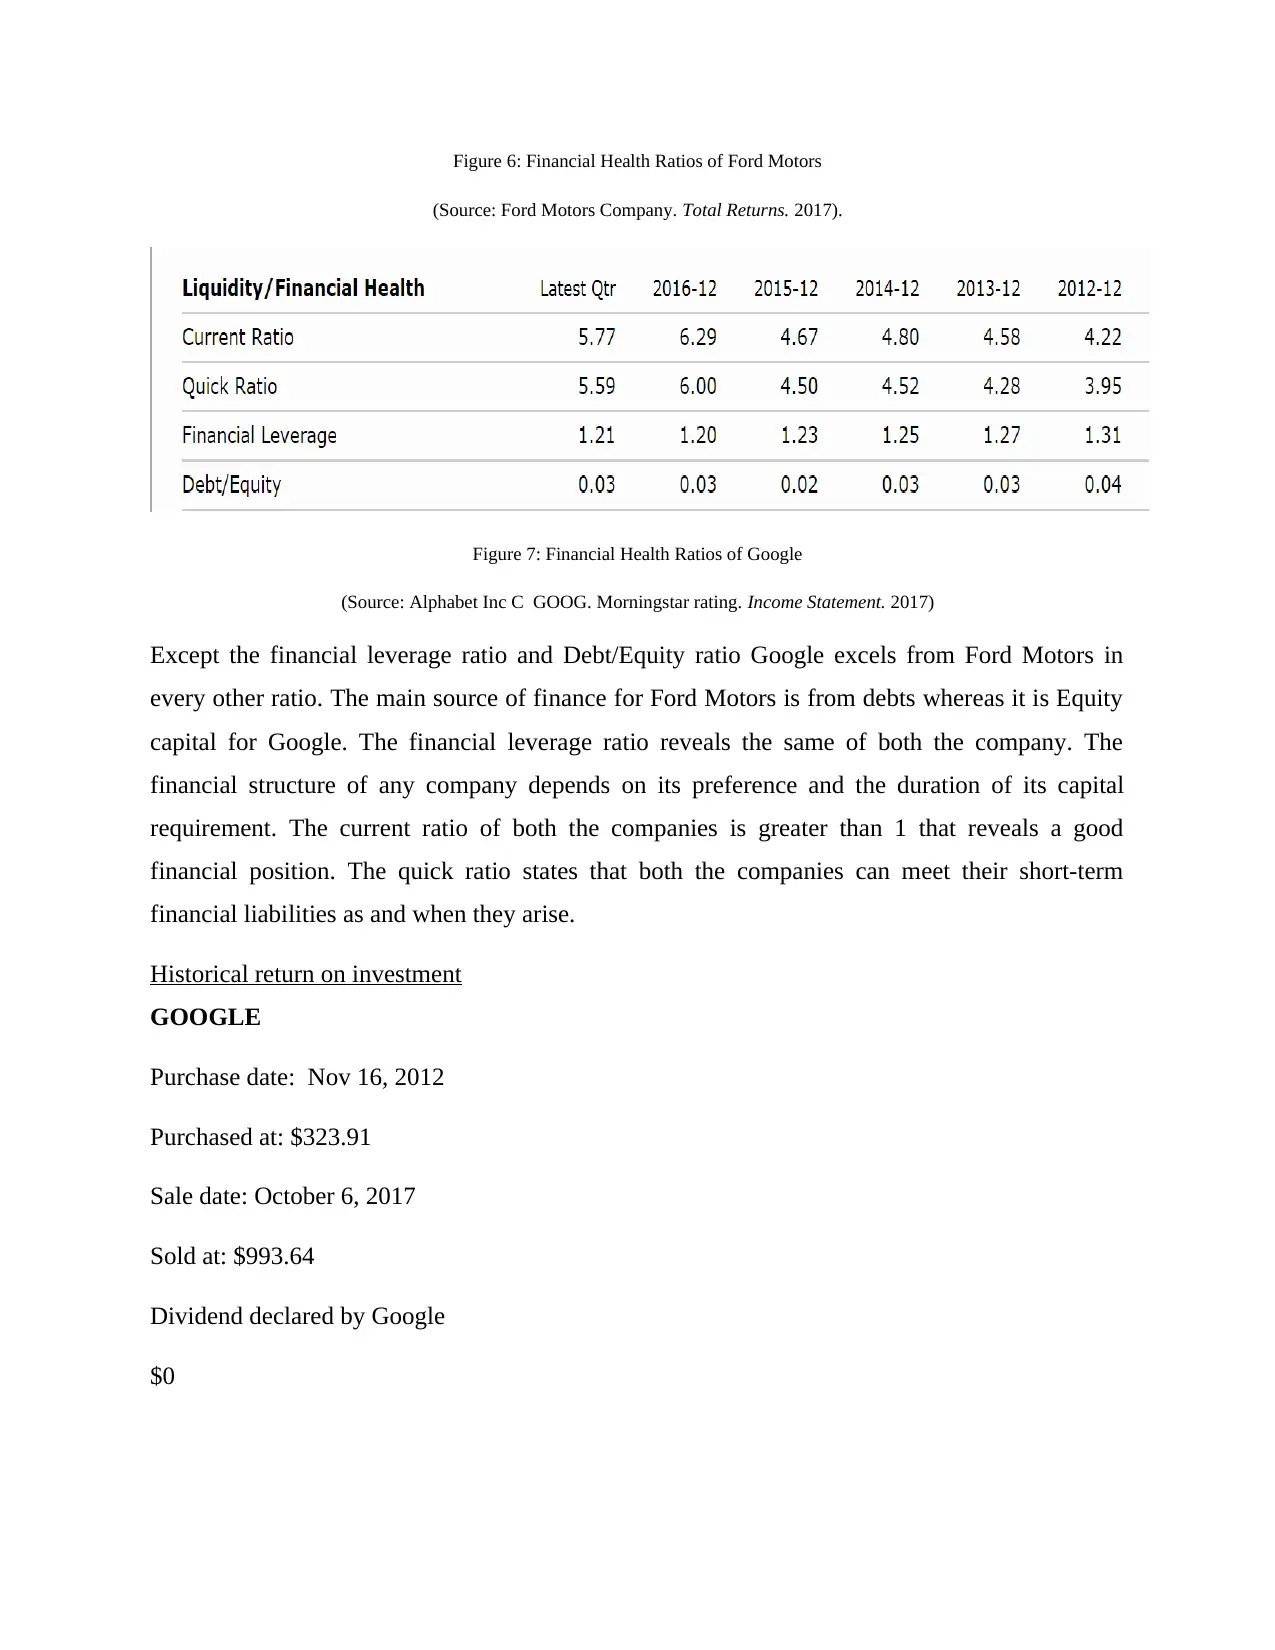
Figure 6: Financial Health Ratios of Ford Motors
(Source: Ford Motors Company. Total Returns. 2017).
Figure 7: Financial Health Ratios of Google
(Source: Alphabet Inc C GOOG. Morningstar rating. Income Statement. 2017)
Except the financial leverage ratio and Debt/Equity ratio Google excels from Ford Motors in
every other ratio. The main source of finance for Ford Motors is from debts whereas it is Equity
capital for Google. The financial leverage ratio reveals the same of both the company. The
financial structure of any company depends on its preference and the duration of its capital
requirement. The current ratio of both the companies is greater than 1 that reveals a good
financial position. The quick ratio states that both the companies can meet their short-term
financial liabilities as and when they arise.
Historical return on investment
GOOGLE
Purchase date: Nov 16, 2012
Purchased at: $323.91
Sale date: October 6, 2017
Sold at: $993.64
Dividend declared by Google
$0
(Source: Ford Motors Company. Total Returns. 2017).
Figure 7: Financial Health Ratios of Google
(Source: Alphabet Inc C GOOG. Morningstar rating. Income Statement. 2017)
Except the financial leverage ratio and Debt/Equity ratio Google excels from Ford Motors in
every other ratio. The main source of finance for Ford Motors is from debts whereas it is Equity
capital for Google. The financial leverage ratio reveals the same of both the company. The
financial structure of any company depends on its preference and the duration of its capital
requirement. The current ratio of both the companies is greater than 1 that reveals a good
financial position. The quick ratio states that both the companies can meet their short-term
financial liabilities as and when they arise.
Historical return on investment
Purchase date: Nov 16, 2012
Purchased at: $323.91
Sale date: October 6, 2017
Sold at: $993.64
Dividend declared by Google
$0
Secure Best Marks with AI Grader
Need help grading? Try our AI Grader for instant feedback on your assignments.
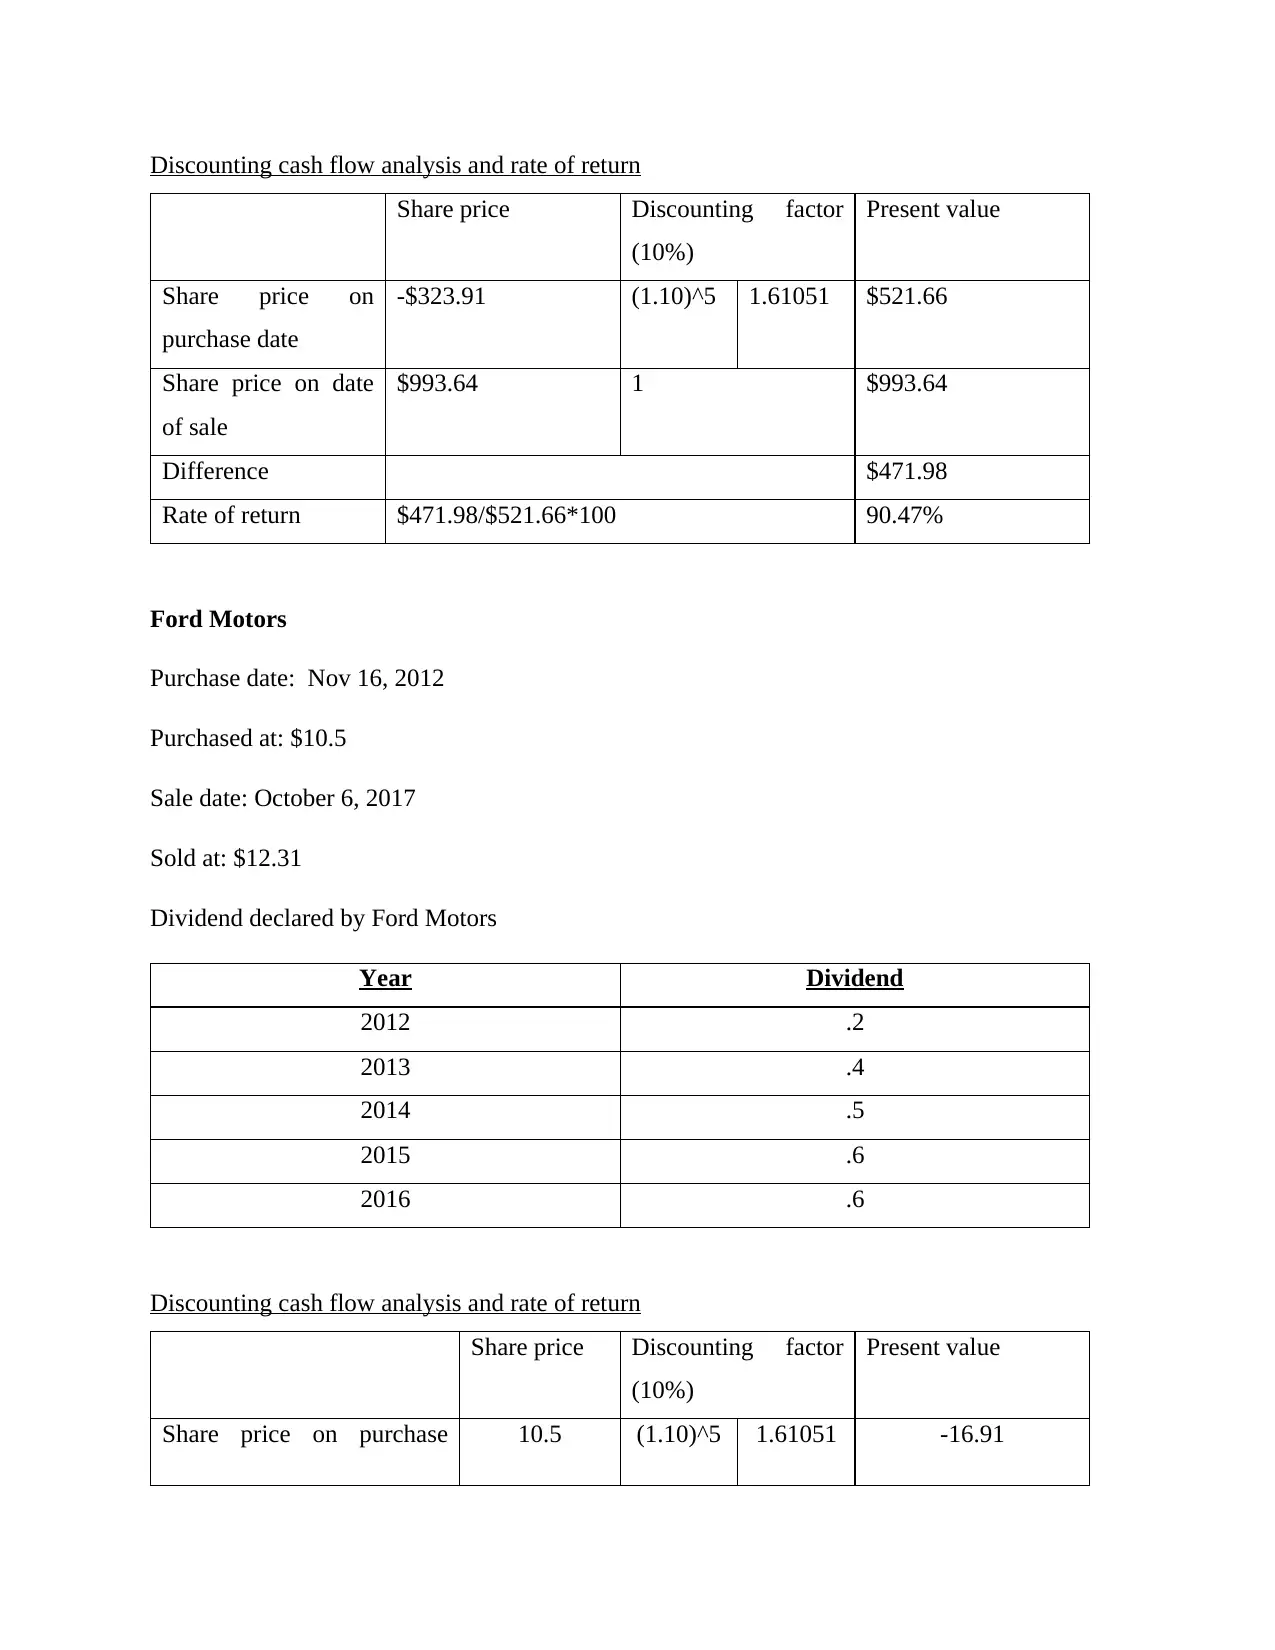
Discounting cash flow analysis and rate of return
Share price Discounting factor
(10%)
Present value
Share price on
purchase date
-$323.91 (1.10)^5 1.61051 $521.66
Share price on date
of sale
$993.64 1 $993.64
Difference $471.98
Rate of return $471.98/$521.66*100 90.47%
Ford Motors
Purchase date: Nov 16, 2012
Purchased at: $10.5
Sale date: October 6, 2017
Sold at: $12.31
Dividend declared by Ford Motors
Year Dividend
2012 .2
2013 .4
2014 .5
2015 .6
2016 .6
Discounting cash flow analysis and rate of return
Share price Discounting factor
(10%)
Present value
Share price on purchase 10.5 (1.10)^5 1.61051 -16.91
Share price Discounting factor
(10%)
Present value
Share price on
purchase date
-$323.91 (1.10)^5 1.61051 $521.66
Share price on date
of sale
$993.64 1 $993.64
Difference $471.98
Rate of return $471.98/$521.66*100 90.47%
Ford Motors
Purchase date: Nov 16, 2012
Purchased at: $10.5
Sale date: October 6, 2017
Sold at: $12.31
Dividend declared by Ford Motors
Year Dividend
2012 .2
2013 .4
2014 .5
2015 .6
2016 .6
Discounting cash flow analysis and rate of return
Share price Discounting factor
(10%)
Present value
Share price on purchase 10.5 (1.10)^5 1.61051 -16.91
date
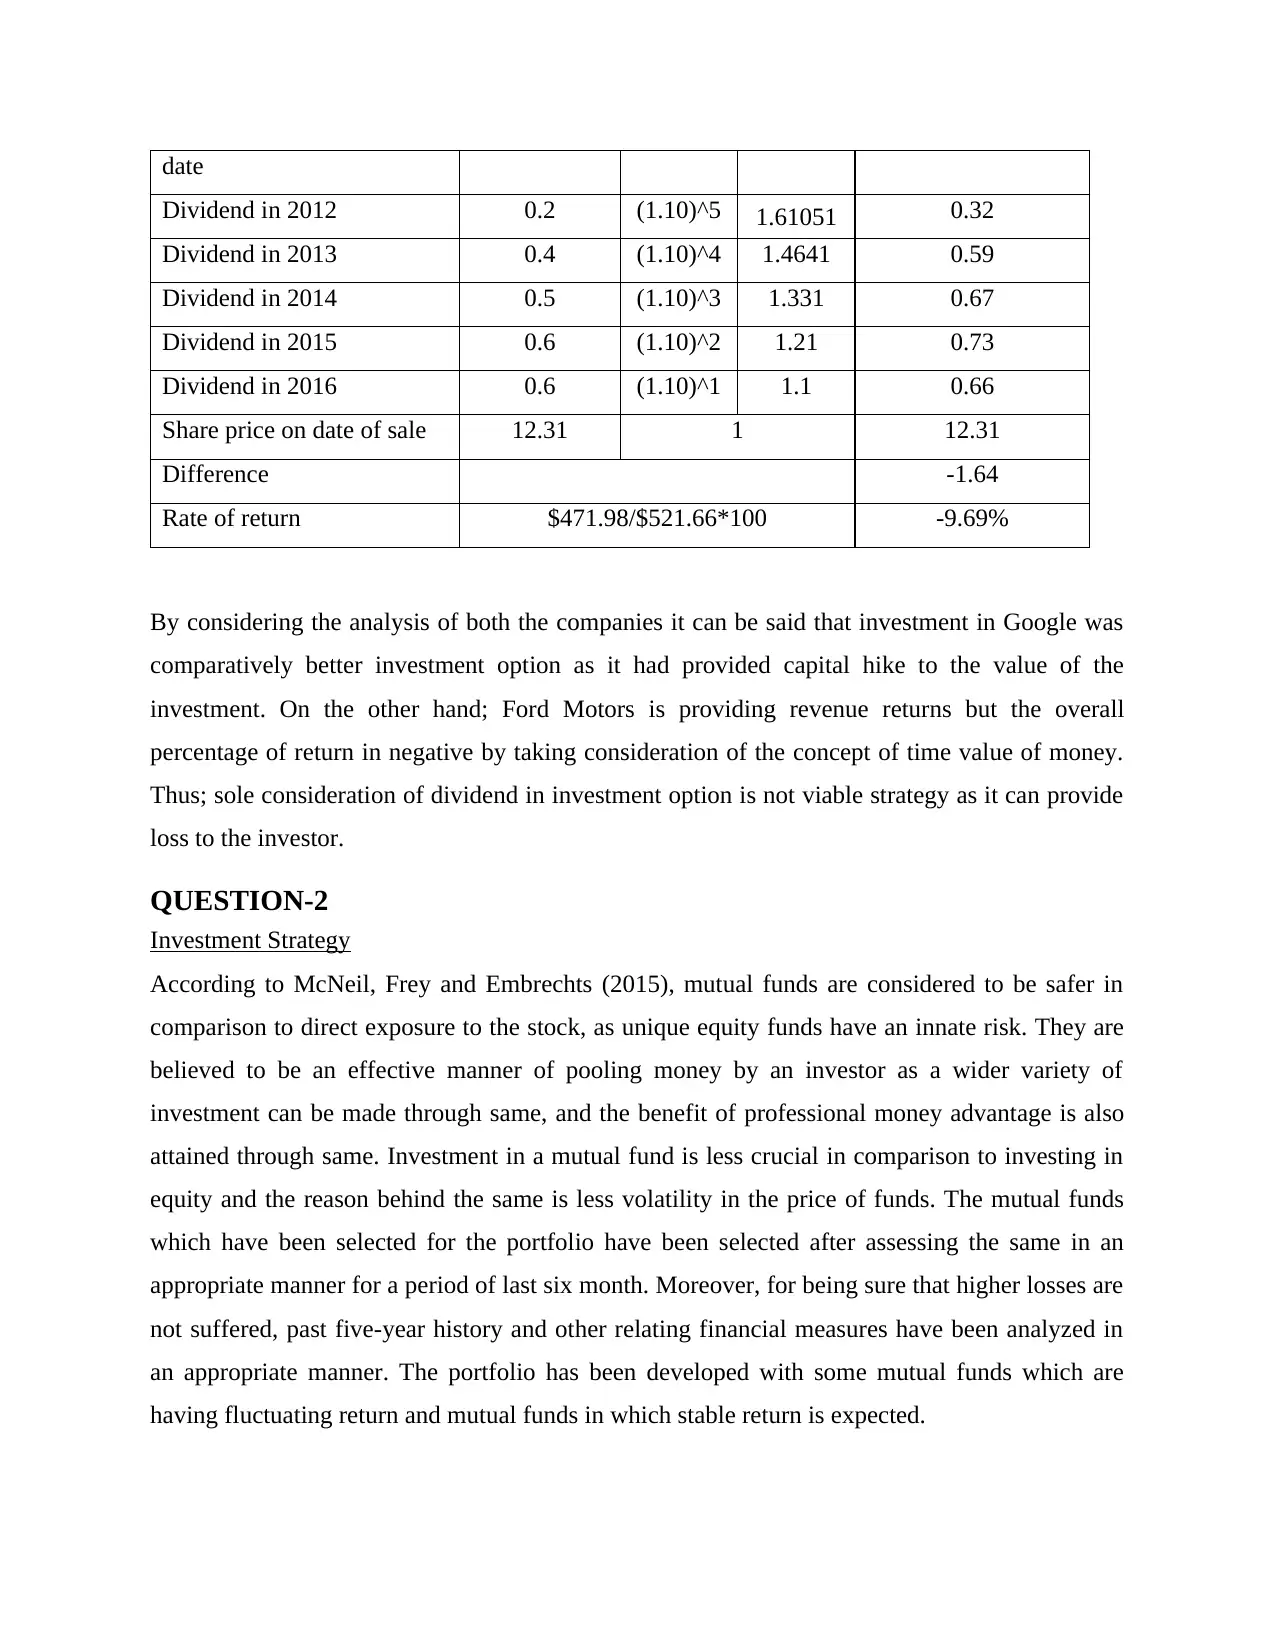
Dividend in 2012 0.2 (1.10)^5 1.61051 0.32
Dividend in 2013 0.4 (1.10)^4 1.4641 0.59
Dividend in 2014 0.5 (1.10)^3 1.331 0.67
Dividend in 2015 0.6 (1.10)^2 1.21 0.73
Dividend in 2016 0.6 (1.10)^1 1.1 0.66
Share price on date of sale 12.31 1 12.31
Difference -1.64
Rate of return $471.98/$521.66*100 -9.69%
By considering the analysis of both the companies it can be said that investment in Google was
comparatively better investment option as it had provided capital hike to the value of the
investment. On the other hand; Ford Motors is providing revenue returns but the overall
percentage of return in negative by taking consideration of the concept of time value of money.
Thus; sole consideration of dividend in investment option is not viable strategy as it can provide
loss to the investor.
QUESTION-2
Investment Strategy
According to McNeil, Frey and Embrechts (2015), mutual funds are considered to be safer in
comparison to direct exposure to the stock, as unique equity funds have an innate risk. They are
believed to be an effective manner of pooling money by an investor as a wider variety of
investment can be made through same, and the benefit of professional money advantage is also
attained through same. Investment in a mutual fund is less crucial in comparison to investing in
equity and the reason behind the same is less volatility in the price of funds. The mutual funds
which have been selected for the portfolio have been selected after assessing the same in an
appropriate manner for a period of last six month. Moreover, for being sure that higher losses are
not suffered, past five-year history and other relating financial measures have been analyzed in
an appropriate manner. The portfolio has been developed with some mutual funds which are
having fluctuating return and mutual funds in which stable return is expected.

As per Bodie (2013), higher risk and higher return have direct relationship, but the whole
investment cannot be made in these securities as it might turn into either total loss or total profit.
For not facing the same situation diversification method has been applied for developing the
portfolio and mixed return mutual funds have been selected in order to attain a sustainable rate of
return from the investment. The main strategy which will be applied while investing in a mutual
fund will be Performance- weighting strategy. The strategy is believed to be a middle line
between market line and buy and hold. Through this strategy, adjustment will be made in the
portfolio from time to time in accordance with the performance of mutual funds Buy and Hold
strategy. Another strategy which will be applied to attain higher gain is investing in the recession
of purchasing mutual funds whose rate of return is less or prices have fallen. It is believed to be
risky, but the same will be applied to increase the overall rate of the portfolio. The specified
mutual funds will be put on hold for some period in order analysis the changes in their value and
sell them back at the right time.
The investment will be made after assessing the historical rate of return, analyzing the annual
report and other details which are available online. The price movements will be assessed in
depth in order to be sure whether the amount has been invested in appropriate funds or not.
Diversification will be focused mainly as it is believed that it is not always better to put all eggs
in one basket. Thus, as it the best strategy the same will be followed, and investment will be
made in several mutual funds relating to different sectors. By investing in specified, the risk will
be bifurcated and the advantage of growth from the different area can also through application of
this strategy.
Macroeconomic factors and its impact on financial market
According to the words of Michalski (2014), macroeconomics is engaged in integrating the
complex data and details of several variables in the economy as a whole with key fundaments
and further analyzes the conduct of these variables of macroeconomics. As per Segal,
Shaliastovich and Yaron (2015), markets conduct decisions by making use of prices. The main
markets that regulate the activities of macro-economy are product market, money market, foreign
and foreign exchange market, labour market, the stock market and natural resource market.
It has been assessed by an analyst that macroeconomic variables are used in developing
statistical approach representing the impact of these specified markets. I believe that stock
Paraphrase This Document
Need a fresh take? Get an instant paraphrase of this document with our AI Paraphraser
market return is regarding the goods and services market and also there is a close connection
between the product and stock market variables. According to the views of Ashraf, Gershman
and Howitt (2016), there is the presence of several markets in the real GDP of the product market
and is the total measure of the activities of economy demonstrating the product market.
Moreover, there are several variables regarding the product market. Certain is the GDP’s direct
elements or attempting to forecast the conduct of these variables. On the other hand, real GDP is
the most specified variable while assessing the stock return.
As per the views of Mankiw (2014), inflation is one of a significant variant which has an impact
on many variables inclusive of the stock market too. The likely relationship between the stock
market and inflation is considered as positive, as stocks are said to be the claim on assets and
hedge on inflation. Conversely, in contrast with the expectations, the statistical model in this
cited paper and the outcomes of observed studies state that there is a contrary relationship of
inflation with stock prices. Observed research also states that various variables of money market
like an interest rate of money supply are important regarding the stock prices. Nonetheless,
subsequent to the equilibrium analysis of the money market that is interest rates representing the
price, the bond of ten years has been considered as the possible risk factor.
According to the opinion of Almumani (2014), the interest rate is said to be a discount factor in
the model of valuation, and for the firms, it is a cost factor. Therefore they have nominator as
well as a denominator impact on the model of valuation. Nevertheless, the effect on the return
can be dissimilar for diversified firms. For some of the firms it can result as negative, and for
remaining, it can be positive. Consequently, the effect on the exchange rate on the stock market
is insignificant. An offshore variable of the economy creates a direct impact on the stock market,
by the effect on the profits of firm instead of the indirect effect by the exchange rate. Practical
studies have also surveyed the effects of the variable of macro-economy by the manner they
impact profits of the firms.
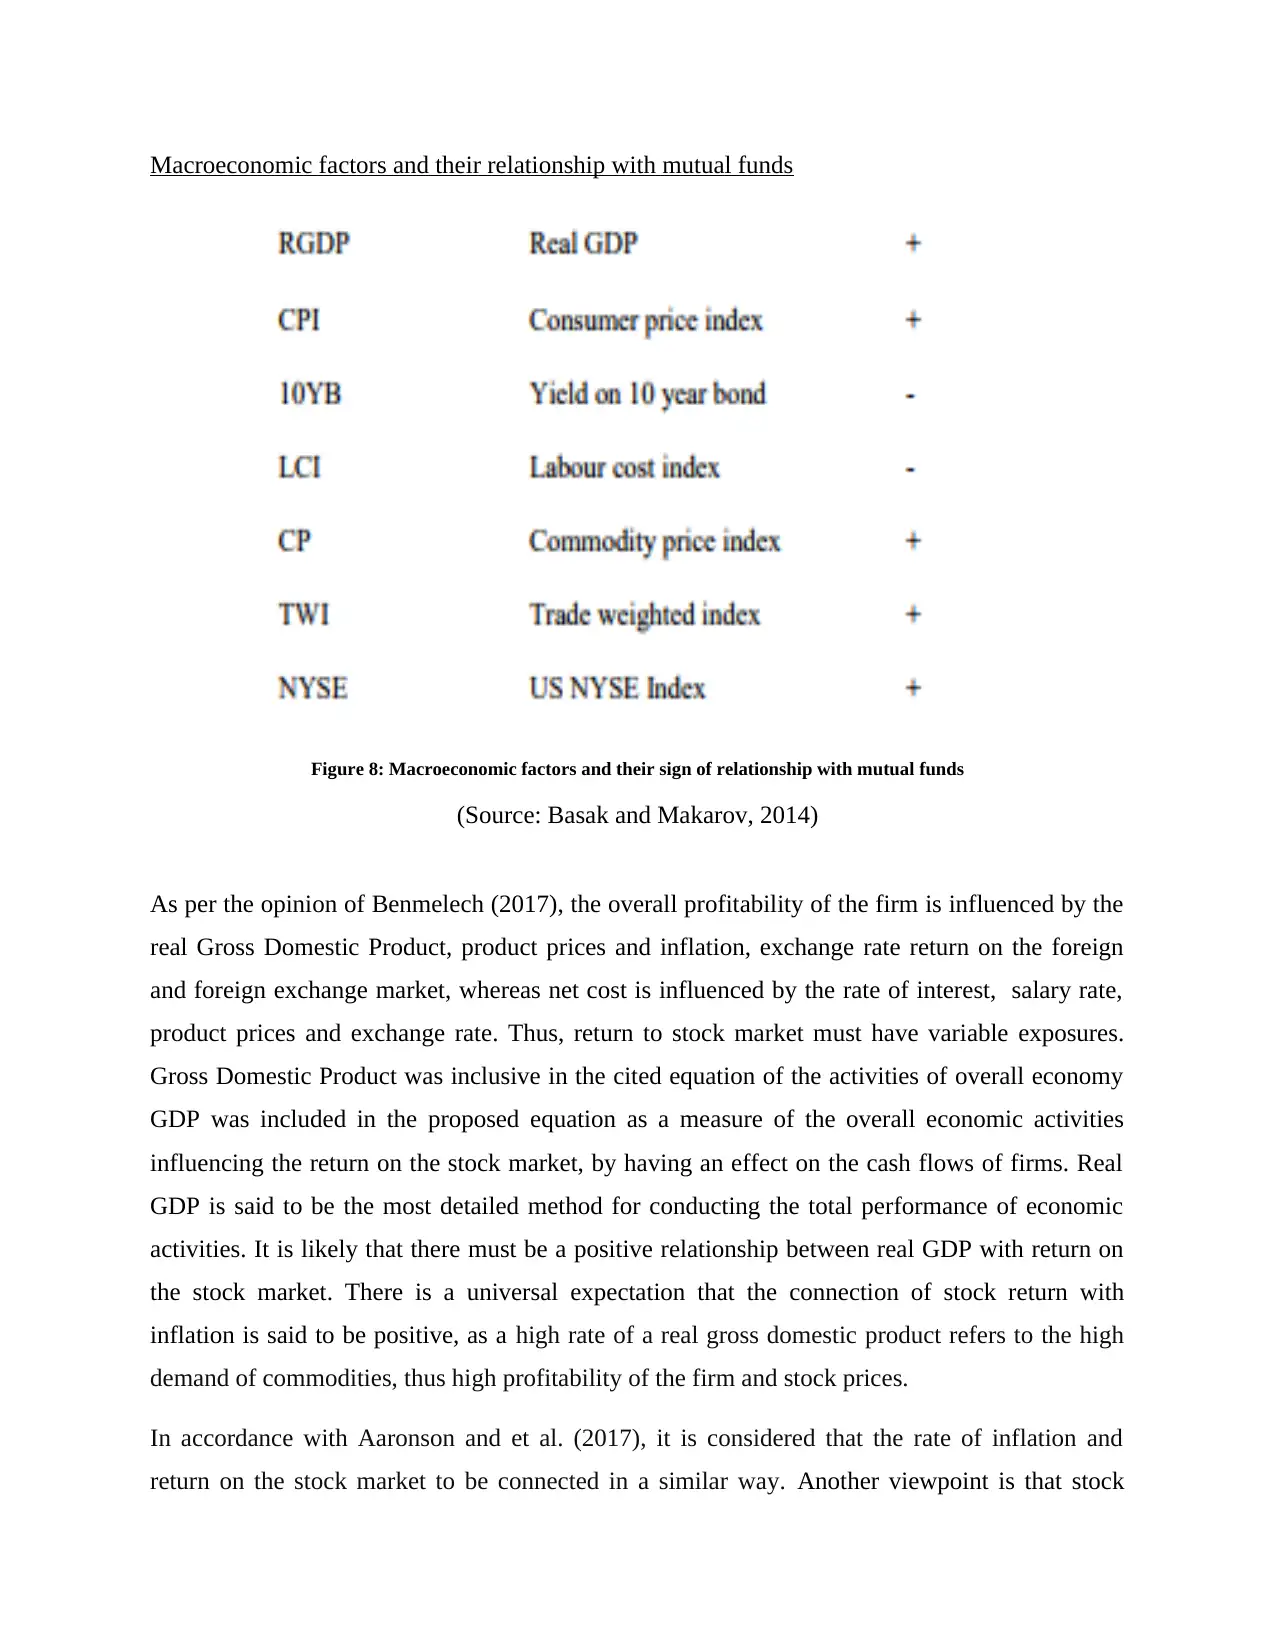
Macroeconomic factors and their relationship with mutual funds
Figure 8: Macroeconomic factors and their sign of relationship with mutual funds
(Source: Basak and Makarov, 2014)
As per the opinion of Benmelech (2017), the overall profitability of the firm is influenced by the
real Gross Domestic Product, product prices and inflation, exchange rate return on the foreign
and foreign exchange market, whereas net cost is influenced by the rate of interest, salary rate,
product prices and exchange rate. Thus, return to stock market must have variable exposures.
Gross Domestic Product was inclusive in the cited equation of the activities of overall economy
GDP was included in the proposed equation as a measure of the overall economic activities
influencing the return on the stock market, by having an effect on the cash flows of firms. Real
GDP is said to be the most detailed method for conducting the total performance of economic
activities. It is likely that there must be a positive relationship between real GDP with return on
the stock market. There is a universal expectation that the connection of stock return with
inflation is said to be positive, as a high rate of a real gross domestic product refers to the high
demand of commodities, thus high profitability of the firm and stock prices.
In accordance with Aaronson and et al. (2017), it is considered that the rate of inflation and
return on the stock market to be connected in a similar way. Another viewpoint is that stock
prices are a hedge in opposition to inflation as they are the claims on real assets. The rate of
interest in connection to return to the stock market in many ways. Initially, assets holding interest
like bonds and inventories are substitutes, in regards to the portfolio investment.
The thesis of portfolio recommends that a rise in interest rates results in a shift in the portfolio
from non-interest holding money to interest holding financing assets like inventory or bonds. The
high rate of interest means low prices of stock being an outcome of substitution. Next, the
interest rate is considered as cost measure for the firms, and it further impacts the cash flow
activities of firms. Indeed, high rates of interest lead to lower profitability. Ultimately, interest is
also a discount measure. Cash flow sooner or later is discounted by making use of interest rate.
Hence, high rate of interest results in lowering the NPV of investment.
The rise in prices of the product means an increase in production cost for some of the firms,
whereas an increase in revenue of product productivity firms. On the other hand, the likely total
effect of product price on the return of stock market is considered vague. Therefore, it is said
that, as the main concern, exchange rates are not likely to surrender a considerable coefficient.
The United States movement is a positive sign of the economic growth globally which
consequently impacts stocks of Australia. Due to the economy of United States which is
approximately 25% of the global economy and the firm of US have global interest. Further, some
companies in Australia and their profitability rely on the economy of United States. By taking
these reasons into account, it is expected that there is a high and positive relationship between
the stock markets of United States.
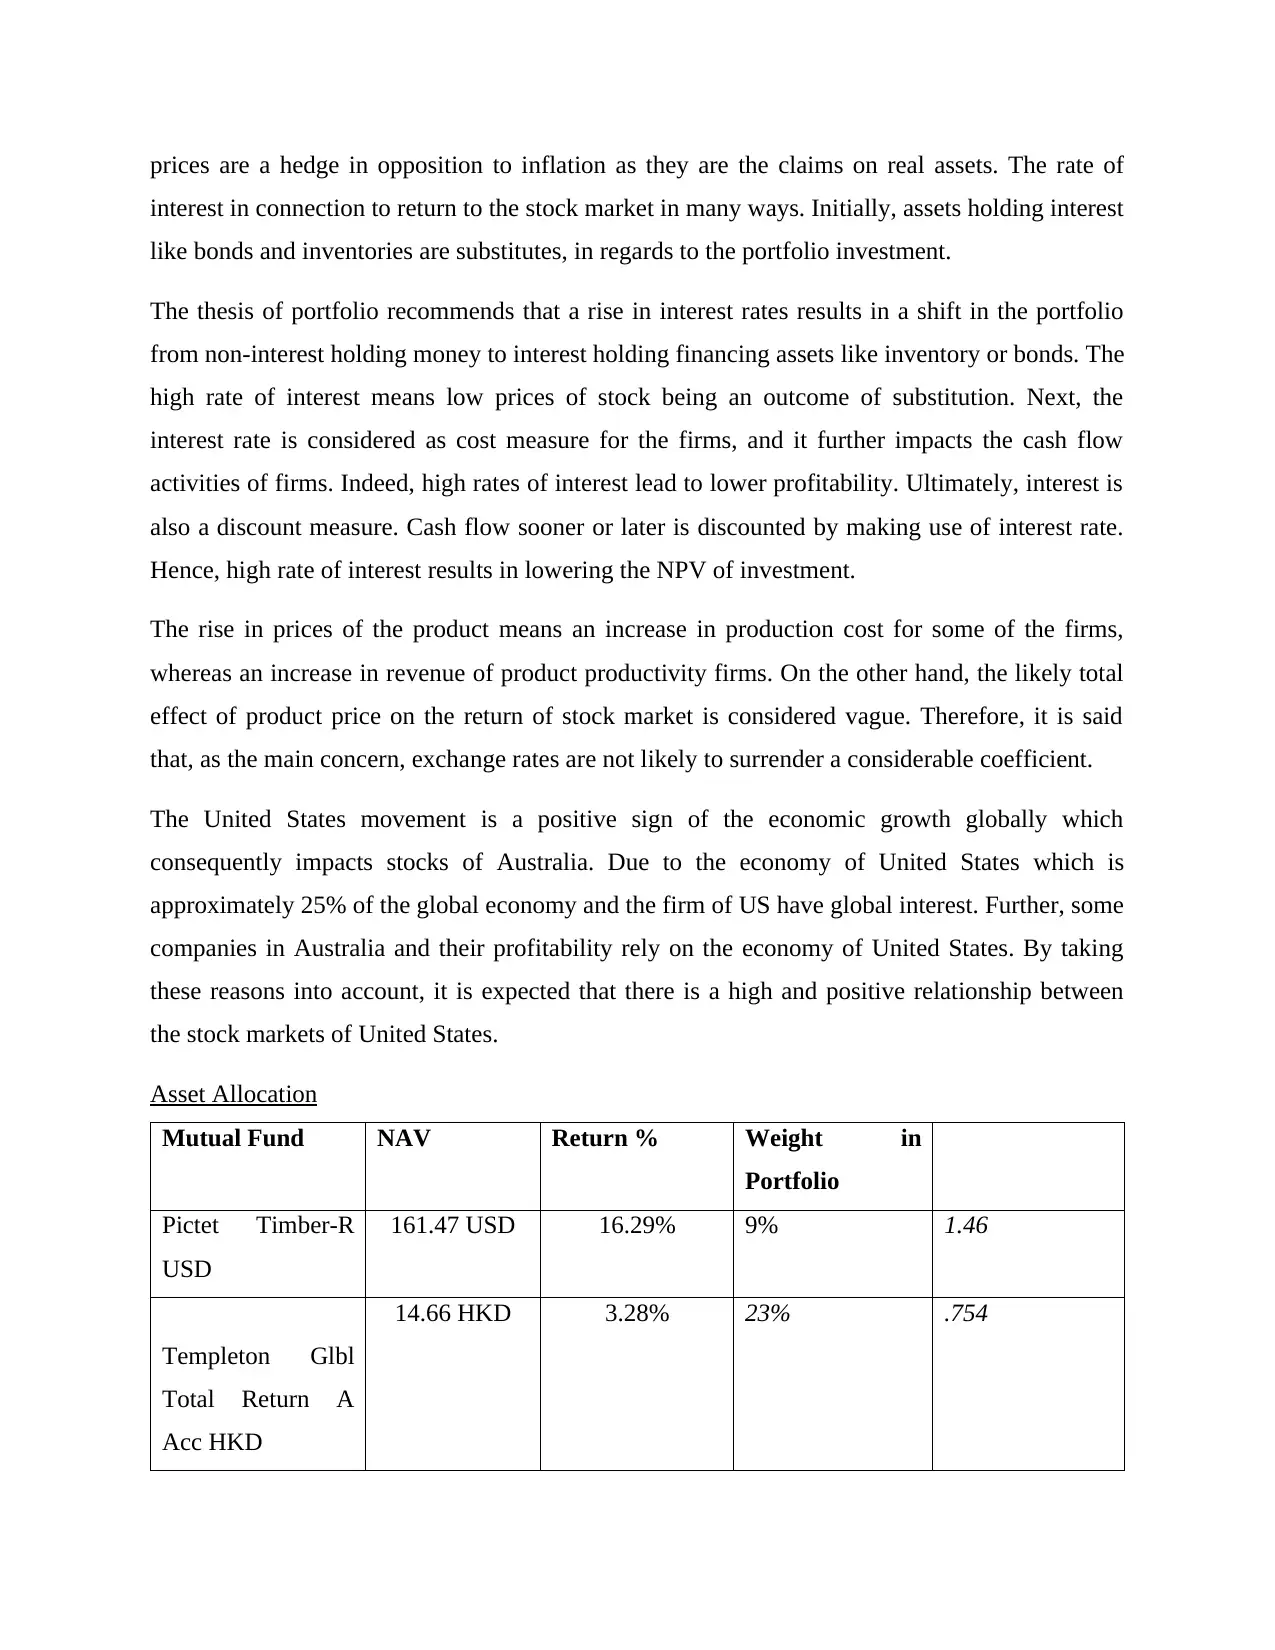
Asset Allocation
Mutual Fund NAV Return % Weight in
Portfolio
Pictet Timber-R
USD
161.47 USD 16.29% 9% 1.46
Templeton Glbl
Total Return A
Acc HKD
14.66 HKD 3.28% 23% .754
interest in connection to return to the stock market in many ways. Initially, assets holding interest
like bonds and inventories are substitutes, in regards to the portfolio investment.
The thesis of portfolio recommends that a rise in interest rates results in a shift in the portfolio
from non-interest holding money to interest holding financing assets like inventory or bonds. The
high rate of interest means low prices of stock being an outcome of substitution. Next, the
interest rate is considered as cost measure for the firms, and it further impacts the cash flow
activities of firms. Indeed, high rates of interest lead to lower profitability. Ultimately, interest is
also a discount measure. Cash flow sooner or later is discounted by making use of interest rate.
Hence, high rate of interest results in lowering the NPV of investment.
The rise in prices of the product means an increase in production cost for some of the firms,
whereas an increase in revenue of product productivity firms. On the other hand, the likely total
effect of product price on the return of stock market is considered vague. Therefore, it is said
that, as the main concern, exchange rates are not likely to surrender a considerable coefficient.
The United States movement is a positive sign of the economic growth globally which
consequently impacts stocks of Australia. Due to the economy of United States which is
approximately 25% of the global economy and the firm of US have global interest. Further, some
companies in Australia and their profitability rely on the economy of United States. By taking
these reasons into account, it is expected that there is a high and positive relationship between
the stock markets of United States.
Asset Allocation
Mutual Fund NAV Return % Weight in
Portfolio
Pictet Timber-R
USD
161.47 USD 16.29% 9% 1.46
Templeton Glbl
Total Return A
Acc HKD
14.66 HKD 3.28% 23% .754
Secure Best Marks with AI Grader
Need help grading? Try our AI Grader for instant feedback on your assignments.
Schroder ISF
Asian Total Ret
A1
202.83 USD 36.40% 9% 3.276
Fidelity Euro
Bond A-Acc-EUR
15.59 EUR -1.45% 5% -.0725
BNPP L1 Equity
Best Sel Euro C C
382.19 EUR 34% 9% 3.06
Templeton Global
Bond A Acc €
27.04 EUR 16.40% 45% 7.38.7
Return of
portfolio
100% 15.858%
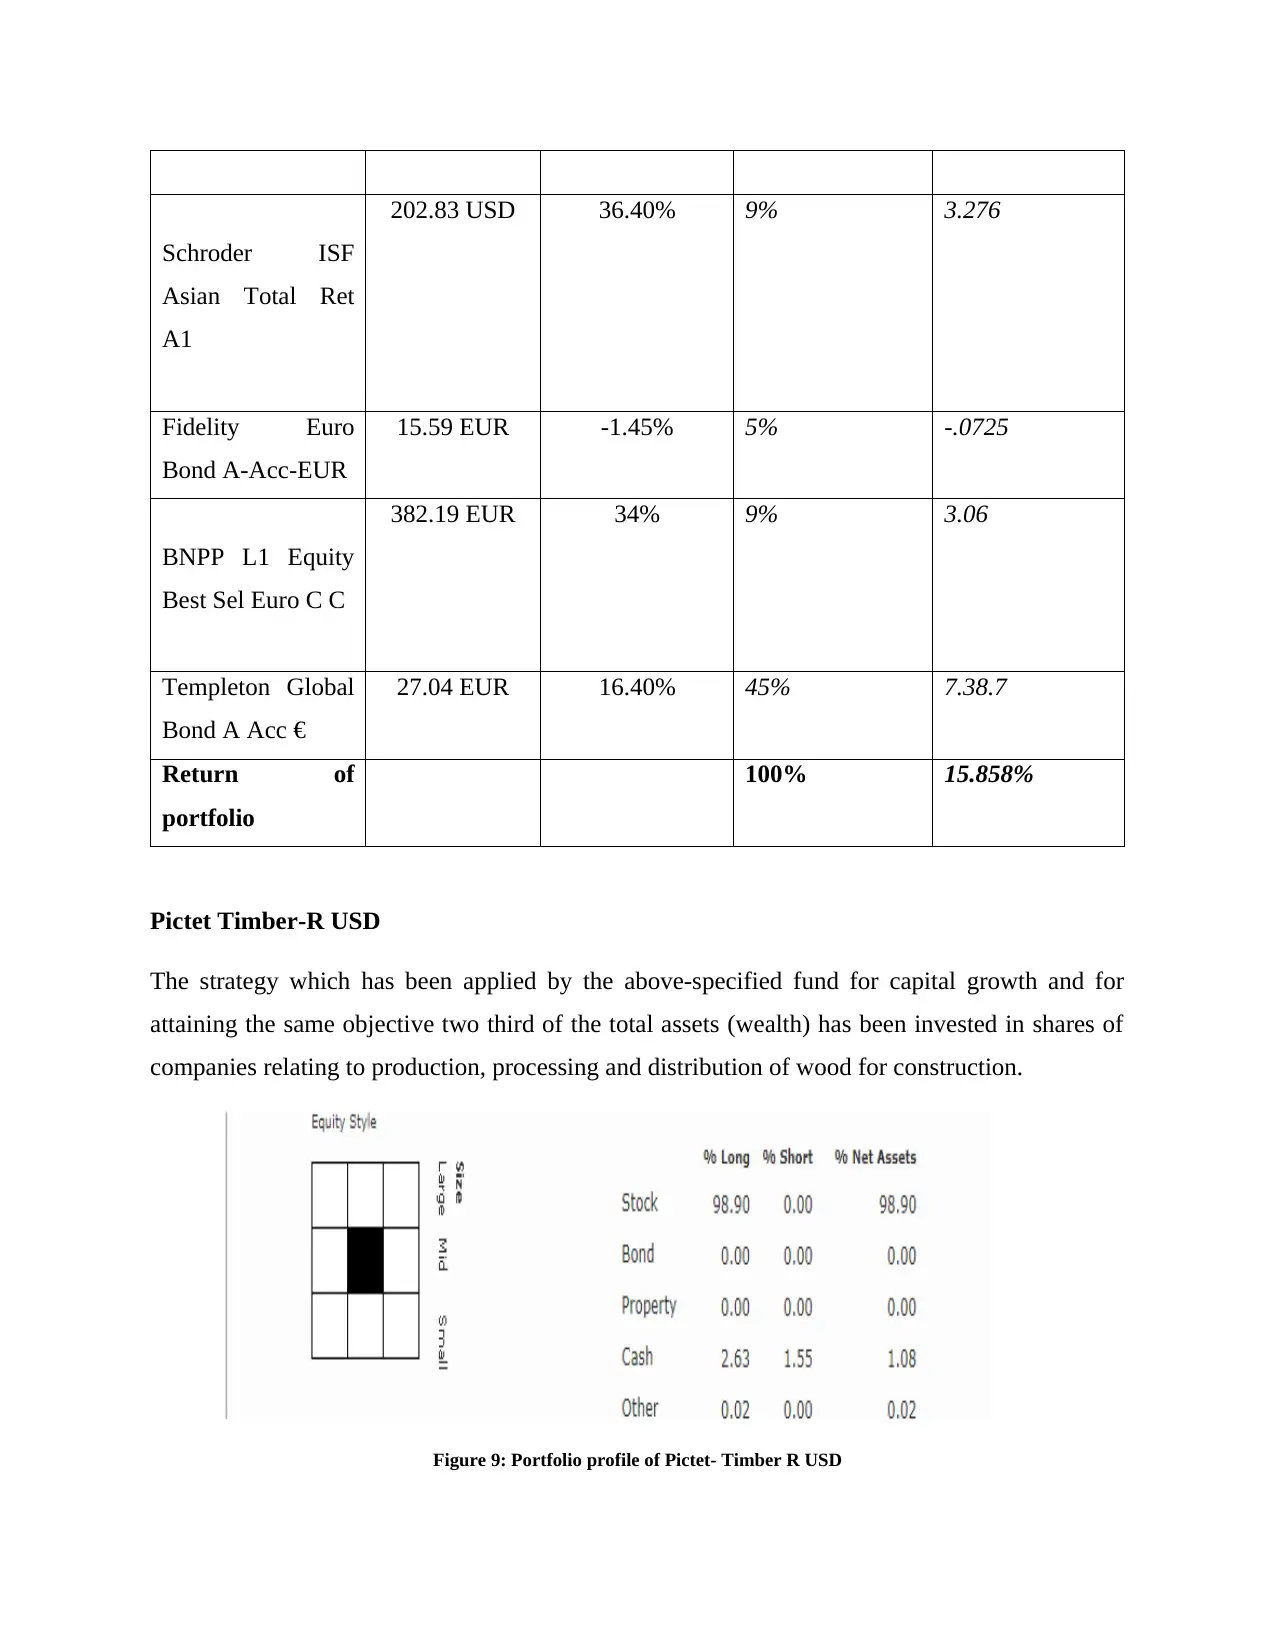
Pictet Timber-R USD
The strategy which has been applied by the above-specified fund for capital growth and for
attaining the same objective two third of the total assets (wealth) has been invested in shares of
companies relating to production, processing and distribution of wood for construction.
Figure 9: Portfolio profile of Pictet- Timber R USD
Asian Total Ret
A1
202.83 USD 36.40% 9% 3.276
Fidelity Euro
Bond A-Acc-EUR
15.59 EUR -1.45% 5% -.0725
BNPP L1 Equity
Best Sel Euro C C
382.19 EUR 34% 9% 3.06
Templeton Global
Bond A Acc €
27.04 EUR 16.40% 45% 7.38.7
Return of
portfolio
100% 15.858%
Pictet Timber-R USD
The strategy which has been applied by the above-specified fund for capital growth and for
attaining the same objective two third of the total assets (wealth) has been invested in shares of
companies relating to production, processing and distribution of wood for construction.
Figure 9: Portfolio profile of Pictet- Timber R USD
(Source: Pictet Timber-R USD. Morningstar. 2017.)
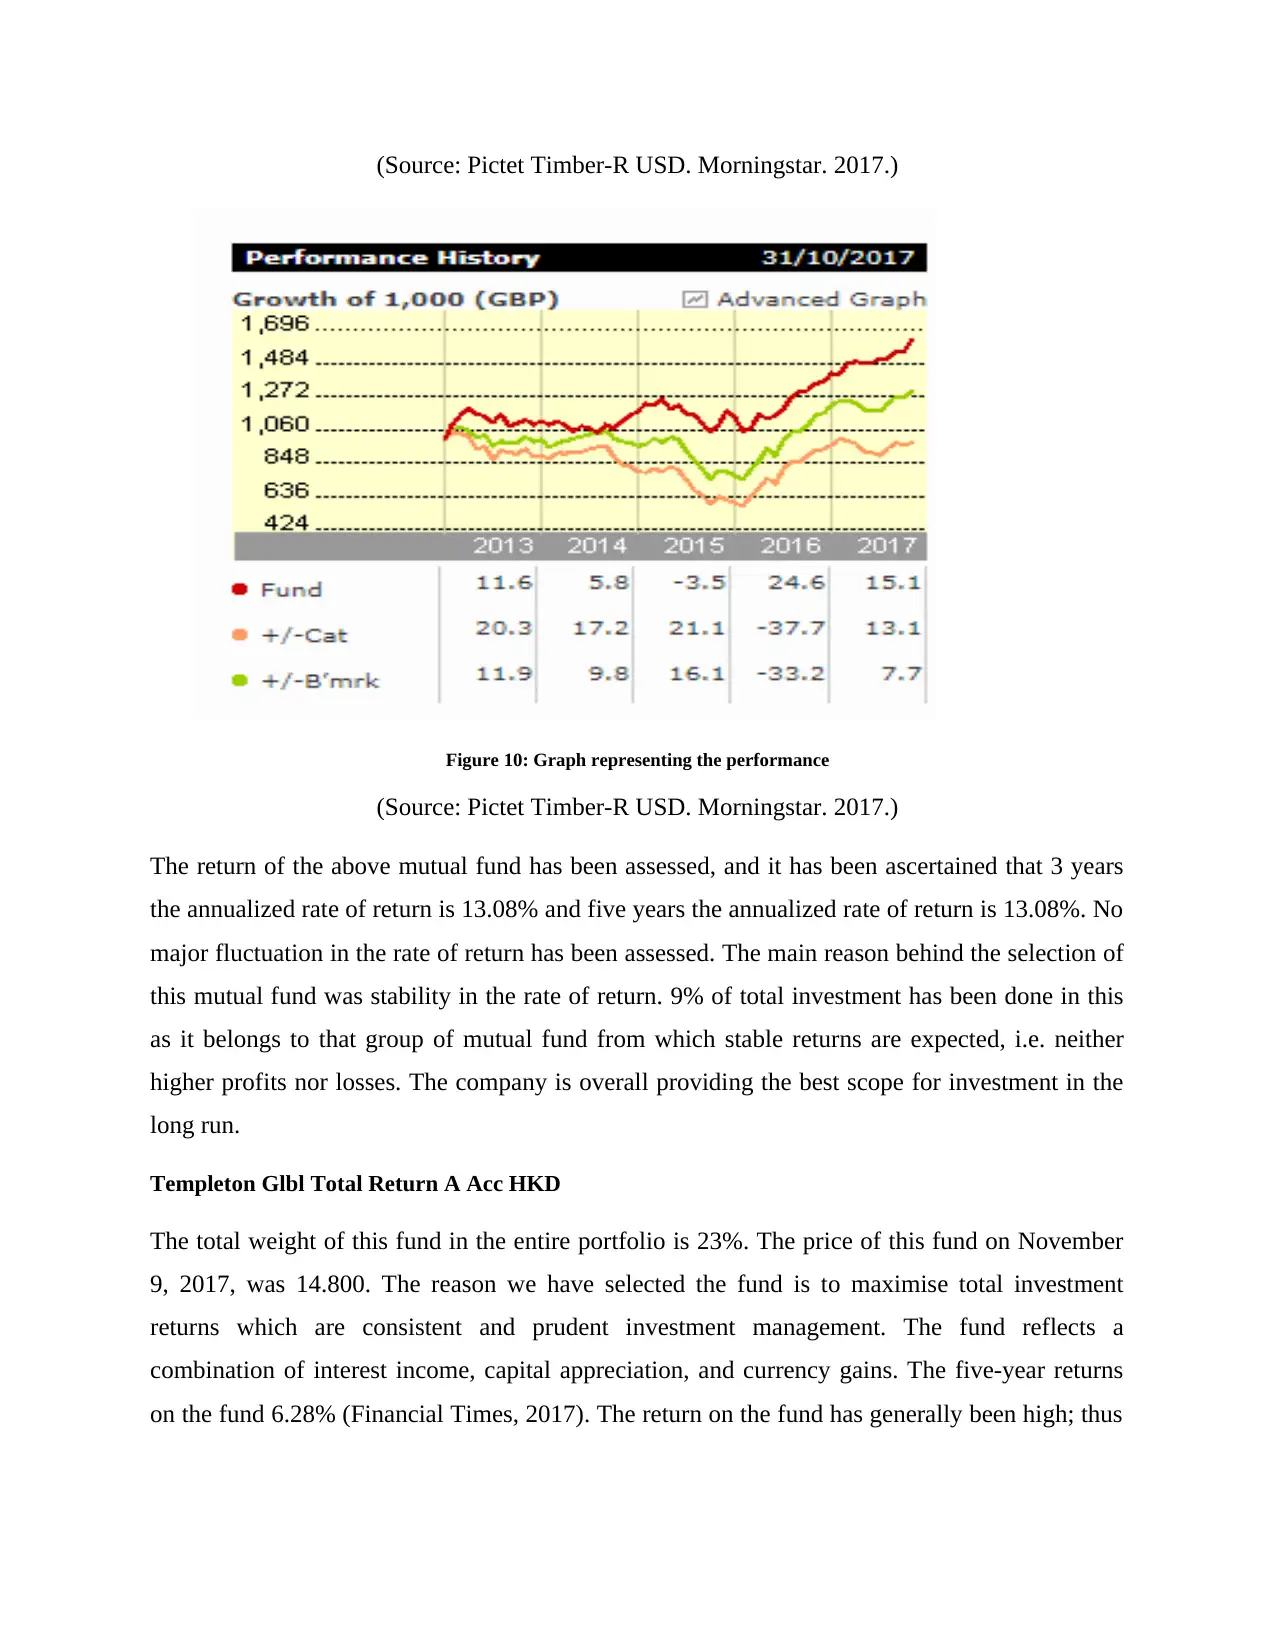
Figure 10: Graph representing the performance
(Source: Pictet Timber-R USD. Morningstar. 2017.)
The return of the above mutual fund has been assessed, and it has been ascertained that 3 years
the annualized rate of return is 13.08% and five years the annualized rate of return is 13.08%. No
major fluctuation in the rate of return has been assessed. The main reason behind the selection of
this mutual fund was stability in the rate of return. 9% of total investment has been done in this
as it belongs to that group of mutual fund from which stable returns are expected, i.e. neither
higher profits nor losses. The company is overall providing the best scope for investment in the
long run.
Templeton Glbl Total Return A Acc HKD
The total weight of this fund in the entire portfolio is 23%. The price of this fund on November
9, 2017, was 14.800. The reason we have selected the fund is to maximise total investment
returns which are consistent and prudent investment management. The fund reflects a
combination of interest income, capital appreciation, and currency gains. The five-year returns
on the fund 6.28% (Financial Times, 2017). The return on the fund has generally been high; thus
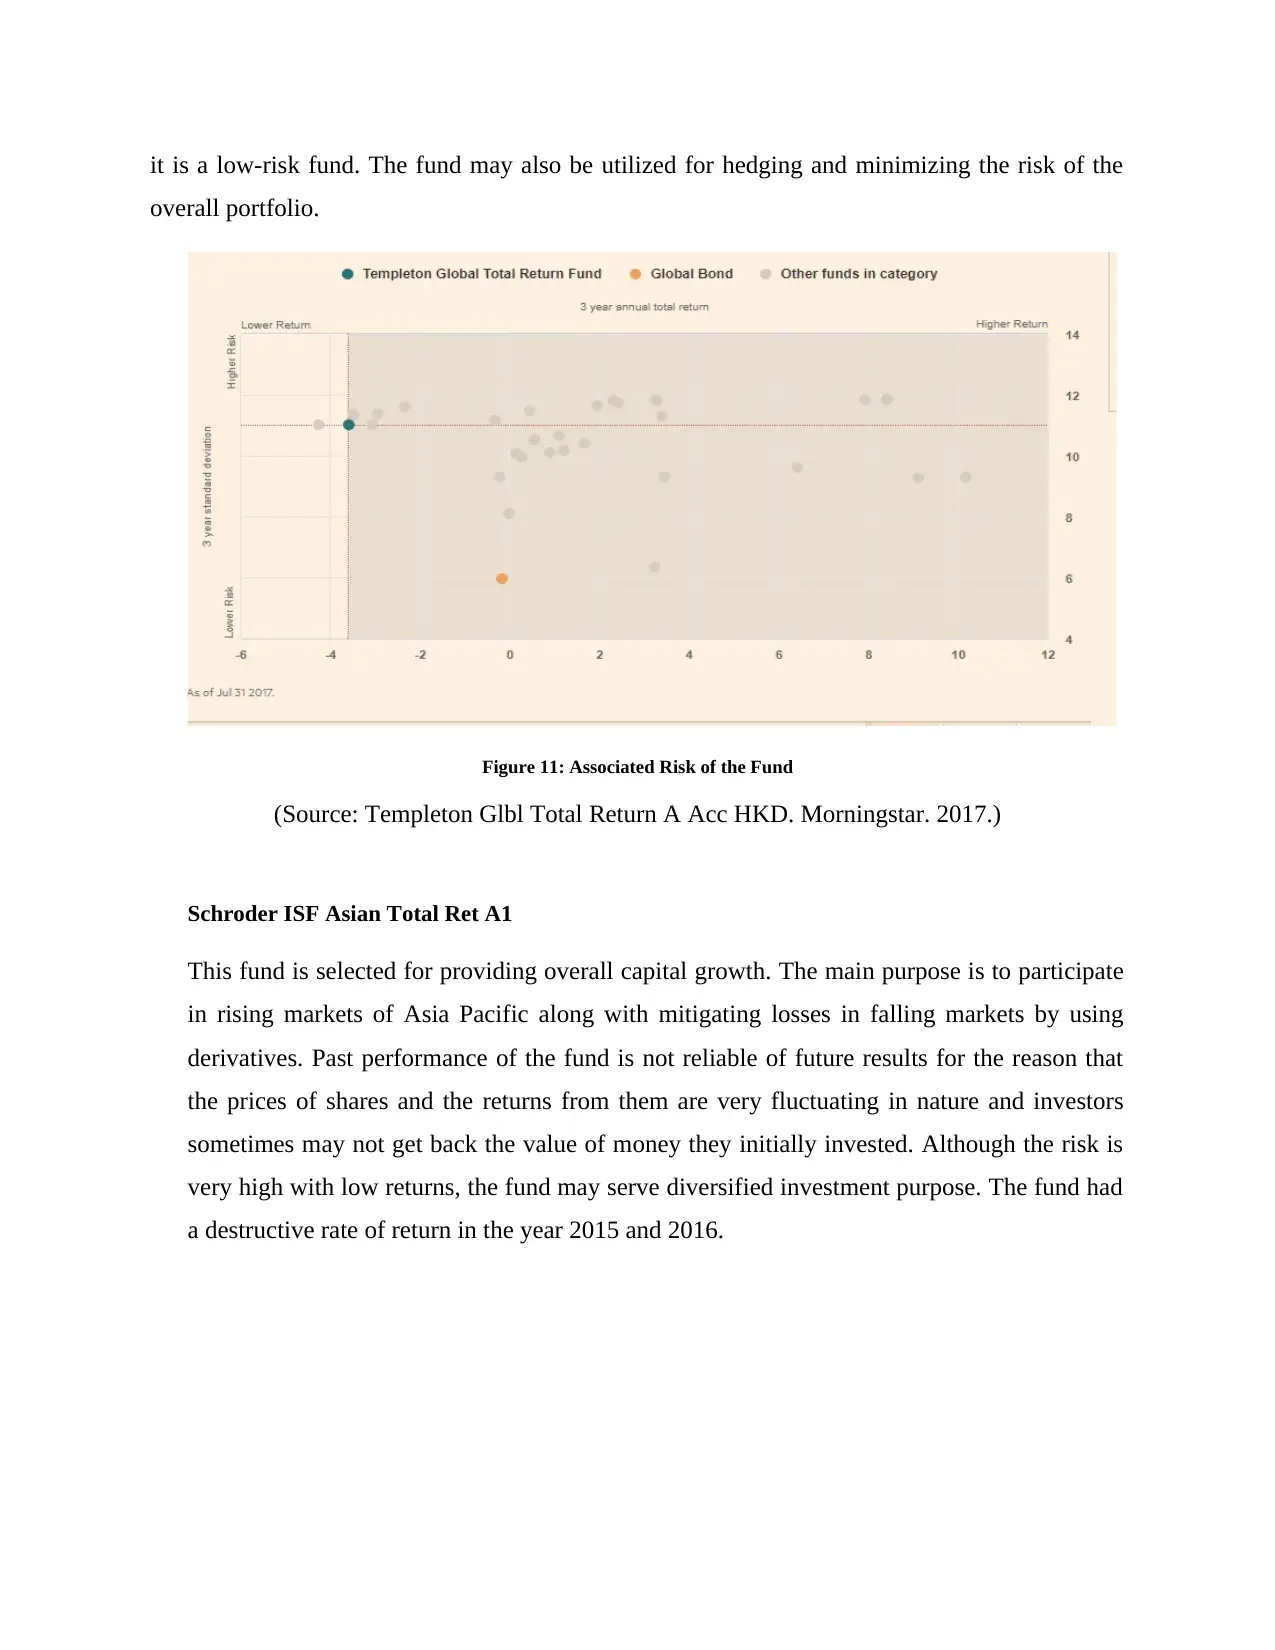
it is a low-risk fund. The fund may also be utilized for hedging and minimizing the risk of the
overall portfolio.
Figure 11: Associated Risk of the Fund
(Source: Templeton Glbl Total Return A Acc HKD. Morningstar. 2017.)
Schroder ISF Asian Total Ret A1
This fund is selected for providing overall capital growth. The main purpose is to participate
in rising markets of Asia Pacific along with mitigating losses in falling markets by using
derivatives. Past performance of the fund is not reliable of future results for the reason that
the prices of shares and the returns from them are very fluctuating in nature and investors
sometimes may not get back the value of money they initially invested. Although the risk is
very high with low returns, the fund may serve diversified investment purpose. The fund had
a destructive rate of return in the year 2015 and 2016.
Paraphrase This Document
Need a fresh take? Get an instant paraphrase of this document with our AI Paraphraser
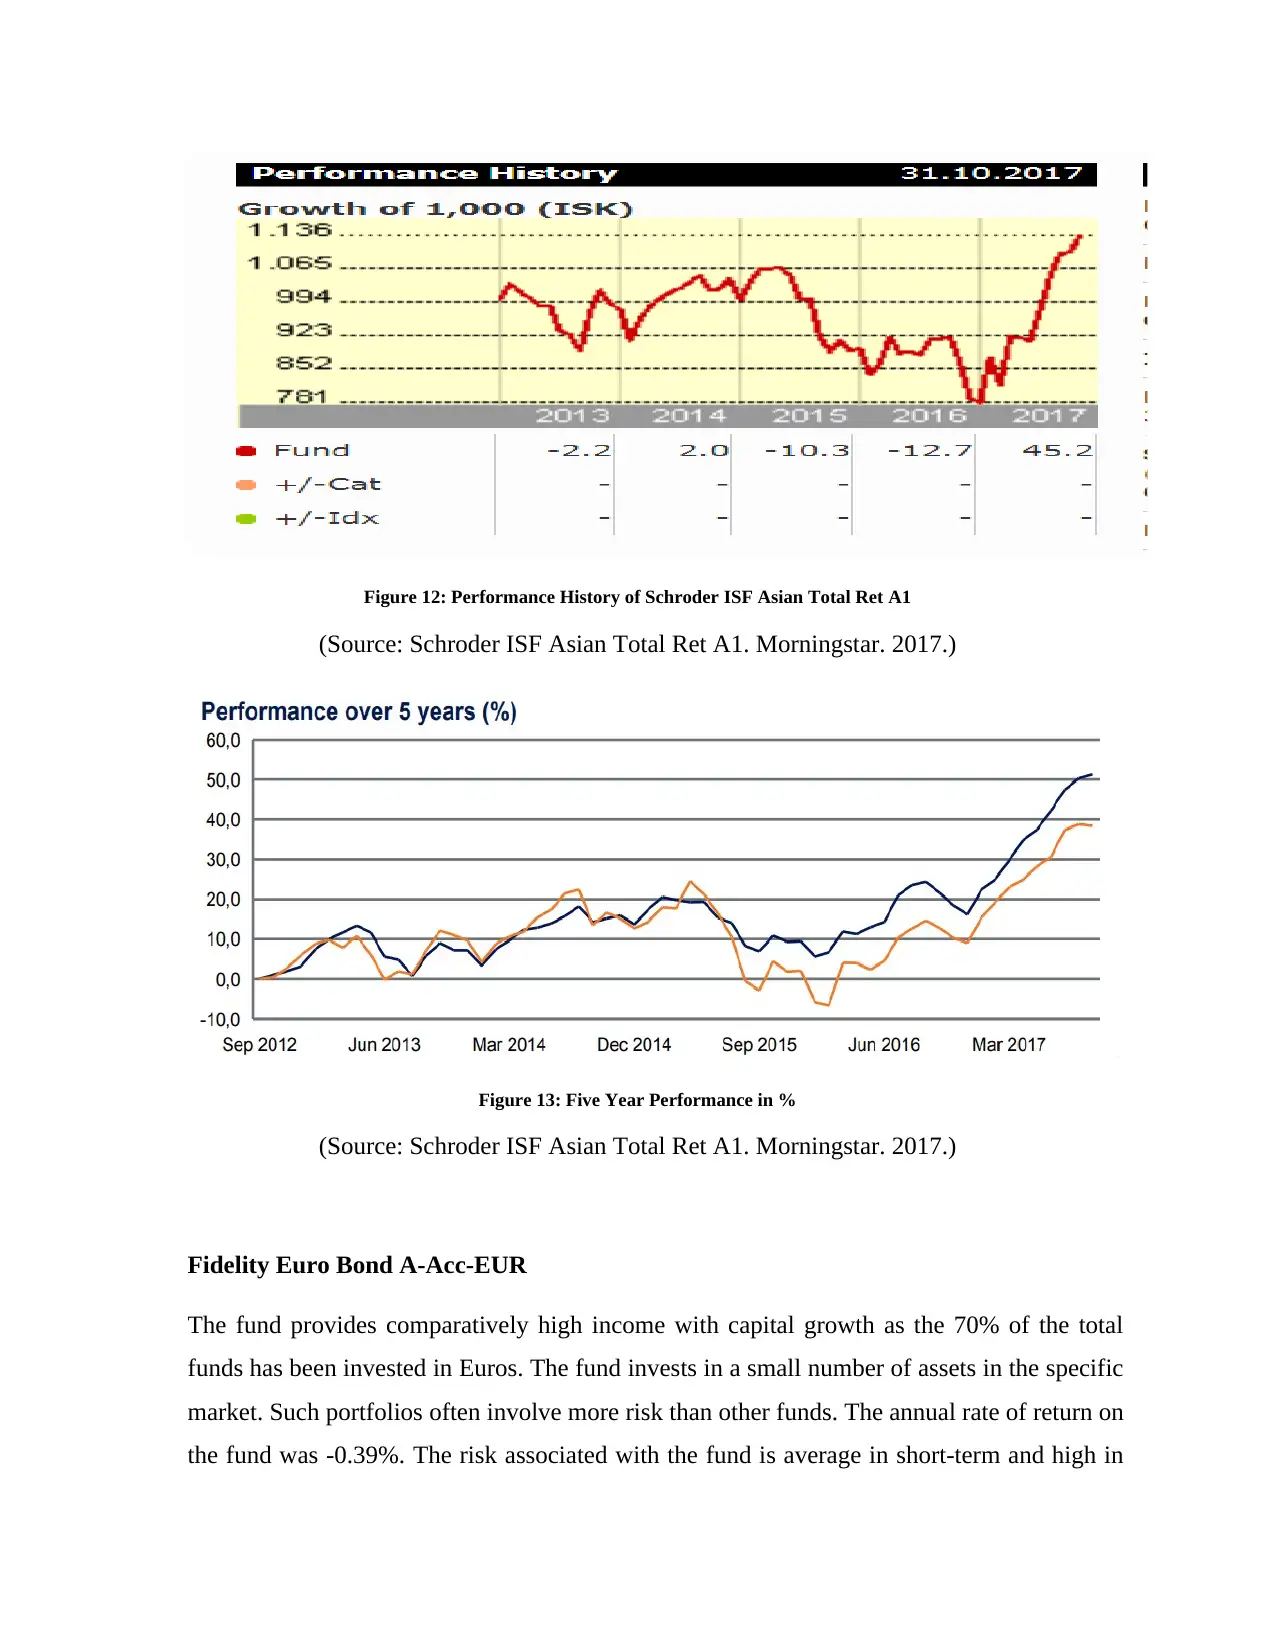
Figure 12: Performance History of Schroder ISF Asian Total Ret A1
(Source: Schroder ISF Asian Total Ret A1. Morningstar. 2017.)
Figure 13: Five Year Performance in %
(Source: Schroder ISF Asian Total Ret A1. Morningstar. 2017.)
Fidelity Euro Bond A-Acc-EUR
The fund provides comparatively high income with capital growth as the 70% of the total
funds has been invested in Euros. The fund invests in a small number of assets in the specific
market. Such portfolios often involve more risk than other funds. The annual rate of return on
the fund was -0.39%. The risk associated with the fund is average in short-term and high in
(Source: Schroder ISF Asian Total Ret A1. Morningstar. 2017.)
Figure 13: Five Year Performance in %
(Source: Schroder ISF Asian Total Ret A1. Morningstar. 2017.)
Fidelity Euro Bond A-Acc-EUR
The fund provides comparatively high income with capital growth as the 70% of the total
funds has been invested in Euros. The fund invests in a small number of assets in the specific
market. Such portfolios often involve more risk than other funds. The annual rate of return on
the fund was -0.39%. The risk associated with the fund is average in short-term and high in
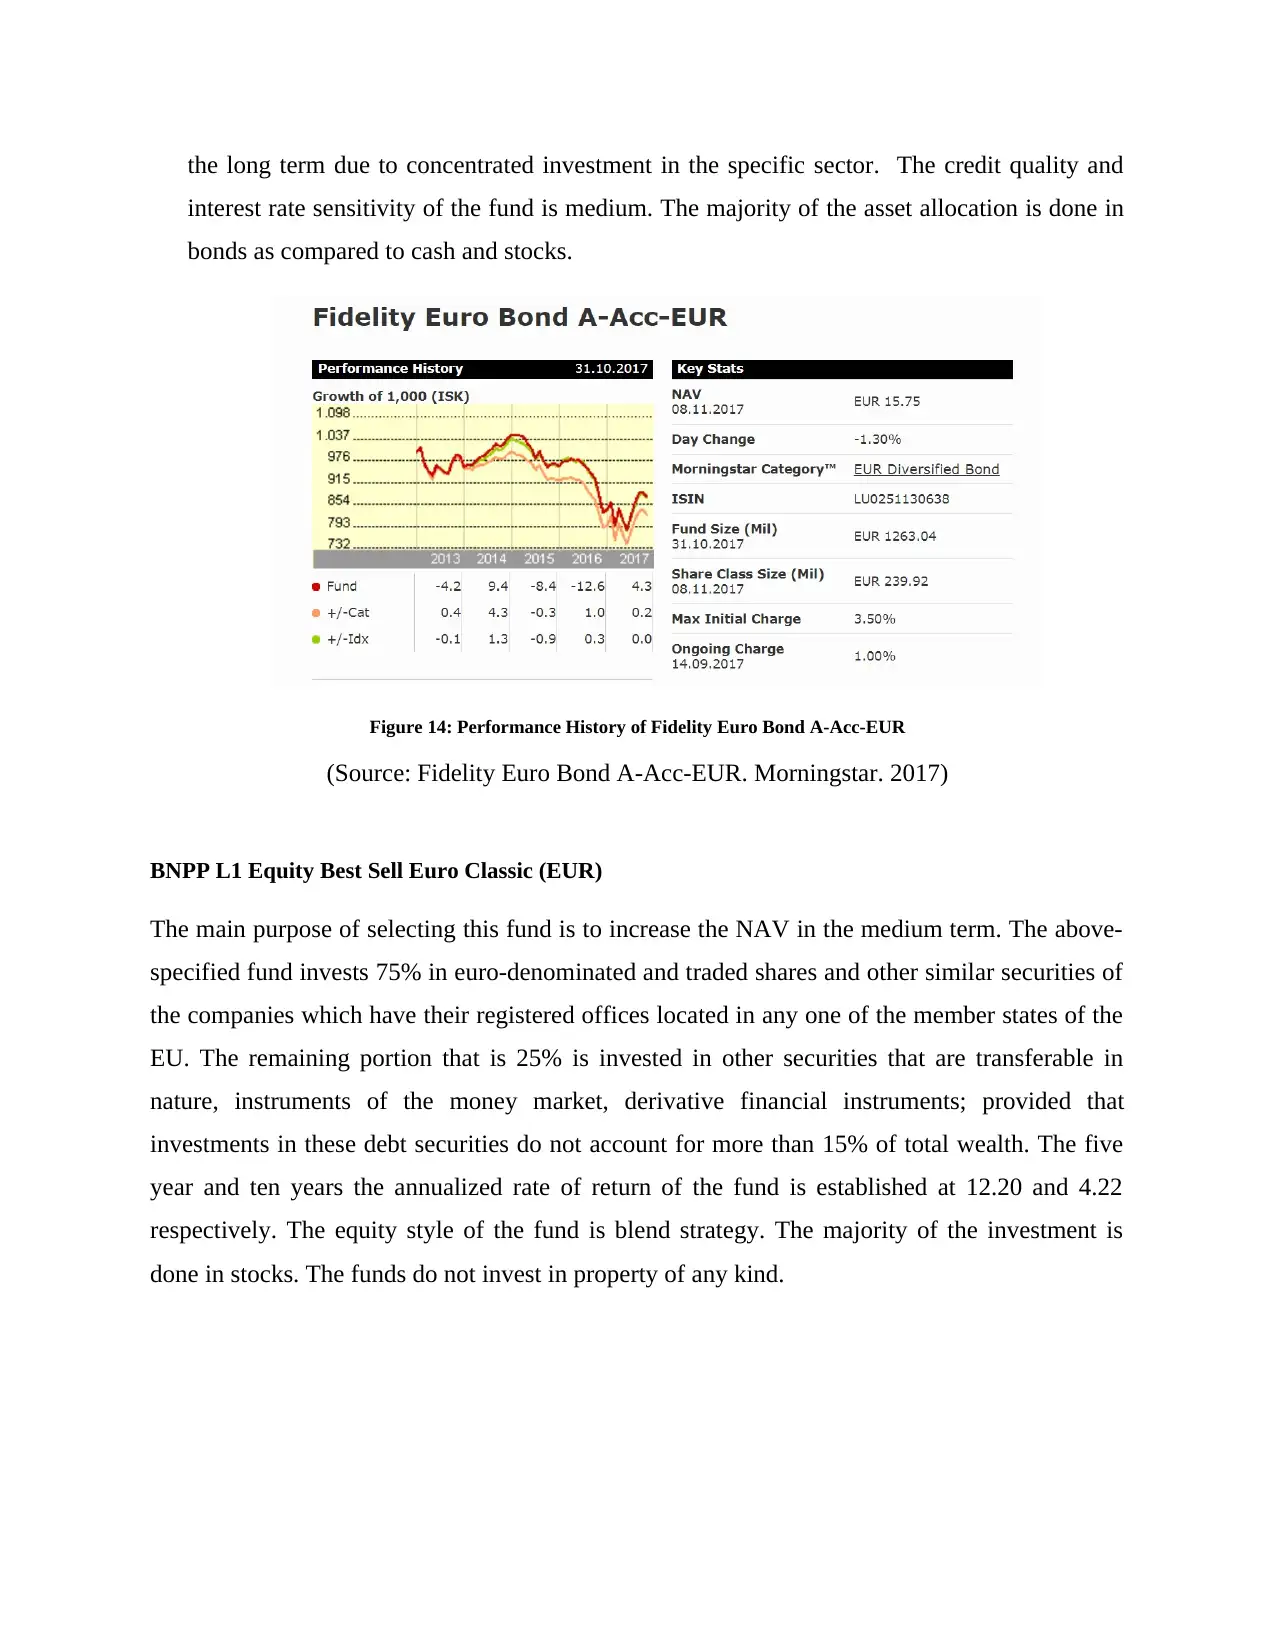
the long term due to concentrated investment in the specific sector. The credit quality and
interest rate sensitivity of the fund is medium. The majority of the asset allocation is done in
bonds as compared to cash and stocks.
Figure 14: Performance History of Fidelity Euro Bond A-Acc-EUR
(Source: Fidelity Euro Bond A-Acc-EUR. Morningstar. 2017)
BNPP L1 Equity Best Sell Euro Classic (EUR)
The main purpose of selecting this fund is to increase the NAV in the medium term. The above-
specified fund invests 75% in euro-denominated and traded shares and other similar securities of
the companies which have their registered offices located in any one of the member states of the
EU. The remaining portion that is 25% is invested in other securities that are transferable in
nature, instruments of the money market, derivative financial instruments; provided that
investments in these debt securities do not account for more than 15% of total wealth. The five
year and ten years the annualized rate of return of the fund is established at 12.20 and 4.22
respectively. The equity style of the fund is blend strategy. The majority of the investment is
done in stocks. The funds do not invest in property of any kind.
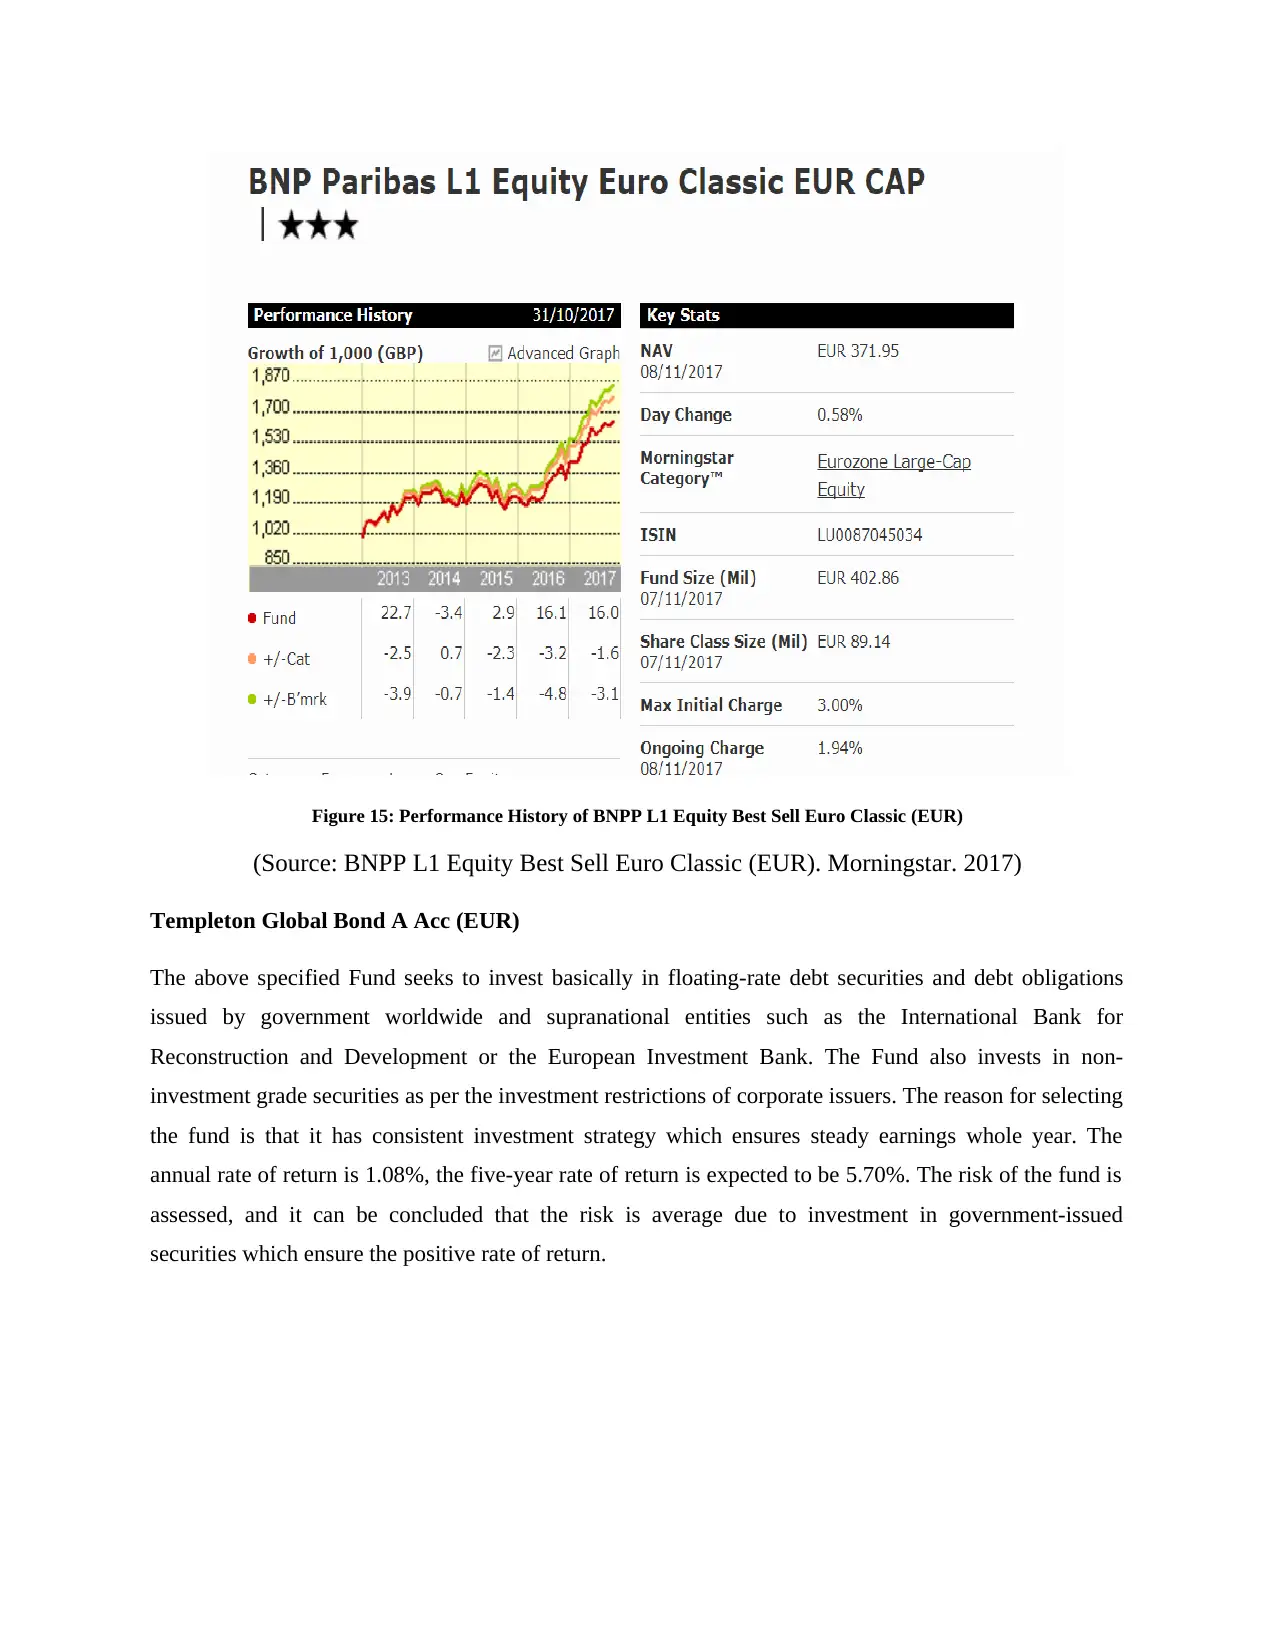
Figure 15: Performance History of BNPP L1 Equity Best Sell Euro Classic (EUR)
(Source: BNPP L1 Equity Best Sell Euro Classic (EUR). Morningstar. 2017)
Templeton Global Bond A Acc (EUR)
The above specified Fund seeks to invest basically in floating-rate debt securities and debt obligations
issued by government worldwide and supranational entities such as the International Bank for
Reconstruction and Development or the European Investment Bank. The Fund also invests in non-
investment grade securities as per the investment restrictions of corporate issuers. The reason for selecting
the fund is that it has consistent investment strategy which ensures steady earnings whole year. The
annual rate of return is 1.08%, the five-year rate of return is expected to be 5.70%. The risk of the fund is
assessed, and it can be concluded that the risk is average due to investment in government-issued
securities which ensure the positive rate of return.
Secure Best Marks with AI Grader
Need help grading? Try our AI Grader for instant feedback on your assignments.
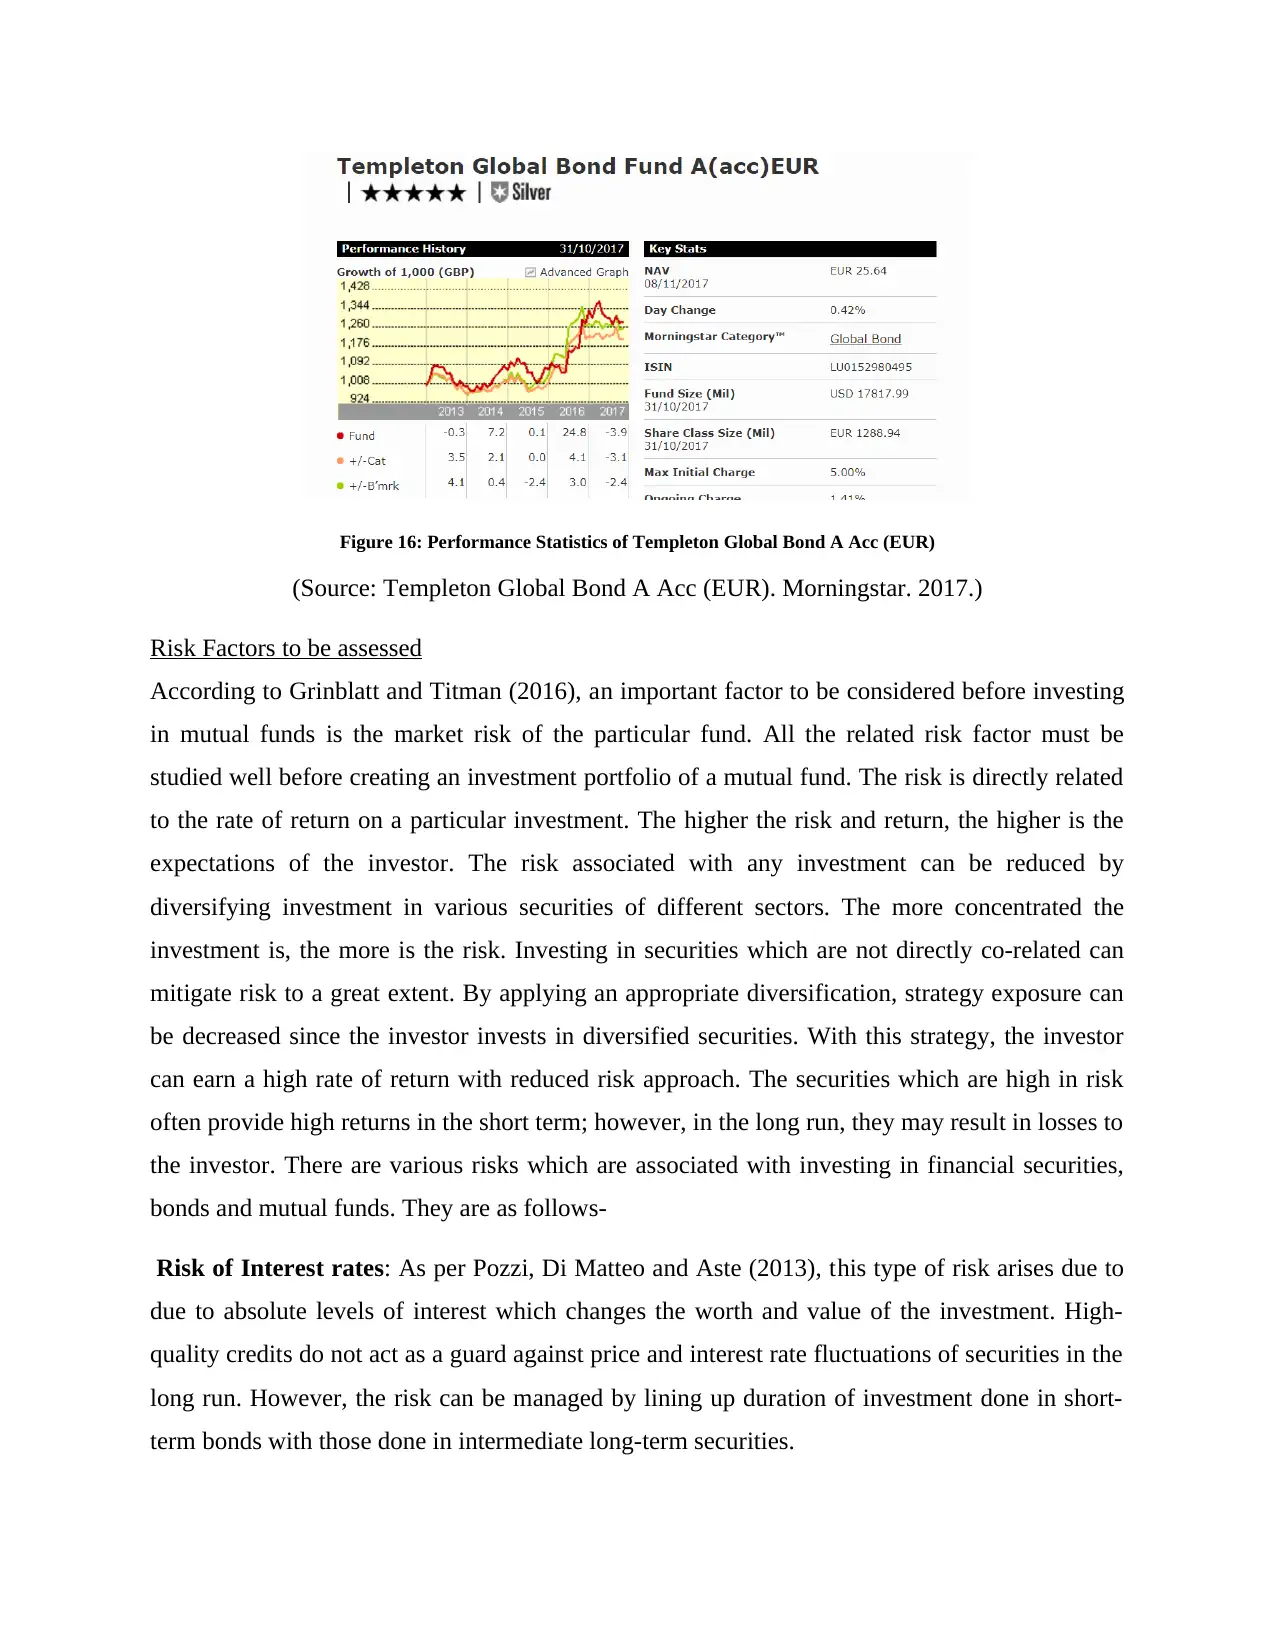
Figure 16: Performance Statistics of Templeton Global Bond A Acc (EUR)
(Source: Templeton Global Bond A Acc (EUR). Morningstar. 2017.)
Risk Factors to be assessed
According to Grinblatt and Titman (2016), an important factor to be considered before investing
in mutual funds is the market risk of the particular fund. All the related risk factor must be
studied well before creating an investment portfolio of a mutual fund. The risk is directly related
to the rate of return on a particular investment. The higher the risk and return, the higher is the
expectations of the investor. The risk associated with any investment can be reduced by
diversifying investment in various securities of different sectors. The more concentrated the
investment is, the more is the risk. Investing in securities which are not directly co-related can
mitigate risk to a great extent. By applying an appropriate diversification, strategy exposure can
be decreased since the investor invests in diversified securities. With this strategy, the investor
can earn a high rate of return with reduced risk approach. The securities which are high in risk
often provide high returns in the short term; however, in the long run, they may result in losses to
the investor. There are various risks which are associated with investing in financial securities,
bonds and mutual funds. They are as follows-
Risk of Interest rates: As per Pozzi, Di Matteo and Aste (2013), this type of risk arises due to
due to absolute levels of interest which changes the worth and value of the investment. High-
quality credits do not act as a guard against price and interest rate fluctuations of securities in the
long run. However, the risk can be managed by lining up duration of investment done in short-
term bonds with those done in intermediate long-term securities.
Currency fluctuation Risk: this type of risk is associated with fluctuation which occurs in the
value of U.S. dollar against other currencies. According to the words of Gitman and et al.
(2015), this fluctuation affects the return on foreign stock investment. This risk cannot be fully
eliminated but can be reduced through limiting investment exposure in foreign stock markets.
However, this rule does not apply to economies which are prospering by its very nature. Hence,
funds can be invested in companies of U.S. which have international operations which could be
hedged against foreign currency exposure.
Under-managed investment portfolio risk: this type of risk arises when the investment in
securities is made without proper analysis regarding the ratings of risks and return about the
funds and related investment company. As per Wilson and Testoni (2014), this occurs when the
investor invests all available funds in securities of the same kind; as a result, the investor has to
bear the resultant fall in a specific security. Since Growth funds rise faster in comparison to the
economy, any investment done in growth funds is an out- of- favour decision as it will lead to the
higher trading cost of the same and the investor will eventually incur losses.
QUESTION-3
Bond can be specified as a debt investment in which an investor provides money as a loan to an
entity either corporate or government. The entity borrows the same for a definite period of time
at variable or fixed rate of interest. Bonds are treated as investing in debt is safer in comparison
with investing in equity. The main advantage of investing in bond is that even in worsen case
such as bankruptcy, creditors receive their money back, and shareholders lose their total amount
invested.
Gazprom’s Eurobonds
Gazprom’s Eurobonds have been selected for the purpose of investment as they have been issued
under the Euro Medium Term Note program. As the funds which have been raised by the
company are applied to raise funds for Gazprom on the international capital market; the
advantage of global exposure will be availed. The investment has been made with an objective of
attaining long-term profits. Gazpron has presently made an effort to come back and regains its
position through a three-year bond in which yield of 4.625% is expected. Its present rate of yield
is 3.22 percent. The investment has been after assessing the information available on online
sources as well as the previous image of the company. Other economic variants have also been
assessed to mitigate the variants regarding risk available in the investment.
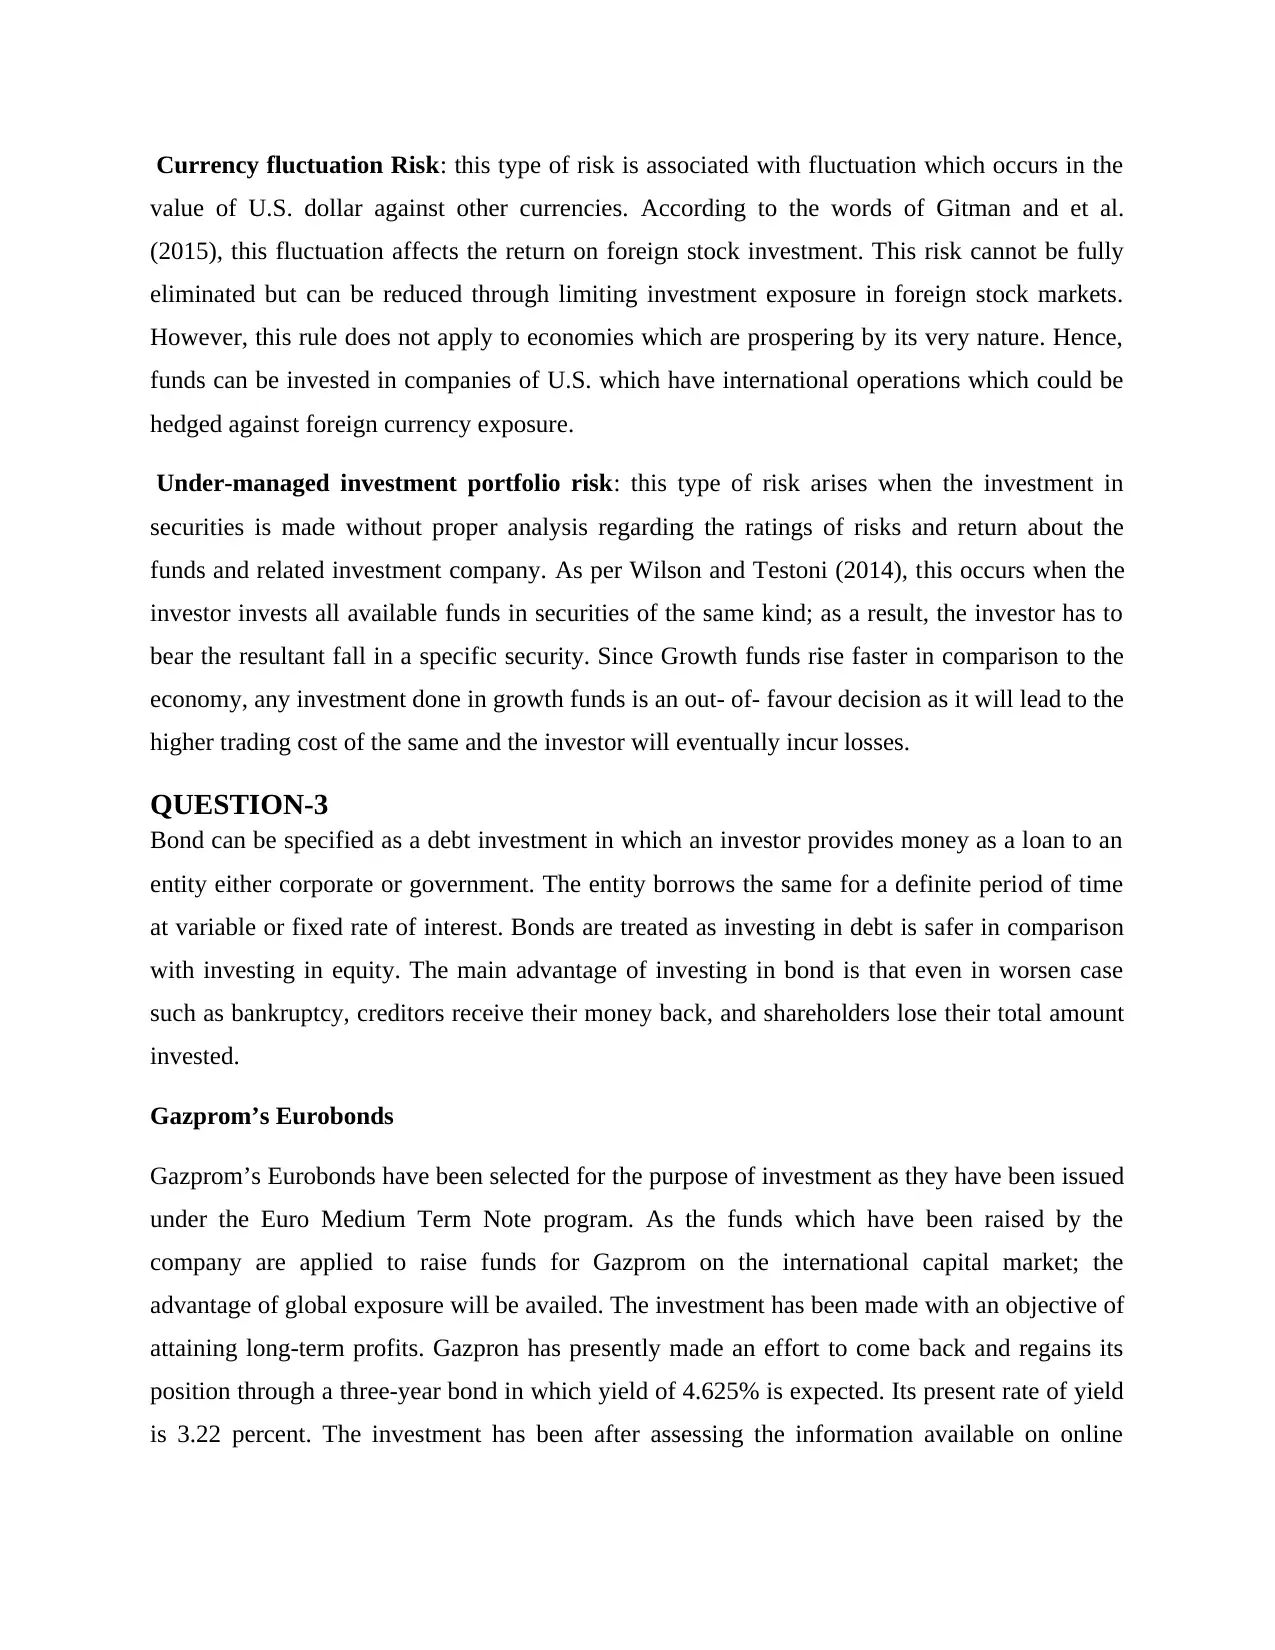
Figure 17: Regression Analysis of Gazprom’s Eurobonds
(Source: Gazprom’s Eurobonds issued under the Euro Medium Term Note (EMTN) Program.
Bonds. 2017.)
The positive outlook reflects the adequate debt maturity profile will be maintained by the
company. Previously, the bonds have shown appropriate financial performance, and the same is
being continually monitored in order to make a decision relating to selling the bonds. The main
areas of concern relating to the company are declining production level at the company key
mature field. Another significant area which will affect the performance is company’s relatively
high transport infrastructure construction cost. As the probability of default risk is negligible in
this investment, it is expected that appropriate returns will be earned through this investment.
assessed to mitigate the variants regarding risk available in the investment.
Figure 17: Regression Analysis of Gazprom’s Eurobonds
(Source: Gazprom’s Eurobonds issued under the Euro Medium Term Note (EMTN) Program.
Bonds. 2017.)
The positive outlook reflects the adequate debt maturity profile will be maintained by the
company. Previously, the bonds have shown appropriate financial performance, and the same is
being continually monitored in order to make a decision relating to selling the bonds. The main
areas of concern relating to the company are declining production level at the company key
mature field. Another significant area which will affect the performance is company’s relatively
high transport infrastructure construction cost. As the probability of default risk is negligible in
this investment, it is expected that appropriate returns will be earned through this investment.
Paraphrase This Document
Need a fresh take? Get an instant paraphrase of this document with our AI Paraphraser
REFERENCES
Books and journals
Aaronson, S.A. and et al. 2017. Handbook on assessment of labour provisions in trade and
investment arrangements. Studies on Growth with Equity.
Almumani, M.A. 2014. Determinants of equity share prices of the listed banks in Amman stock
exchange: Quantitative approach. International Journal of Business and Social Science, 5(1).
Ashraf, Q., Gershman, B. and Howitt, P. 2016. How inflation affects macroeconomic
performance: an agent-based computational investigation. Macroeconomic Dynamics. 20(2),
Pp.558-581.
Basak, S. and Makarov, D. 2014. Strategic asset allocation in money management. The Journal
of Finance. 69(1), Pp.179-217.
Benmelech, E. 2017. An Evaluation of the Different Approaches and Methodologies for
Evaluating Investment Holding Companies' Credit Ratings.
Bodie, Z. 2013. Investments. McGraw-Hill.
Gitman, L.J. and et al. 2015. Fundamentals of investing. Pearson Higher Education AU.
Grinblatt, M. and Titman, S. 2016. Financial markets & corporate strategy.
Mankiw, N.G. 2014. Principles of macroeconomics. Cengage Learning.
McNeil, A.J., Frey, R. and Embrechts, P. 2015. Quantitative risk management: Concepts,
techniques and tools. Princeton university press.
Michalski, G. 2014. Factoring and the firm value.
Pozzi, F. Di Matteo, T. and Aste, T. 2013. Spread of risk across financial markets: better to
invest in the peripheries. Scientific reports, 3.
Segal, G., Shaliastovich, I. and Yaron, A., 2015. Good and bad uncertainty: Macroeconomic and
financial market implications. Journal of Financial Economics. 117(2), Pp.369-397.
Wilson, K.E. and Testoni, M. 2014. Improving the role of equity crowdfunding in Europe's
capital markets.
Online
Alphabet Inc C GOOG. Morning star rating. 2017. [Online]. Available through
<http://financials.morningstar.com/income-tatement/is.html?t=GOOG®ion=usa&culture=en-
US >. [Accessed on 10th November 2017].
Alphabet Inc C GOOG. Morningstar rating. Financials. 2017. [Online]. Available through <
http://financials.morningstar.com/ratios/r.html?t=GOOG®ion=usa&culture=en-US>.
[Accessed on 10th November 2017].
Alphabet Inc C GOOG. Morningstar rating. Income Statement. 2017. [Online]. Available
through < http://financials.morningstar.com/income-statement/is.html?
t=GOOG®ion=usa&culture=en-US>. [Accessed on 10th November 2017].
BNPP L1 Equity Best Sell Euro Classic (EUR). Morningstar. 2017. [Online]. Available through
<http://www.morningstar.co.uk/uk/funds/snapshot/snapshot.aspx?id=F0GBR04B96>. [Accessed
on 10th November 2017].
Fidelity Euro Bond A-Acc-EUR. Morningstar. 2017. [Online]. Available through <>. [Accessed
on 10th November 2017].
Ford Motors Company. Financial. 2017. [Online]. Available through <
http://financials.morningstar.com/ratios/r.html?t=F>. [Accessed on 10th November 2017].
Ford Motors Company. Total Returns. 2017. [Online]. Available through <
http://financials.morningstar.com/ratios/r.html?t=F>. [Accessed on 10th November 2017].
Ford Motors. 2017. [Online]. Available through < http://shareholder.ford.com/stock-
information/stock-performance >. [Accessed on 10th November 2017].
Gazprom’s Eurobonds issued under the Euro Medium Term Note (EMTN) Program. Bonds.
2017. [Online]. Available through < http://www.gazprom.com/investors/creditor-relations/bonds/
>. [Accessed on 10th November 2017].
Google Inc. 2017. [Online]. Available through <http://Google.com>. [Accessed on 10th
November 2017].
Pictet Timber-R USD. Morningstar. 2017. [Online]. Available through <
http://www.morningstar.is/is/funds/snapshot/snapshot.aspx?id=F000000NWV&tab=2>.
[Accessed on 10th November 2017].
Schroder ISF Asian Total Ret A1. Morningstar. 2017. [Online]. Available through <
http://www.morningstar.is/is/funds/snapshot/snapshot.aspx?id=F000000NWV&tab=2>.
[Accessed on 10th November 2017].
Templeton Glbl Total Return A Acc HKD. Morningstar. 2017. [Online]. Available through <
http://www.morningstar.is/is/funds/snapshot/snapshot.aspx?id=F000000NWV&tab=2>.
[Accessed on 10th November 2017].
Templeton Global Bond A Acc (EUR). Morningstar. 2017. [Online]. Available through <
http://www.morningstar.co.uk/uk/funds/snapshot/snapshot.aspx?id=F0GBR04O50&tab=2>.
[Accessed on 10th November 2017].
1 out of 27

Your All-in-One AI-Powered Toolkit for Academic Success.
+13062052269
info@desklib.com
Available 24*7 on WhatsApp / Email
![[object Object]](/_next/static/media/star-bottom.7253800d.svg)
Unlock your academic potential
© 2024 | Zucol Services PVT LTD | All rights reserved.