Isolation of Mitochondria and Analysis of Subcellular Fractions
VerifiedAdded on 2022/09/15
|13
|2841
|47
AI Summary
Contribute Materials
Your contribution can guide someone’s learning journey. Share your
documents today.
SLE206 CELL BIOLOGY 1
Isolation of Mitochondria and Analysis of Subcellular Fractions.
By Student’s Name
Course + Code
Class
Institution
Date
Isolation of Mitochondria and Analysis of Subcellular Fractions.
By Student’s Name
Course + Code
Class
Institution
Date
Secure Best Marks with AI Grader
Need help grading? Try our AI Grader for instant feedback on your assignments.
SLE206 CELL BIOLOGY 2
Introduction
Mitochondria are eukaryotic cell organelles that are known for harboring pathways in
ATP synthesis through phosphorylation and tricarboxylic acid cycles(Schrepfer and
Scorrano, 2016). Mitochondria has two membranes which contain unusual lipid cardiolipin
and very rich in proteins. The outer membrane has porins which allow molecules exchange
between the cytoplasm and intermediate space(Rizzuto et al., 2012). However, the inner
membrane is completely impermeable even to small molecules except for water carbon IV
oxide and oxygen. In addition, the inner membranes allow some other molecules such as
pyruvate and succinate(Ortiz-Espín et al., 2017). There are various transporters in the inner
membranes which ensure import and exports of crucial metaborates. The major function of
the inner membranes is to aid the transport of respiratory chain complexes, ATP synthase,
and other enzymes. The inner part of the inner membrane on the side of the matrix contains
enzymes for oxidative phosphorylation and electron transport chains(Nunnari and
Suomalainen, 2012). The matrix is rich in proteins and contains all the citric acid cycle
enzymes except the succinate dehydrogenase.
Isolation of mitochondria is crucial in the modern field of medicine and research in
essence that it helps in the understanding of structure and function of the cells as well as
cancer and metabolic diseases(Schmitt and Zischka, 2018). For instance, cancer cells exhibit
several mitochondrial dysfunctions including increase transmembrane potential, change in
energy metabolism and elevated ROS generation. Therefore, these changes provide scientists
with referential target cancer cells mitochondria hence improving the selectivity of various
therapies(Dimauro et al., 2012). Separation of cellular components is usually done using
subcellular fractionation which normally uses one or properties of each organelle or cellular
compartment including buoyancy density, shape and size, and surface change density basing
on differential centrifugation in media of high viscosity(Schrepfer and Scorrano, 2016). The
SLE206 CELL BIOLOGY 3
isolation of mitochondria from subcellular structures using differential centrifugation
methods normally relies on various elements(Dimauro et al., 2012). These include
mechanical rapturing of cells, low-speed differential centrifugation to remove large
organelles structures and debris and finally isolating mitochondria using higher speeds to
isolate mitochondria(Schmitt and Zischka, 2018). To determine which fraction has the
highest concentration of mitochondria or whether the process of the isolation was successful,
a specific marker for mitochondria succinate dehydrogenase activity is tested(Azimzadeh et
al., 2016).
Aims of the study.
This practical study seeks to isolate mitochondria fractions from the liver and carry out
differential centrifugation on the liver extracts. Besides, the succinate hydrogen activity of all
extract isolated from the liver will be evaluated to determine the concentration of
mitochondria in various fractions.
Methods.
The experiment procedure will consist of three major steps which include subcellular
fractionation to isolate mitochondria from liver cell lyse, BCA assay and proteins calculation
and finally the confirmation of mitochondria fractionation using the SDH essay. The methods
and procedures of the experiments are explained below.
Step1; Subcellular fractionation of mitochondria from the liver.
Prelab preparation sample prepared by a technical staff.
During the pre-preparation phase, technical staff will obtain samples of fresh liver pieces
weighing around 500 mg and ad equivalent volumes of cry-storage solution. The cell tissues
will then be snap-frozen and store in liquid nitrogen for about three months. During the day
SLE206 CELL BIOLOGY 4
of the experiment, the thawing medium will be warmed using 45 decrees water bath for
thawing frozen tissues. After that, the frozen tissues will be thawed by adding 10um for every
2.5mg of tissue. The technical staff will then dice 2mm pieces into a 50ml conical centrifuge
tube containing an isolation buffer and proteins inhibitors. Samples will be homogenized at
maximum speed and be strafer to 2ml crew cap microfuge tubes for the procedure.
Actual Experiment Procedure
During the experiment, five sterile 2ml screwcaps will be prepared by labeling them
WCL, SN1, SN2, SN3, and Mito on the lids. The screwcaps will also have student initials at
the sides and practical sessions to allow more accurate labeling and stored into the ice. Put
the cell lysate measuring 100ul into tube labeled WCL and store into ice. Pellet the cell debris
in the homogenate at 1000x for around ten minutes at 4 degrees Celcius. After that, the
supernate obtained should be transferred to the tube labeled Mito with a 1 mil filter tip and
the tube with cell pallets be discarded. The supernate in tube labeled Mito should also be
centrifuged for 10 min at 1000xg at a similar temperature and be transferred to tube labeled
SN1. The supernate in SN1 will then be resuspended as demonstrated by the instructor to
prevent cell clamps remains at the base. An additional 1000ul of the isolation buffer should
then be added, mix well and centrifuged at 12,000xg in the same duration and time as above.
Pipette the supernatant in SN! To tube labeled SN2, resuspend and add another 1000ul of
isolation buffer. Repeat the procedure as in SN1 and pipette to the tube labeled SN3. After
that resuspend the pellets in SN3 with 400ul of the isolation buffer, mix and store in the ice.
Store the above sample at -80 decree celsius until the next step of the experiment procedure.
Step 2; BCA Essay and proteins calculations.
During this step, use table 1 below to prepare protein standards in sterile 1.5ml
microcapsule tubes and observe. As demonstrated in table 2, transfer 25ul of each standard in
Secure Best Marks with AI Grader
Need help grading? Try our AI Grader for instant feedback on your assignments.
SLE206 CELL BIOLOGY 5
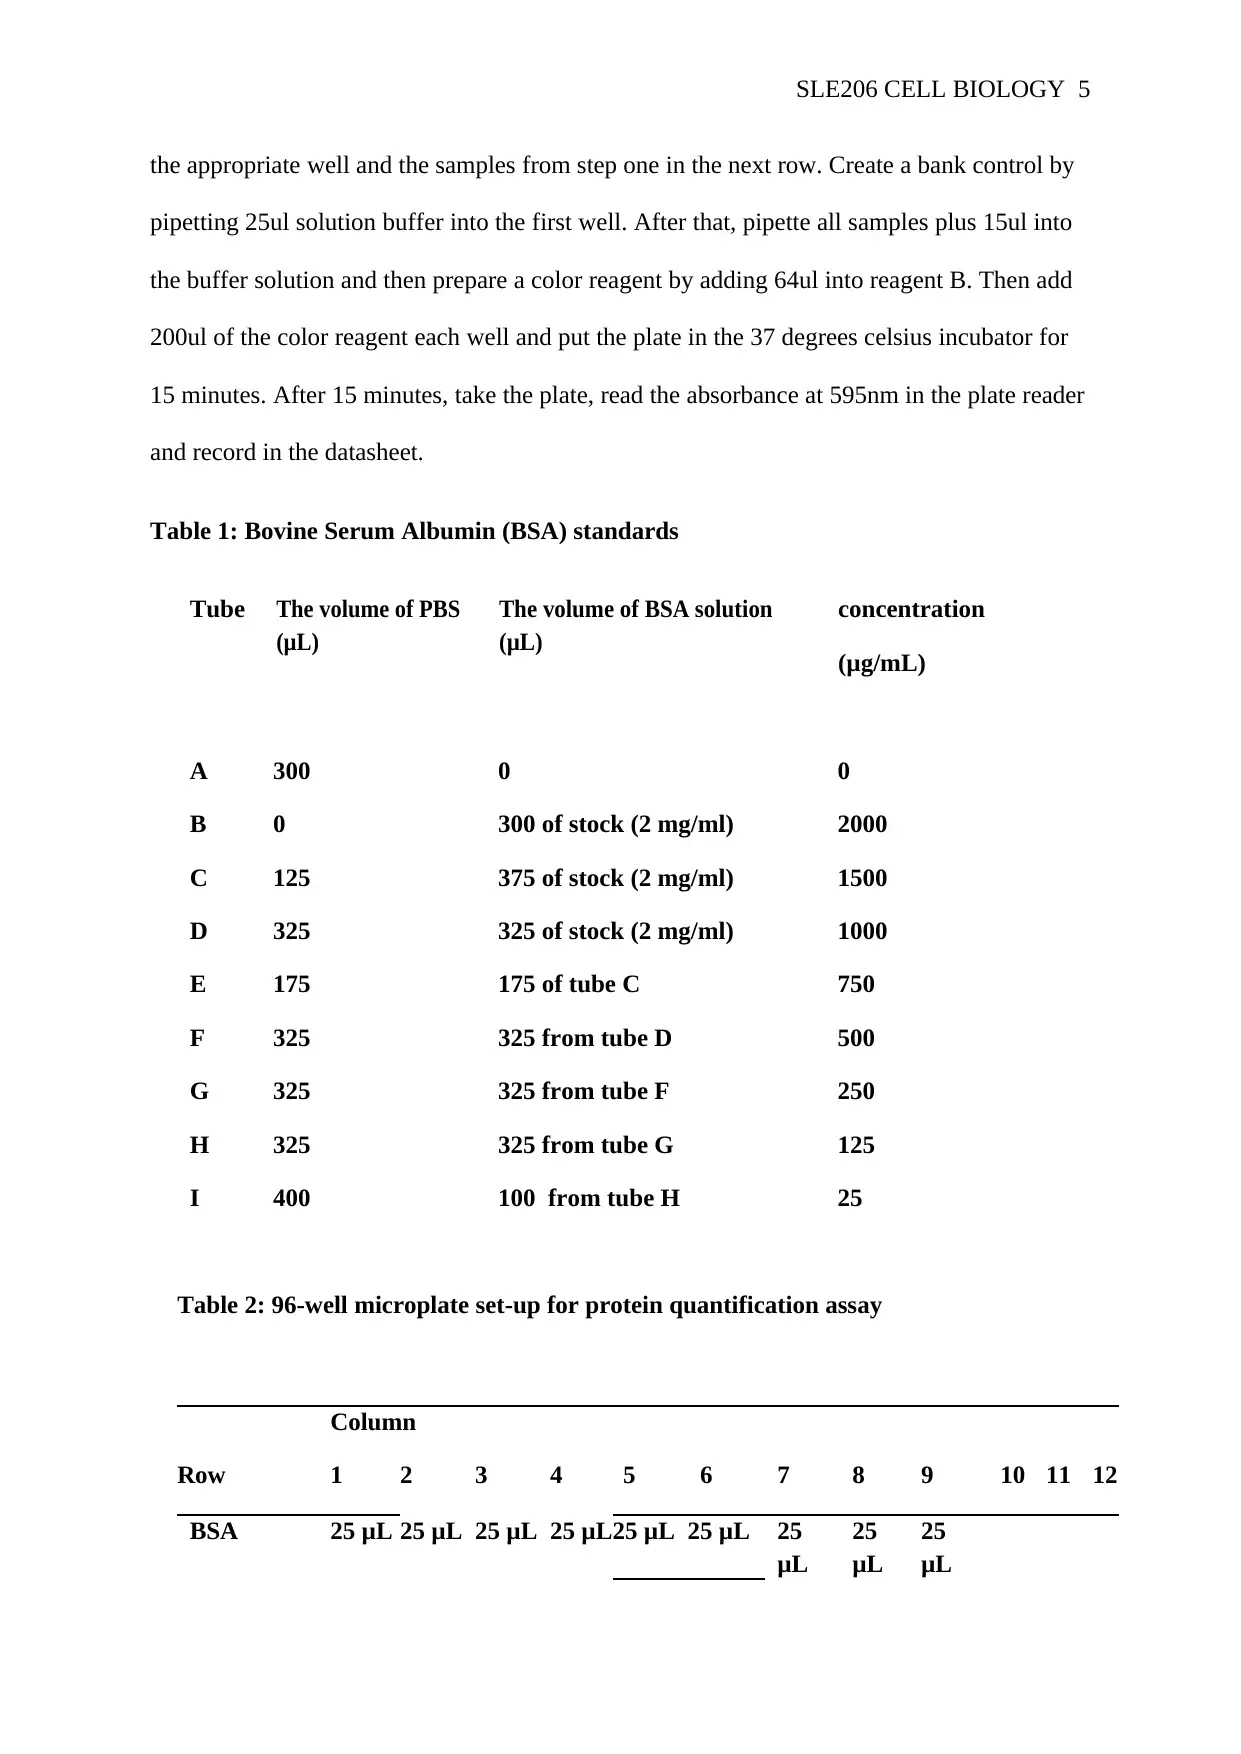
the appropriate well and the samples from step one in the next row. Create a bank control by
pipetting 25ul solution buffer into the first well. After that, pipette all samples plus 15ul into
the buffer solution and then prepare a color reagent by adding 64ul into reagent B. Then add
200ul of the color reagent each well and put the plate in the 37 degrees celsius incubator for
15 minutes. After 15 minutes, take the plate, read the absorbance at 595nm in the plate reader
and record in the datasheet.
Table 1: Bovine Serum Albumin (BSA) standards
Tube The volume of PBS
(μL)
The volume of BSA solution
(μL)
concentration
(μg/mL)
A 300 0 0
B 0 300 of stock (2 mg/ml) 2000
C 125 375 of stock (2 mg/ml) 1500
D 325 325 of stock (2 mg/ml) 1000
E 175 175 of tube C 750
F 325 325 from tube D 500
G 325 325 from tube F 250
H 325 325 from tube G 125
I 400 100 from tube H 25
Table 2: 96-well microplate set-up for protein quantification assay
Column
Row 1 2 3 4 5 6 7 8 9 10 11 12
BSA 25 μL 25 μL 25 μL 25 μL25 μL 25 μL 25
μL
25
μL
25
μL
SLE206 CELL BIOLOGY 6
Standards Tube
A
Tube
B
Tube
C
Tube
D
Tube
E
Tube
F
Tube
G
Tube
H
Tube
I
Subcellular
fractions
25 μL
Isolati
on
n
buffer
10 μL
WCL
plus
15 μL
Isol.
buffer
10 μL
SN1
plus
15 μL
Isol.
buffer
10 μL
SN2
plus
15 μL
Isol.
buffe
r
10 μL
SN3
plus
15 μL
Isol.
buffer
10 μL
MITO
plus
15 μL
Isol.
buffer
C
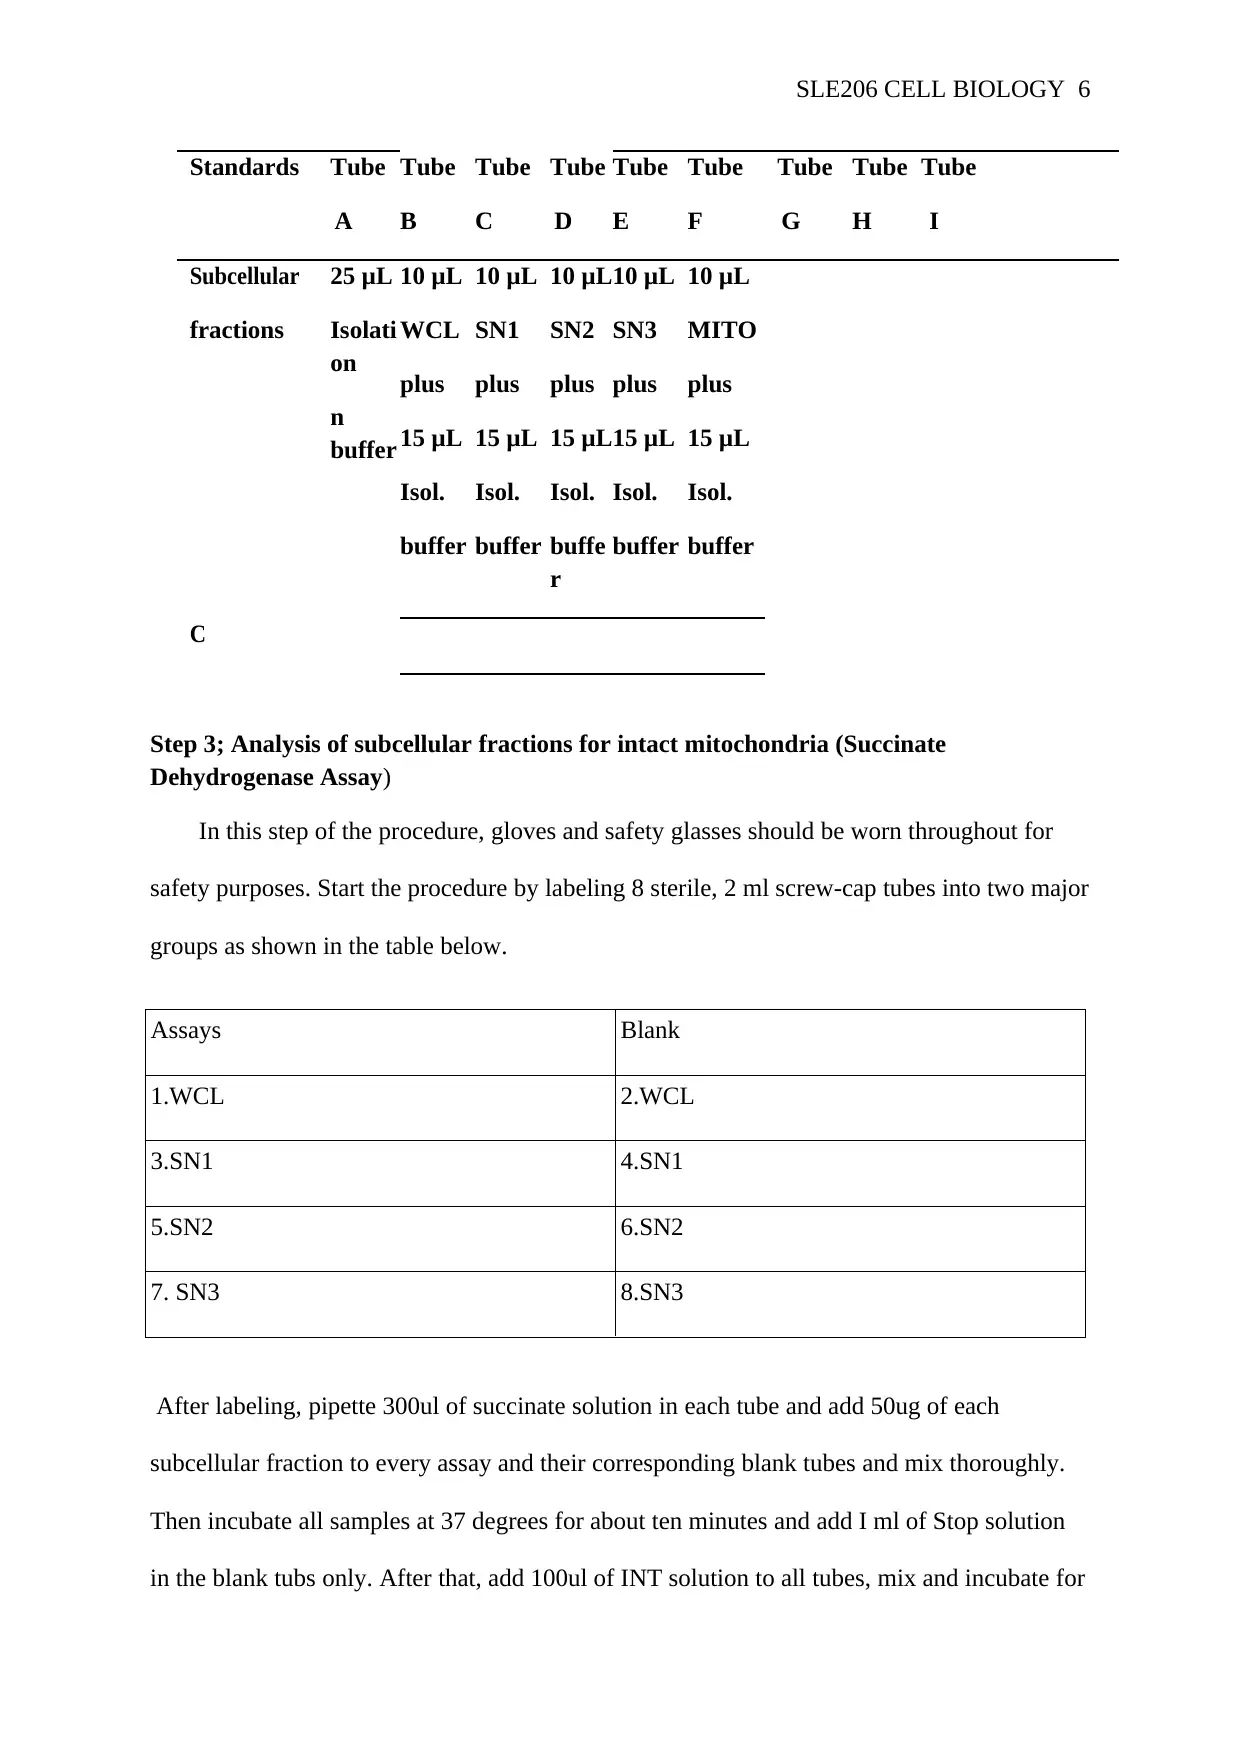
Step 3; Analysis of subcellular fractions for intact mitochondria (Succinate
Dehydrogenase Assay)
In this step of the procedure, gloves and safety glasses should be worn throughout for
safety purposes. Start the procedure by labeling 8 sterile, 2 ml screw-cap tubes into two major
groups as shown in the table below.
Assays Blank
1.WCL 2.WCL
3.SN1 4.SN1
5.SN2 6.SN2
7. SN3 8.SN3
After labeling, pipette 300ul of succinate solution in each tube and add 50ug of each
subcellular fraction to every assay and their corresponding blank tubes and mix thoroughly.
Then incubate all samples at 37 degrees for about ten minutes and add I ml of Stop solution
in the blank tubs only. After that, add 100ul of INT solution to all tubes, mix and incubate for
Standards Tube
A
Tube
B
Tube
C
Tube
D
Tube
E
Tube
F
Tube
G
Tube
H
Tube
I
Subcellular
fractions
25 μL
Isolati
on
n
buffer
10 μL
WCL
plus
15 μL
Isol.
buffer
10 μL
SN1
plus
15 μL
Isol.
buffer
10 μL
SN2
plus
15 μL
Isol.
buffe
r
10 μL
SN3
plus
15 μL
Isol.
buffer
10 μL
MITO
plus
15 μL
Isol.
buffer
C
Step 3; Analysis of subcellular fractions for intact mitochondria (Succinate
Dehydrogenase Assay)
In this step of the procedure, gloves and safety glasses should be worn throughout for
safety purposes. Start the procedure by labeling 8 sterile, 2 ml screw-cap tubes into two major
groups as shown in the table below.
Assays Blank
1.WCL 2.WCL
3.SN1 4.SN1
5.SN2 6.SN2
7. SN3 8.SN3
After labeling, pipette 300ul of succinate solution in each tube and add 50ug of each
subcellular fraction to every assay and their corresponding blank tubes and mix thoroughly.
Then incubate all samples at 37 degrees for about ten minutes and add I ml of Stop solution
in the blank tubs only. After that, add 100ul of INT solution to all tubes, mix and incubate for
SLE206 CELL BIOLOGY 7
another 15 minutes at similar temperatures. At this point, add I ml of Stop Solution to all
tubes labeled assays to stop the reaction and then centrifuge for around two min using the
maximum speed to pellet any precipitate. Then transfer all supernatant to 1.3cm diameter
glass cuvettes and measure the absorbance of all assay samples against the corresponding
blank samples using a spectrophotometer at 490nm. Calculate the concentration of reduced
INT per mg protein and fill the table in the datasheet. Dispose of the cuvettes and any other
used apparatus from all the step above.
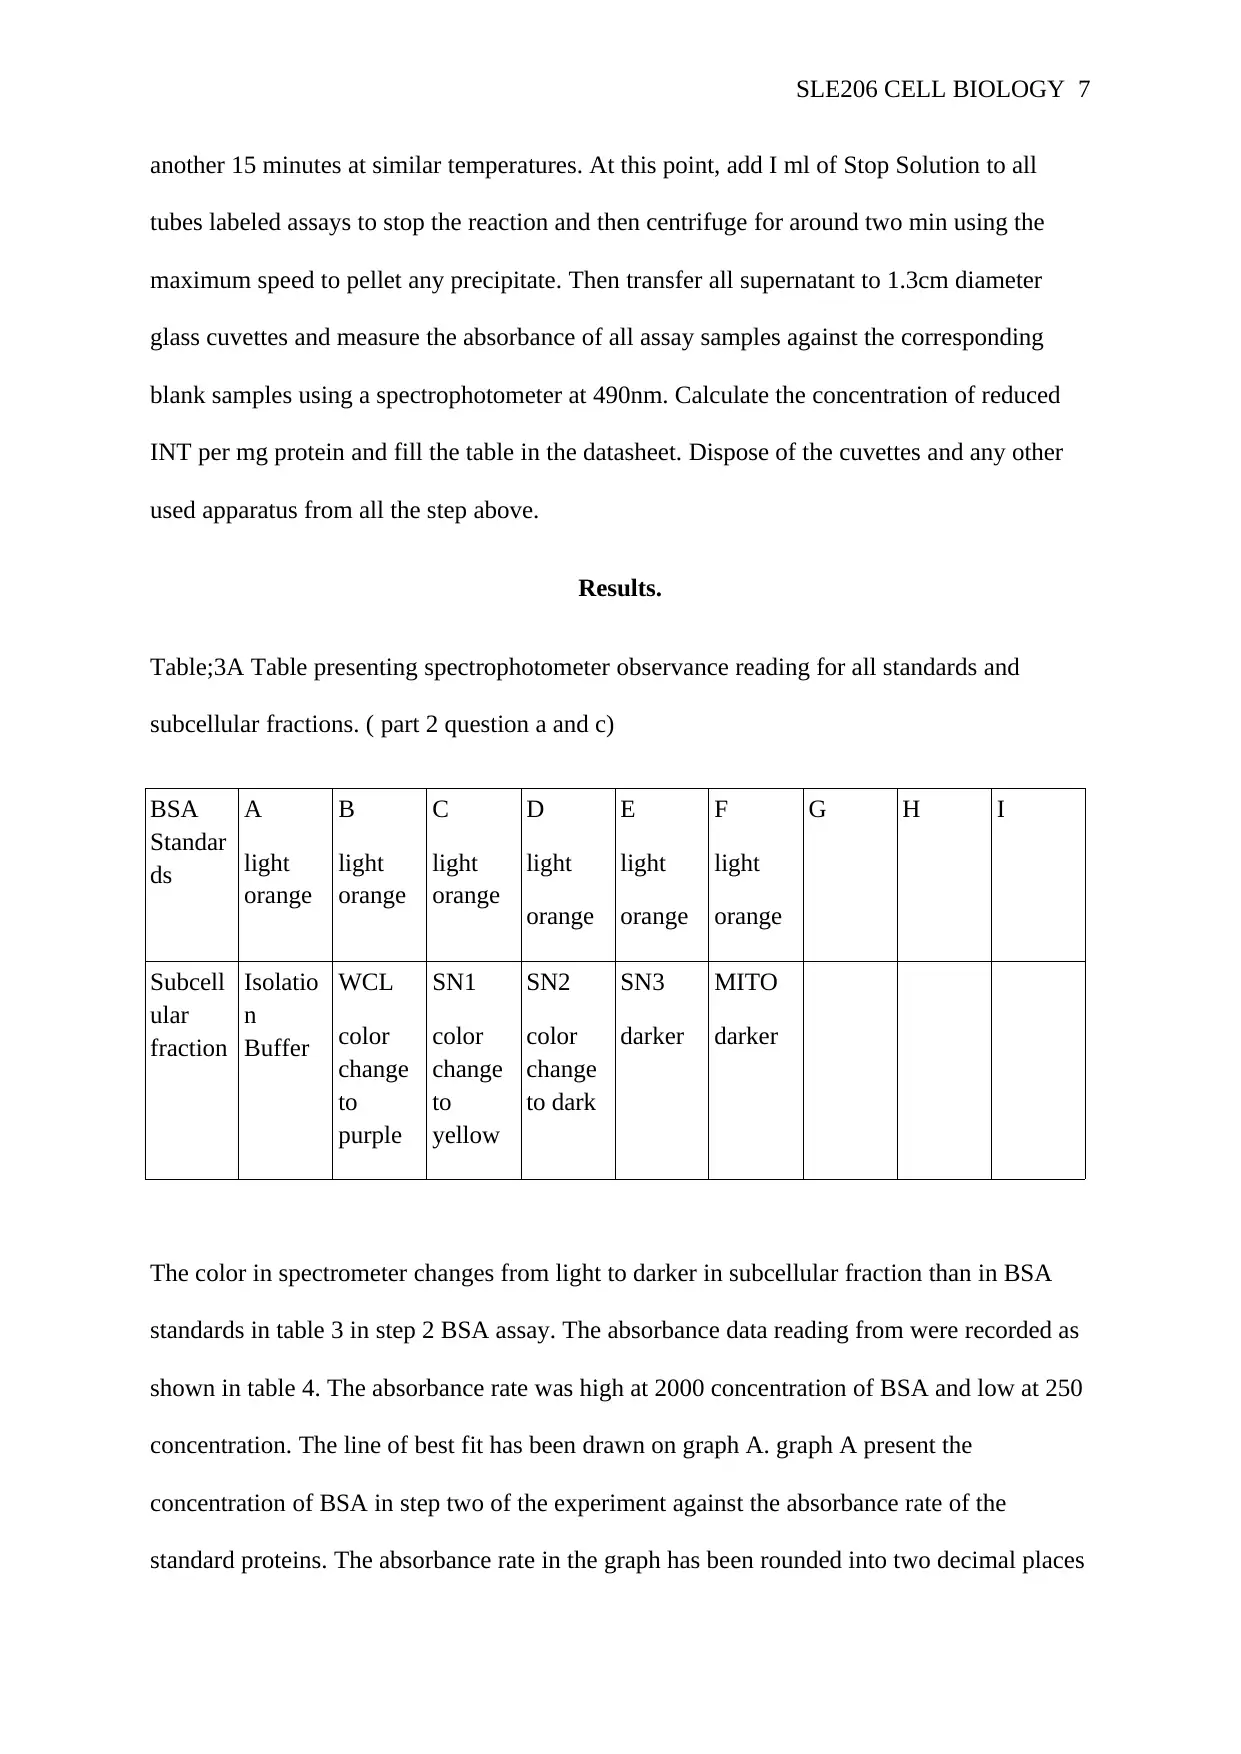
Results.
Table;3A Table presenting spectrophotometer observance reading for all standards and
subcellular fractions. ( part 2 question a and c)
BSA
Standar
ds
A
light
orange
B
light
orange
C
light
orange
D
light
orange
E
light
orange
F
light
orange
G H I
Subcell
ular
fraction
Isolatio
n
Buffer
WCL
color
change
to
purple
SN1
color
change
to
yellow
SN2
color
change
to dark
SN3
darker
MITO
darker
The color in spectrometer changes from light to darker in subcellular fraction than in BSA
standards in table 3 in step 2 BSA assay. The absorbance data reading from were recorded as
shown in table 4. The absorbance rate was high at 2000 concentration of BSA and low at 250
concentration. The line of best fit has been drawn on graph A. graph A present the
concentration of BSA in step two of the experiment against the absorbance rate of the
standard proteins. The absorbance rate in the graph has been rounded into two decimal places
another 15 minutes at similar temperatures. At this point, add I ml of Stop Solution to all
tubes labeled assays to stop the reaction and then centrifuge for around two min using the
maximum speed to pellet any precipitate. Then transfer all supernatant to 1.3cm diameter
glass cuvettes and measure the absorbance of all assay samples against the corresponding
blank samples using a spectrophotometer at 490nm. Calculate the concentration of reduced
INT per mg protein and fill the table in the datasheet. Dispose of the cuvettes and any other
used apparatus from all the step above.
Results.
Table;3A Table presenting spectrophotometer observance reading for all standards and
subcellular fractions. ( part 2 question a and c)
BSA
Standar
ds
A
light
orange
B
light
orange
C
light
orange
D
light
orange
E
light
orange
F
light
orange
G H I
Subcell
ular
fraction
Isolatio
n
Buffer
WCL
color
change
to
purple
SN1
color
change
to
yellow
SN2
color
change
to dark
SN3
darker
MITO
darker
The color in spectrometer changes from light to darker in subcellular fraction than in BSA
standards in table 3 in step 2 BSA assay. The absorbance data reading from were recorded as
shown in table 4. The absorbance rate was high at 2000 concentration of BSA and low at 250
concentration. The line of best fit has been drawn on graph A. graph A present the
concentration of BSA in step two of the experiment against the absorbance rate of the
standard proteins. The absorbance rate in the graph has been rounded into two decimal places
Paraphrase This Document
Need a fresh take? Get an instant paraphrase of this document with our AI Paraphraser
SLE206 CELL BIOLOGY 8
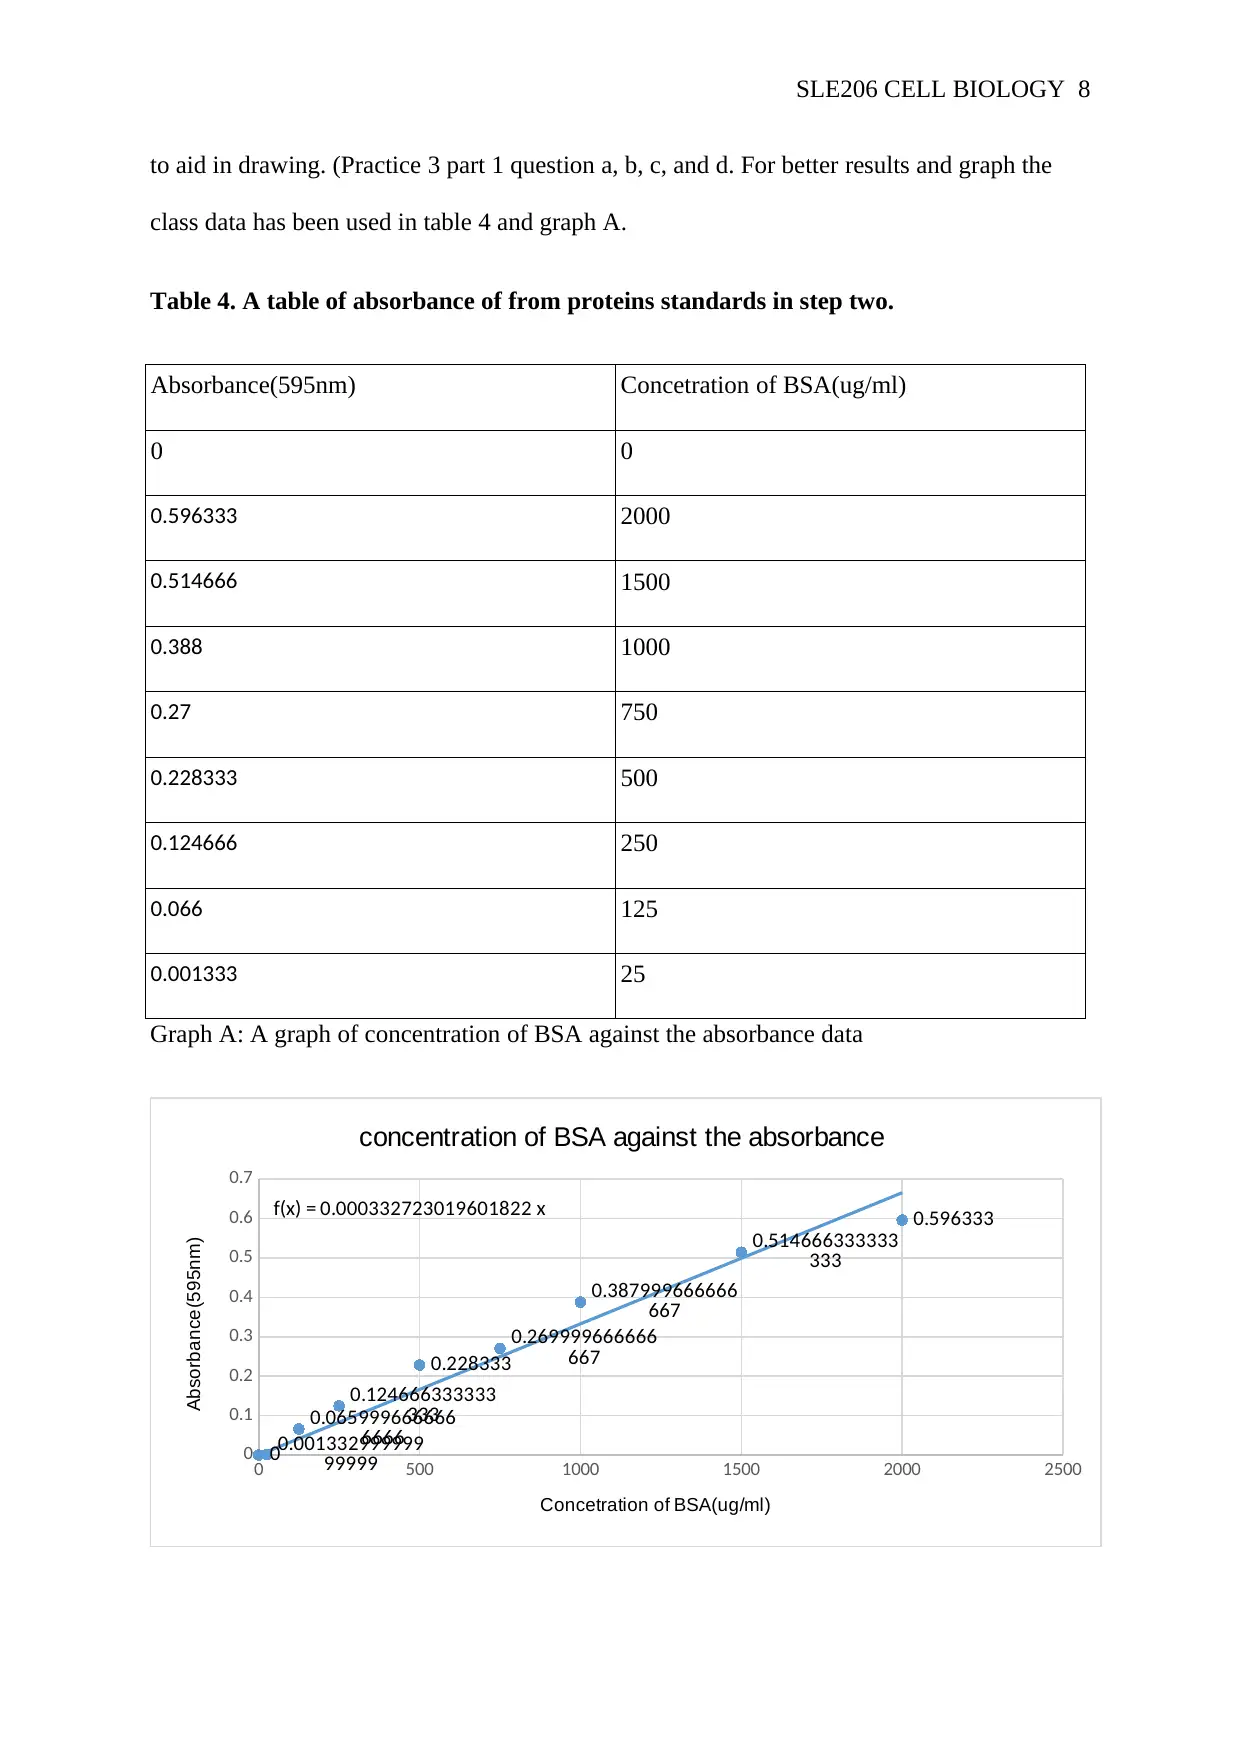
to aid in drawing. (Practice 3 part 1 question a, b, c, and d. For better results and graph the
class data has been used in table 4 and graph A.
Table 4. A table of absorbance of from proteins standards in step two.
Absorbance(595nm) Concetration of BSA(ug/ml)
0 0
0.596333 2000
0.514666 1500
0.388 1000
0.27 750
0.228333 500
0.124666 250
0.066 125
0.001333 25
Graph A: A graph of concentration of BSA against the absorbance data
0 500 1000 1500 2000 2500
0
0.1
0.2
0.3
0.4
0.5
0.6
0.7
0
0.596333
0.514666333333
333
0.387999666666
667
0.269999666666
6670.228333
0.124666333333
3330.065999666666
66660.001332999999
99999
f(x) = 0.000332723019601822 x
concentration of BSA against the absorbance
Concetration of BSA(ug/ml)
Absorbance(595nm)
SLE206 CELL BIOLOGY 9
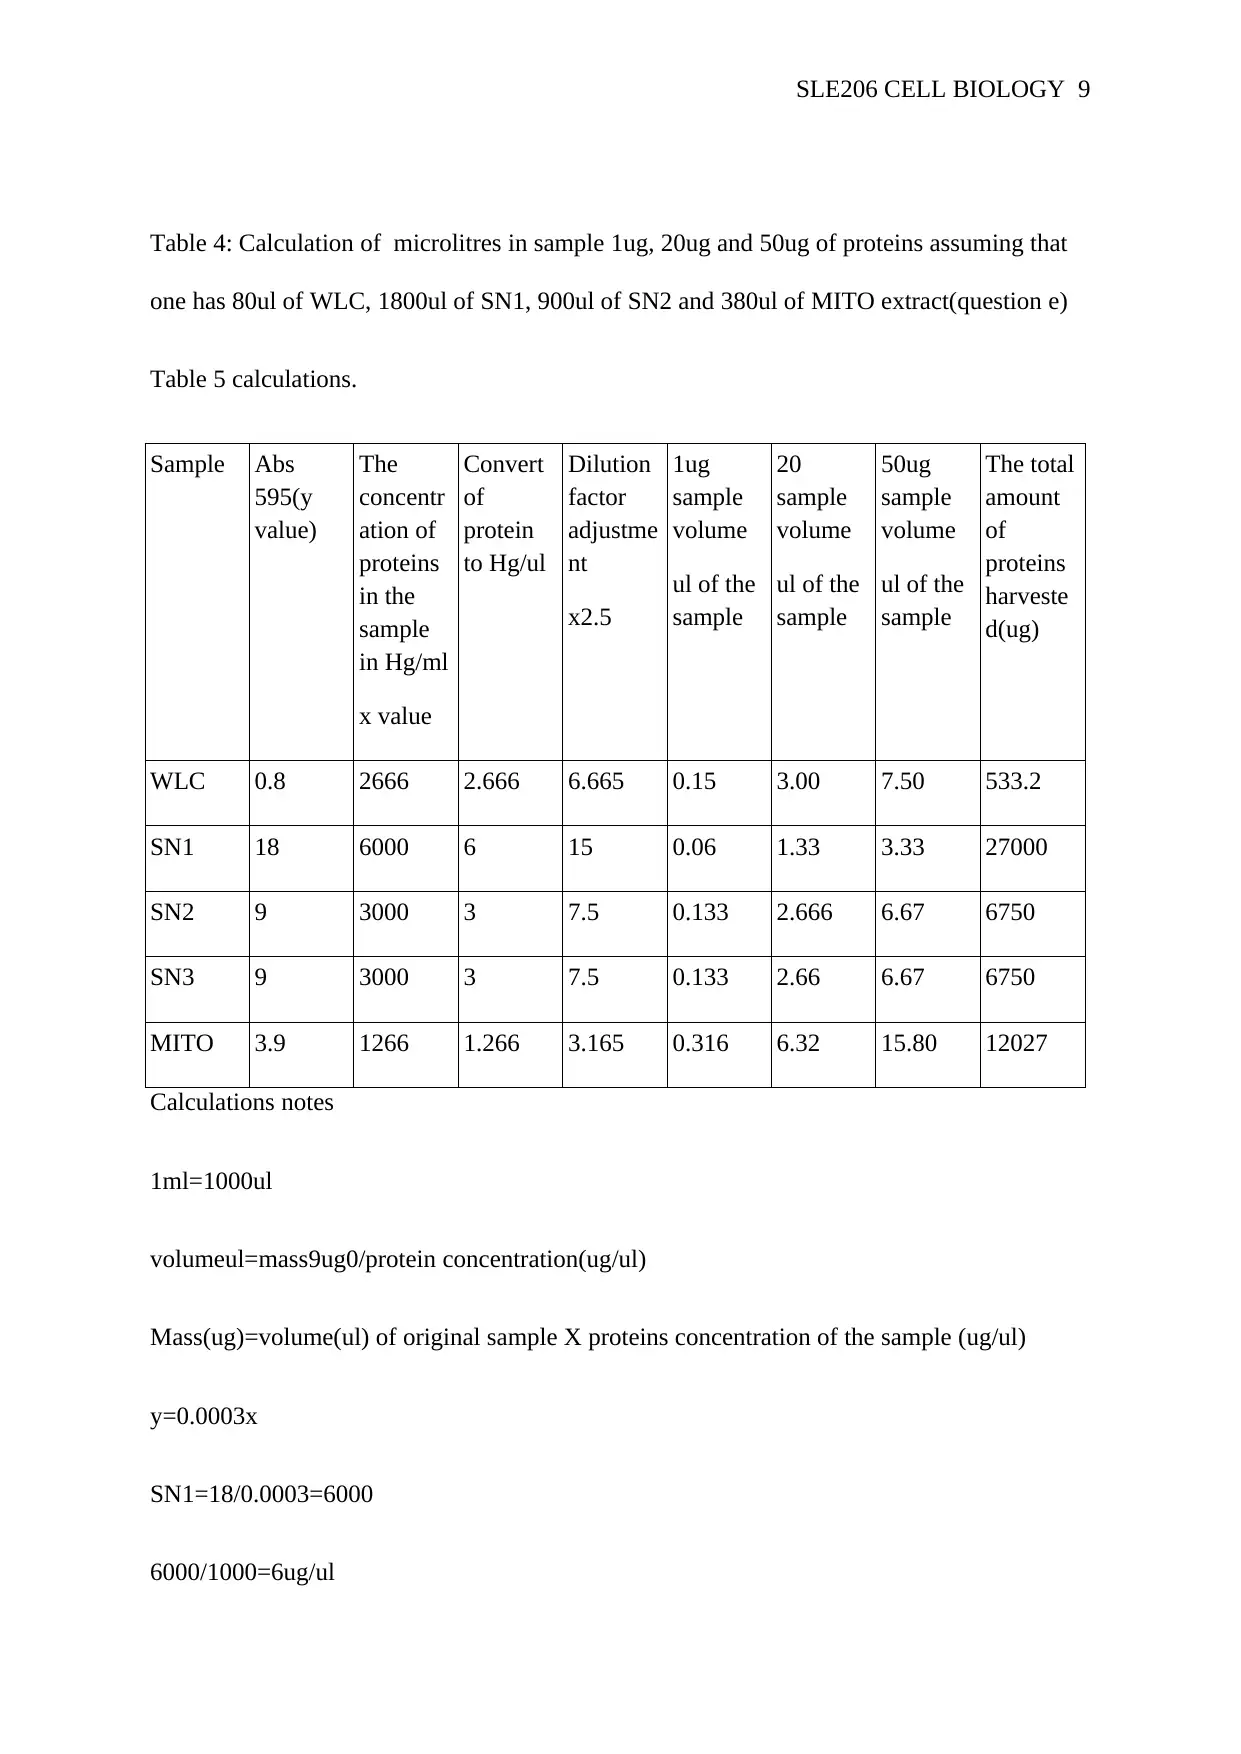
Table 4: Calculation of microlitres in sample 1ug, 20ug and 50ug of proteins assuming that
one has 80ul of WLC, 1800ul of SN1, 900ul of SN2 and 380ul of MITO extract(question e)
Table 5 calculations.
Sample Abs
595(y
value)
The
concentr
ation of
proteins
in the
sample
in Hg/ml
x value
Convert
of
protein
to Hg/ul
Dilution
factor
adjustme
nt
x2.5
1ug
sample
volume
ul of the
sample
20
sample
volume
ul of the
sample
50ug
sample
volume
ul of the
sample
The total
amount
of
proteins
harveste
d(ug)
WLC 0.8 2666 2.666 6.665 0.15 3.00 7.50 533.2
SN1 18 6000 6 15 0.06 1.33 3.33 27000
SN2 9 3000 3 7.5 0.133 2.666 6.67 6750
SN3 9 3000 3 7.5 0.133 2.66 6.67 6750
MITO 3.9 1266 1.266 3.165 0.316 6.32 15.80 12027
Calculations notes
1ml=1000ul
volumeul=mass9ug0/protein concentration(ug/ul)
Mass(ug)=volume(ul) of original sample X proteins concentration of the sample (ug/ul)
y=0.0003x
SN1=18/0.0003=6000
6000/1000=6ug/ul
SLE206 CELL BIOLOGY 10
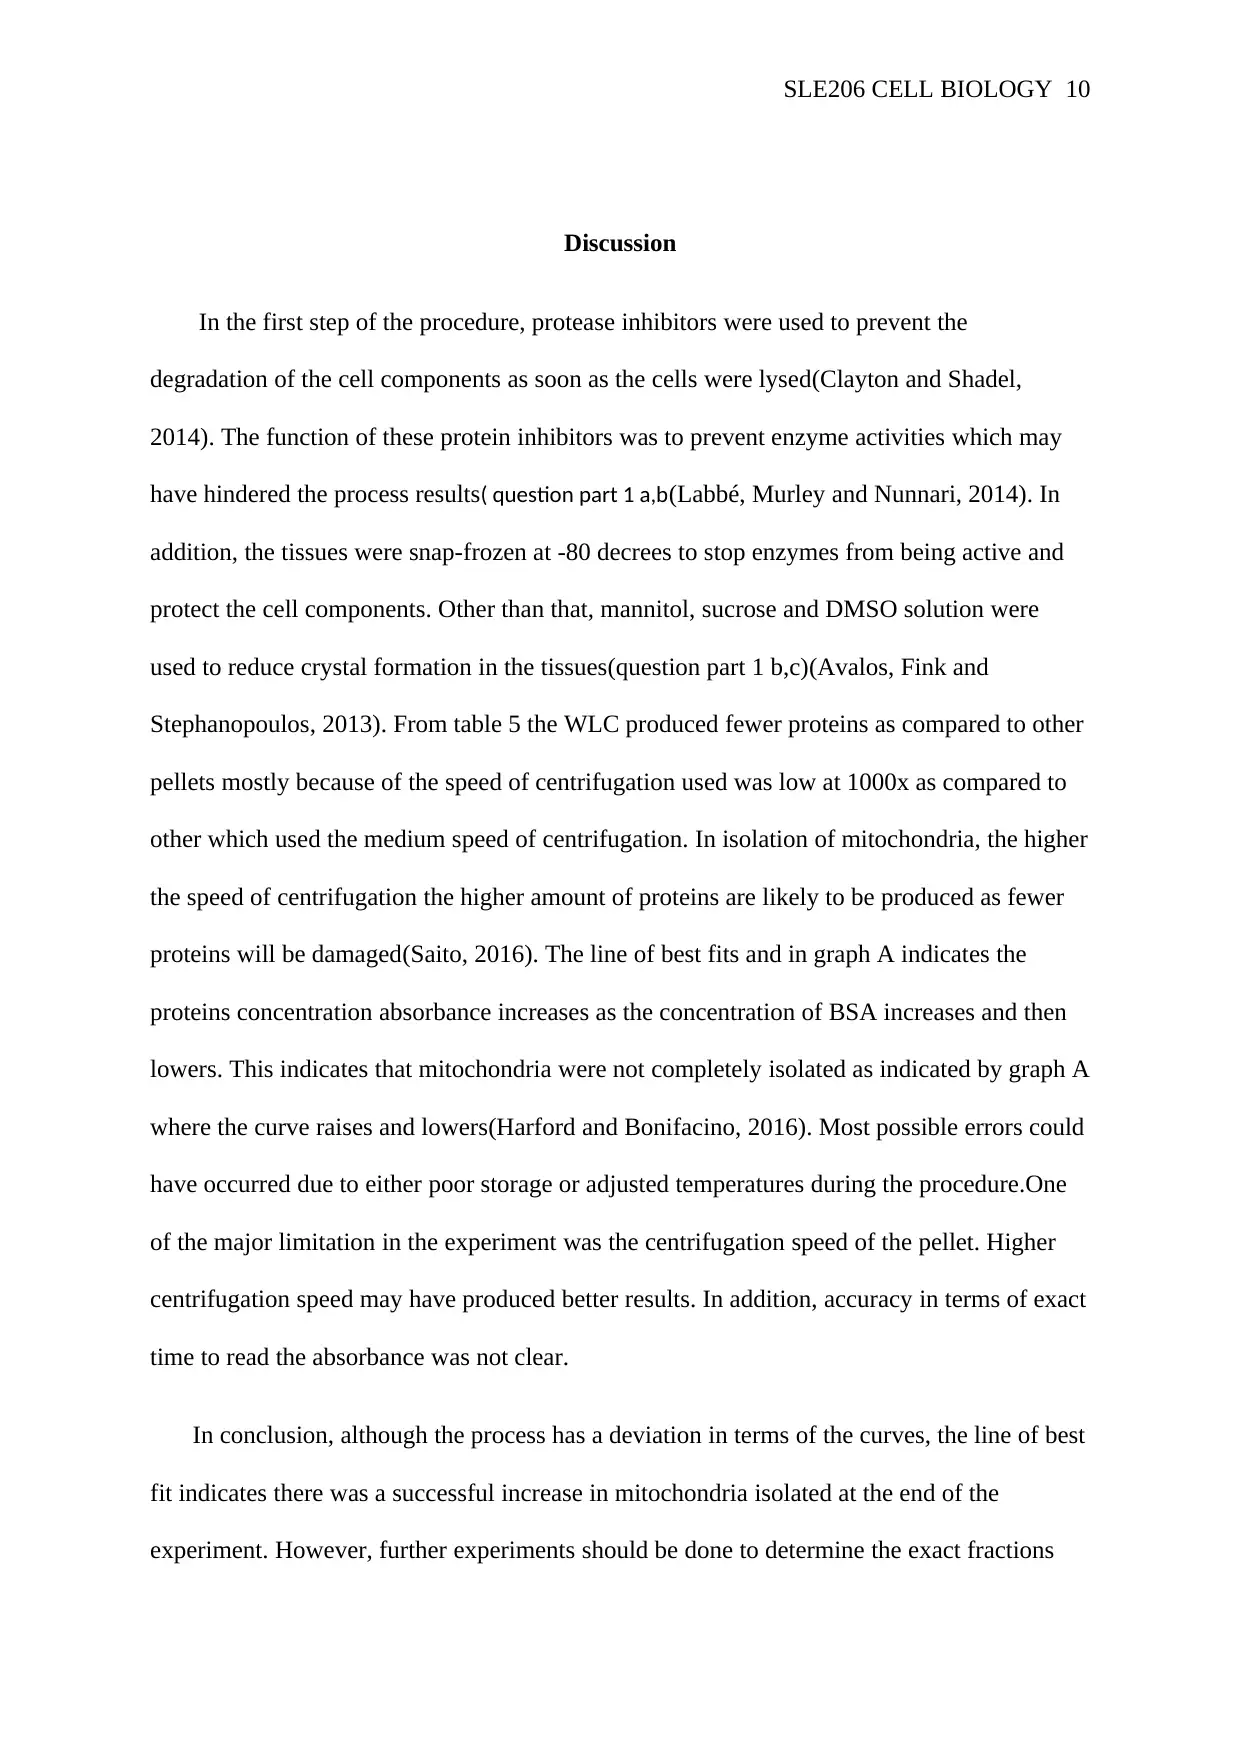
Discussion
In the first step of the procedure, protease inhibitors were used to prevent the
degradation of the cell components as soon as the cells were lysed(Clayton and Shadel,
2014). The function of these protein inhibitors was to prevent enzyme activities which may
have hindered the process results( question part 1 a,b(Labbé, Murley and Nunnari, 2014). In
addition, the tissues were snap-frozen at -80 decrees to stop enzymes from being active and
protect the cell components. Other than that, mannitol, sucrose and DMSO solution were
used to reduce crystal formation in the tissues(question part 1 b,c)(Avalos, Fink and
Stephanopoulos, 2013). From table 5 the WLC produced fewer proteins as compared to other
pellets mostly because of the speed of centrifugation used was low at 1000x as compared to
other which used the medium speed of centrifugation. In isolation of mitochondria, the higher
the speed of centrifugation the higher amount of proteins are likely to be produced as fewer
proteins will be damaged(Saito, 2016). The line of best fits and in graph A indicates the
proteins concentration absorbance increases as the concentration of BSA increases and then
lowers. This indicates that mitochondria were not completely isolated as indicated by graph A
where the curve raises and lowers(Harford and Bonifacino, 2016). Most possible errors could
have occurred due to either poor storage or adjusted temperatures during the procedure.One
of the major limitation in the experiment was the centrifugation speed of the pellet. Higher
centrifugation speed may have produced better results. In addition, accuracy in terms of exact
time to read the absorbance was not clear.
In conclusion, although the process has a deviation in terms of the curves, the line of best
fit indicates there was a successful increase in mitochondria isolated at the end of the
experiment. However, further experiments should be done to determine the exact fractions
Secure Best Marks with AI Grader
Need help grading? Try our AI Grader for instant feedback on your assignments.
SLE206 CELL BIOLOGY 11
needed to provide a better result. The experiment implied current medical research as it can
be used to determine better therapeutics for cancer and metabolic diseases.
needed to provide a better result. The experiment implied current medical research as it can
be used to determine better therapeutics for cancer and metabolic diseases.
SLE206 CELL BIOLOGY 12
References.
Avalos, J. L., Fink, G. R. and Stephanopoulos, G. (2013) ‘Compartmentalization of metabolic
pathways in yeast mitochondria improves the production of branched-chain alcohols’, Nature
Biotechnology. doi: 10.1038/nbt.2509.
Azimzadeh, P. et al. (2016) ‘Comparison of three methods for mitochondria isolation from
the human liver cell line (HepG2)’, Gastroenterology and Hepatology from Bed to Bench.
Clayton, D. A. and Shadel, G. S. (2014) ‘Isolation of mitochondria from cells and tissues’,
Cold Spring Harbor Protocols. doi: 10.1101/pdb.top074542.
Dimauro, I. et al. (2012) ‘A simple protocol for the subcellular fractionation of skeletal
muscle cells and tissue’, BMC Research Notes. doi: 10.1186/1756-0500-5-513.
Harford, J. B. and Bonifacino, J. S. (2016) ‘Subcellular fractionation and isolation of
organelles’, Current Protocols in Cell Biology. doi: 10.1002/0471143030.cb0300s45.
Labbé, K., Murley, A. and Nunnari, J. (2014) ‘Determinants and Functions of Mitochondrial
Behavior’, Annual Review of Cell and Developmental Biology. doi: 10.1146/annurev-cellbio-
101011-155756.
Nunnari, J. and Suomalainen, A. (2012) ‘Mitochondria: In sickness and in health’, Cell. doi:
10.1016/j.cell.2012.02.035.
Ortiz-Espín, A. Iglesias-Fernández ,R. Calderón, A Calderón A.Carbone,P.Sevilla,F.and
Junnez, A. (2017) ‘Mitochondrial AtTrxo1 is transcriptionally regulated by AtbZIP9 and
AtAZF2 and affects seed germination under saline conditions’, Journal of Experimental
Botany, 68(5), pp. 1025–1038. doi: 10.1093/jxb/erx012.
Rizzuto, R. D Stefanni D. RafferoA. And Mammucari C. (2012) ‘Mitochondria as sensors
and regulators of calcium signalling’, Nature Reviews Molecular Cell Biology. doi:
10.1038/nrm3412.
Saito, H. (2016) ‘[Epidemiology on Norwalk virus-related gastroenteritis outbreaks among
elderly persons living in nursing homes]’, Nihon Rinsho, 60(6), pp. 1148–1153. Available at:
https://www.ncbi.nlm.nih.gov/pubmed/12078088.
Schmitt, S. and Zischka, H. (2018) ‘Targeting Mitochondria for Cancer Therapy’, Deutsche
Zeitschrift fur Onkologie. doi: 10.1055/a-0657-4437.
Schrepfer, E. and Scorrano, L. (2016) ‘Mitofusins, from Mitochondria to Metabolism’,
Molecular Cell. doi: 10.1016/j.molcel.2016.02.022.
SLE206 CELL BIOLOGY 13
1 out of 13
Related Documents


Your All-in-One AI-Powered Toolkit for Academic Success.
+13062052269
info@desklib.com
Available 24*7 on WhatsApp / Email
![[object Object]](/_next/static/media/star-bottom.7253800d.svg)
Unlock your academic potential
© 2024 | Zucol Services PVT LTD | All rights reserved.