ISYS3375 Business Analytics: Assignment Solution and Analysis
VerifiedAdded on 2019/09/24
|3
|1421
|257
Homework Assignment
AI Summary
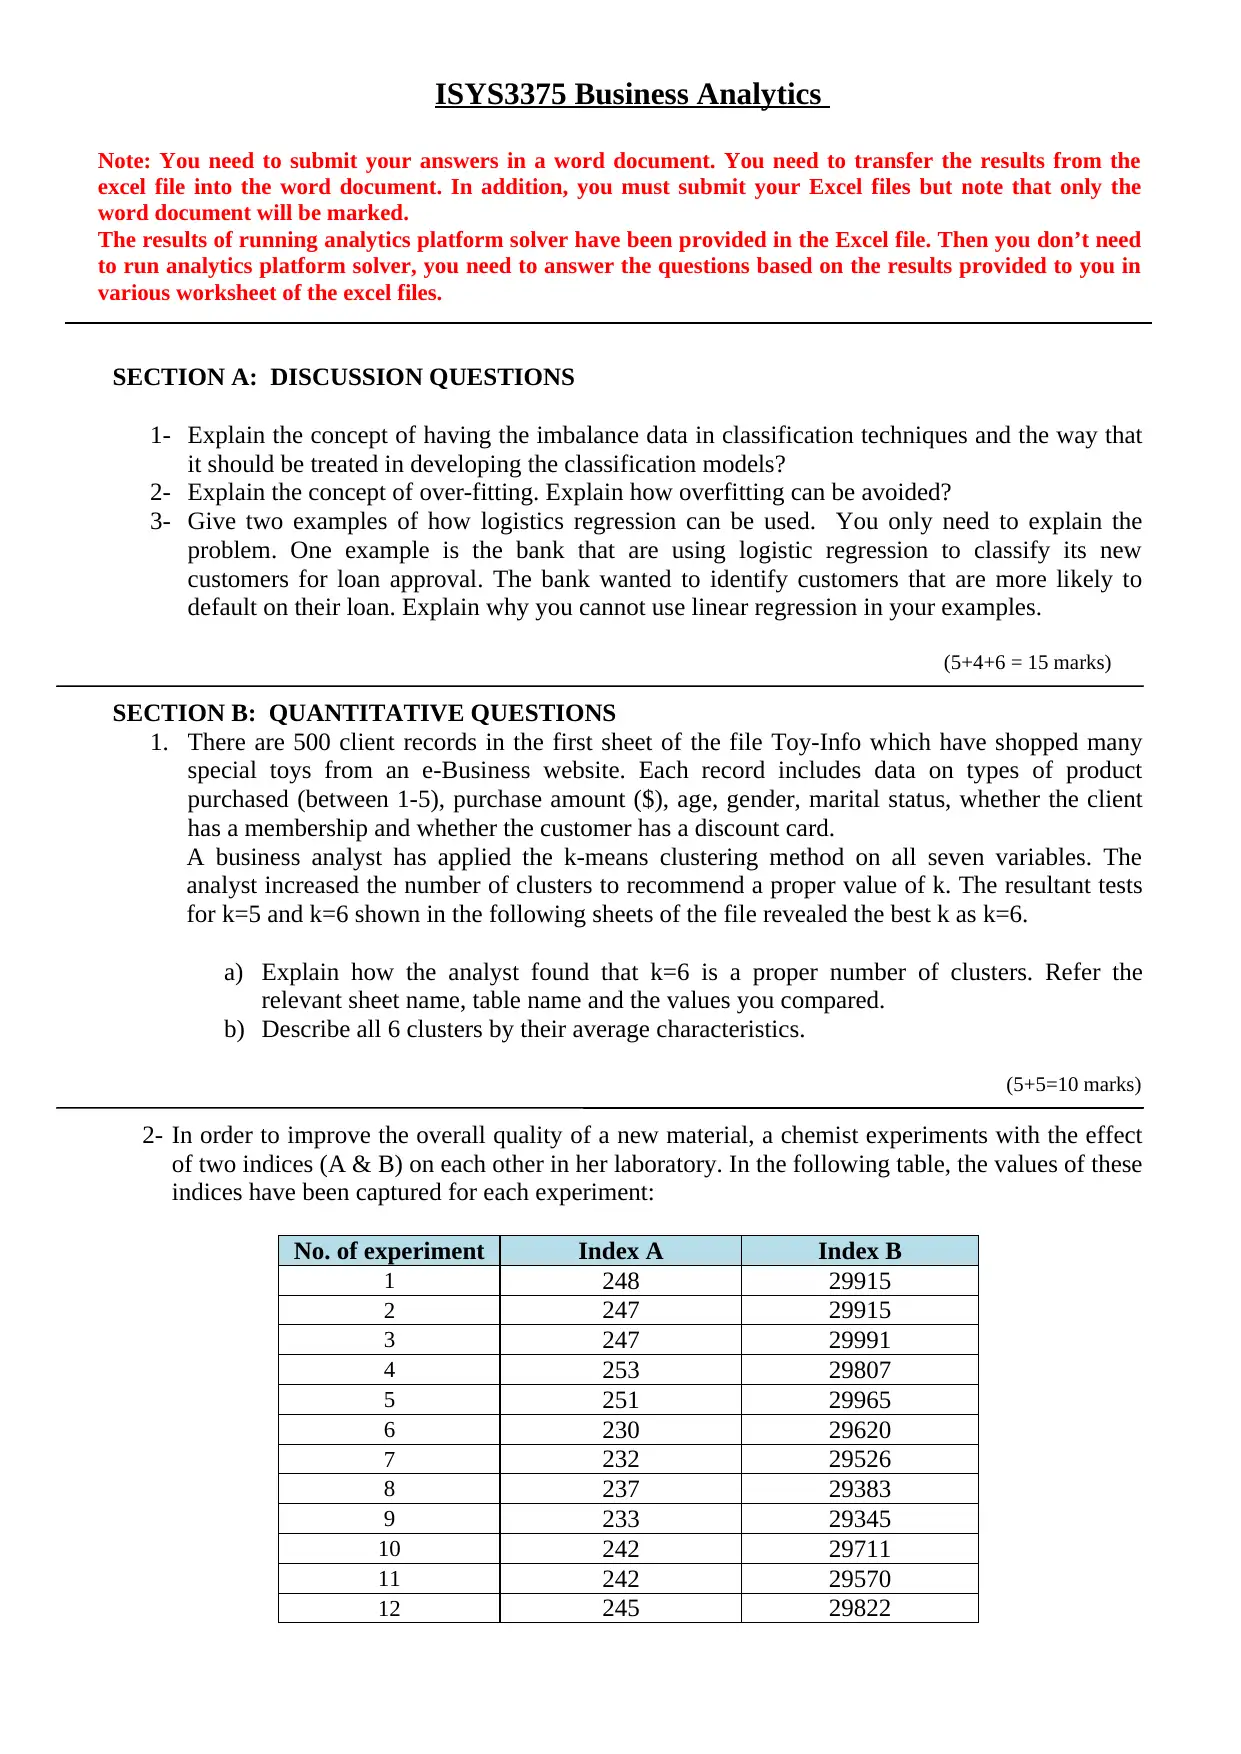
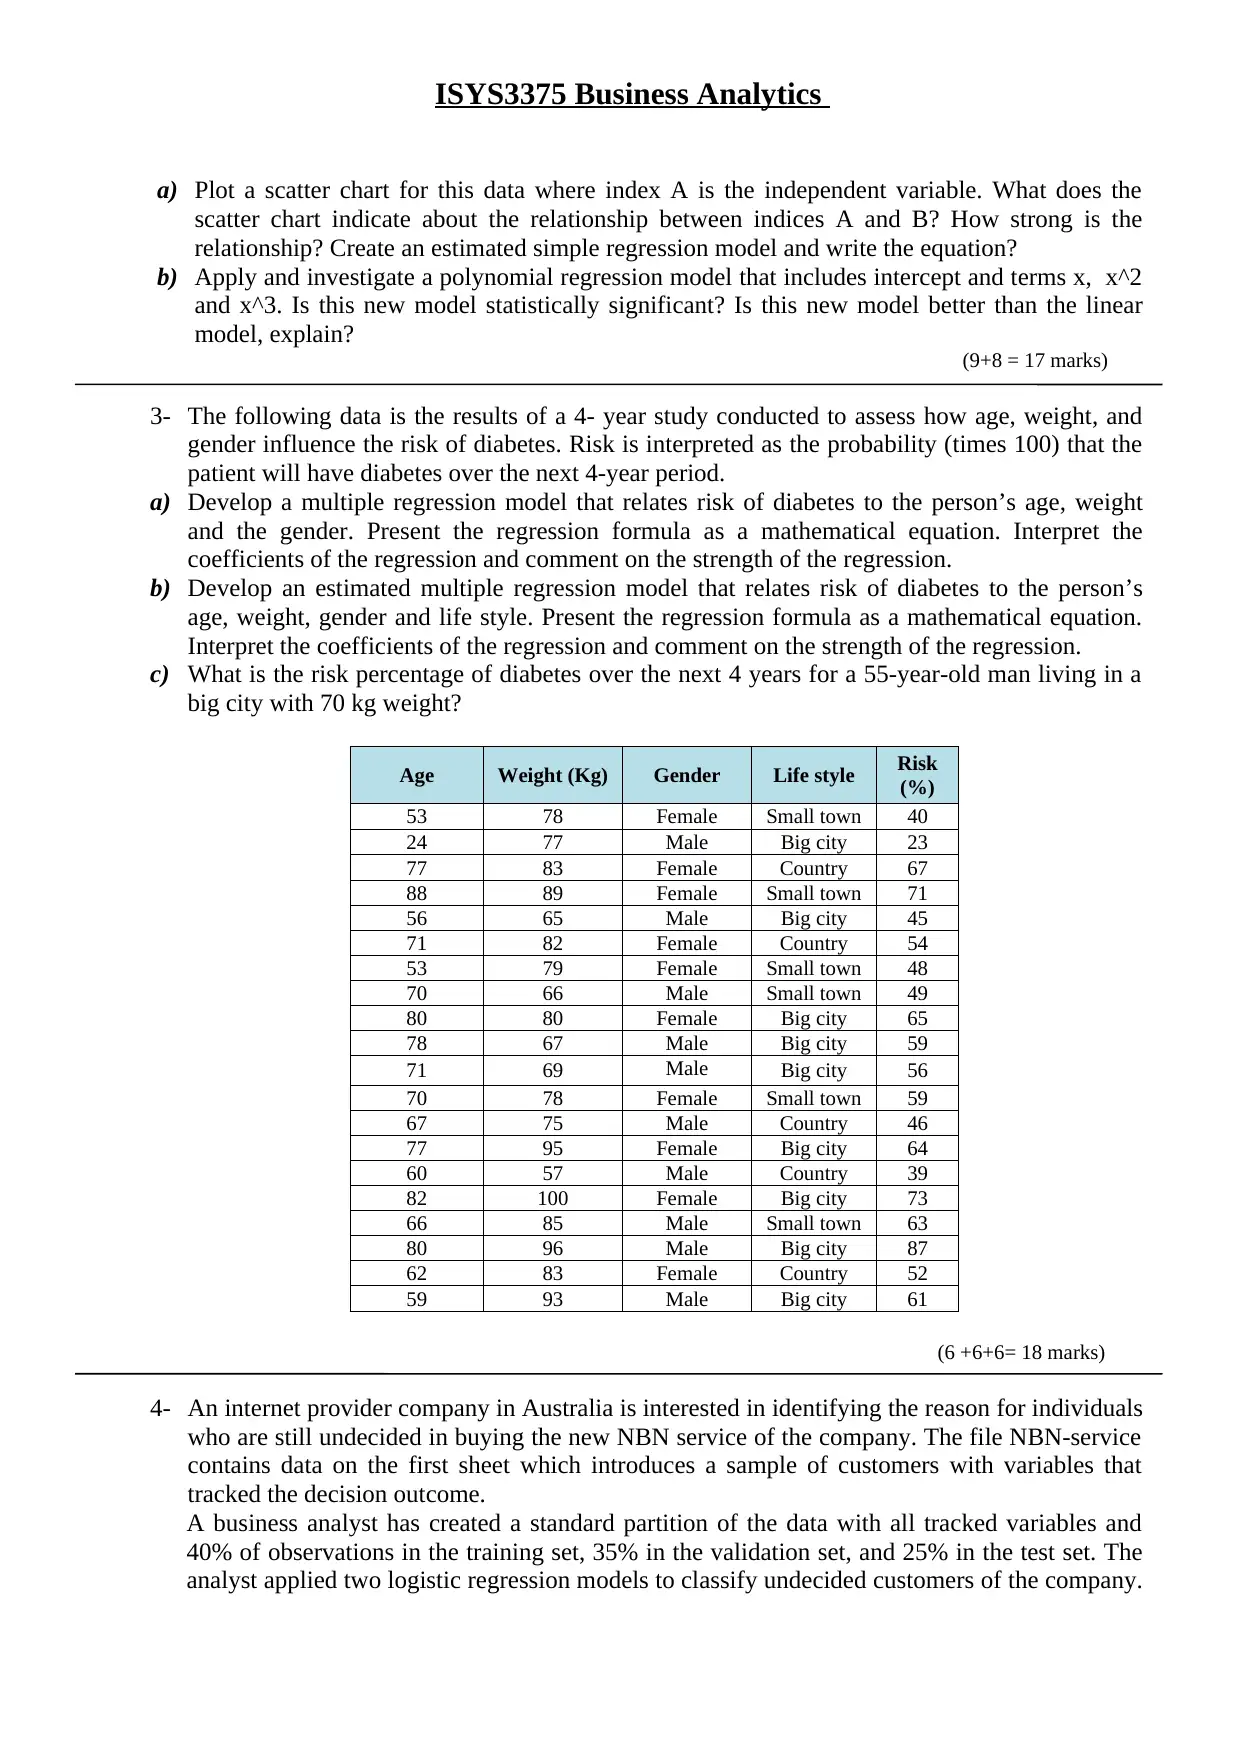
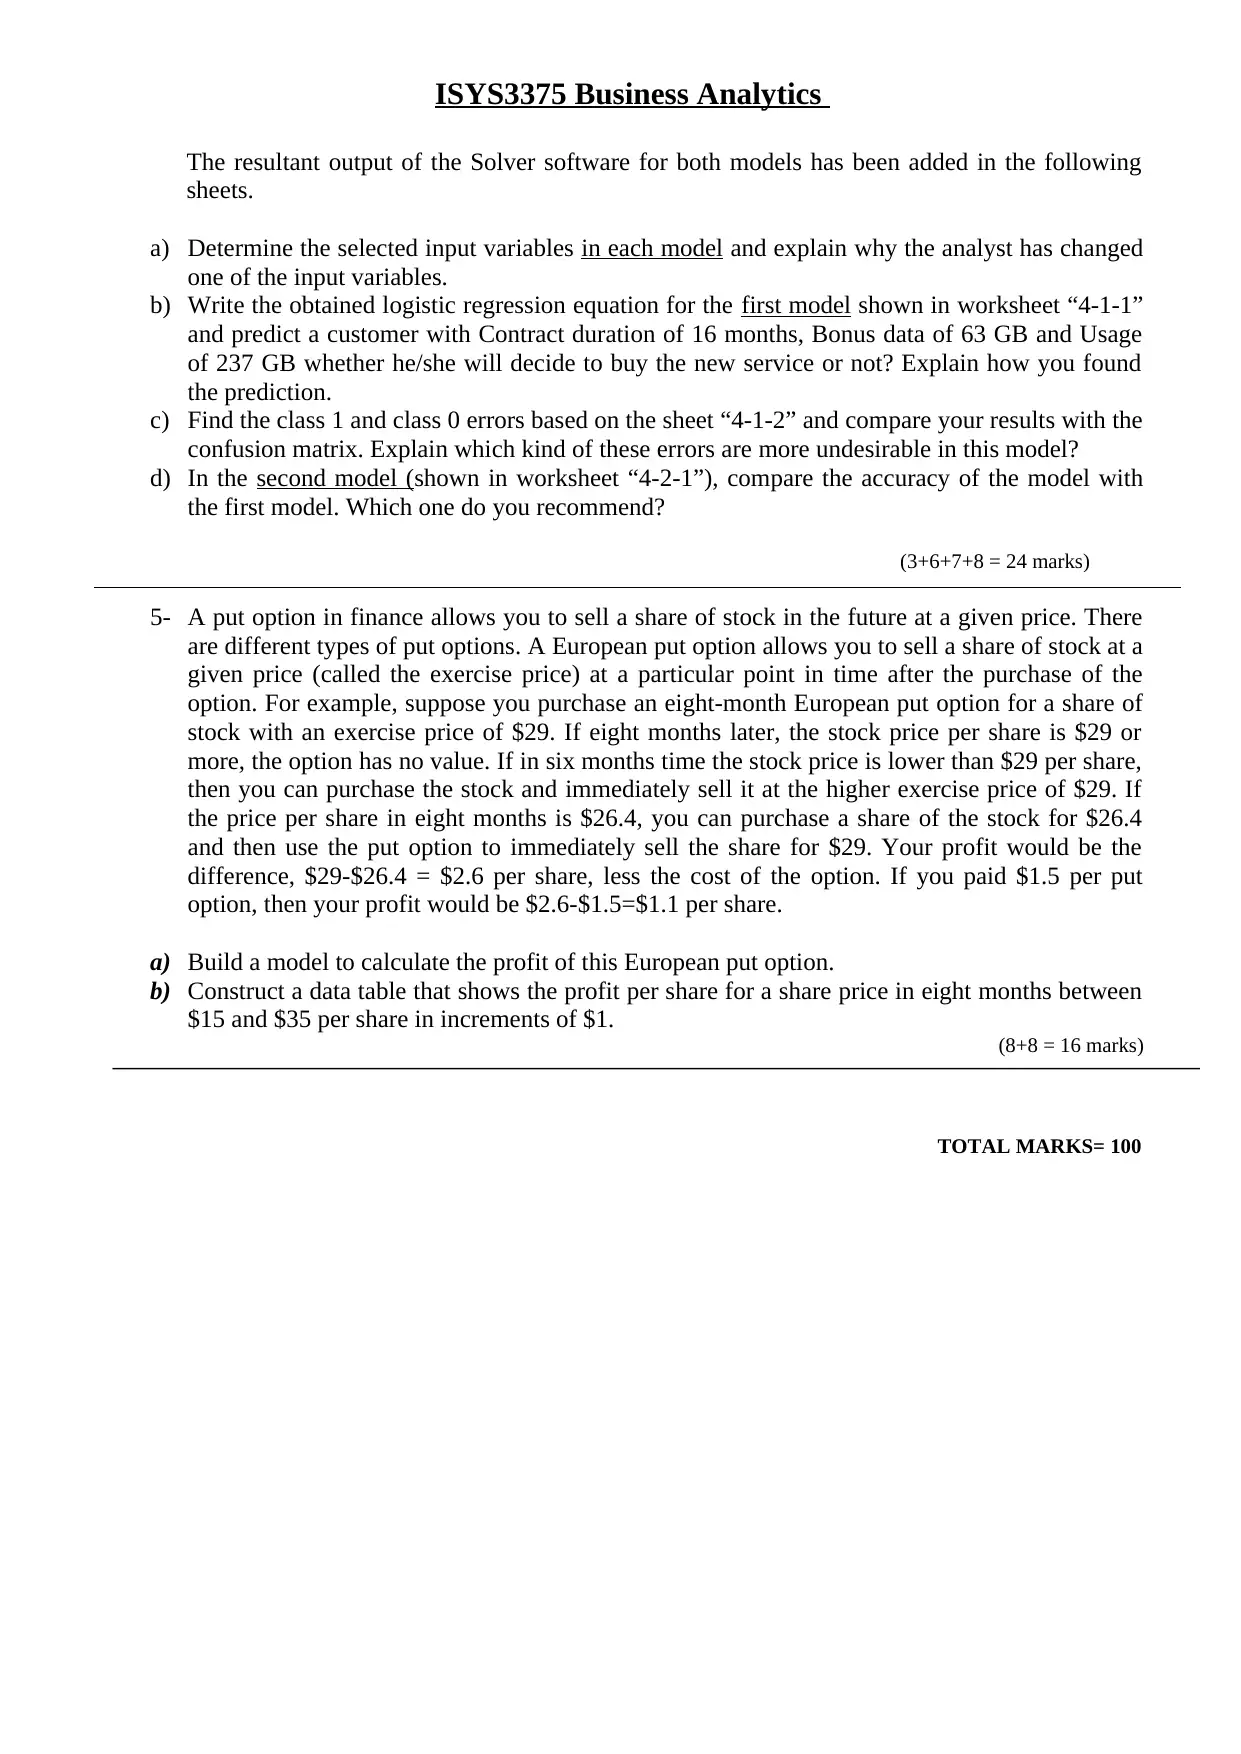
This document provides a comprehensive solution to a Business Analytics assignment (ISYS3375) focusing on various data analysis techniques. The assignment covers topics including handling imbalanced data in classification, overfitting, and applications of logistic regression. It delves into quantitative questions involving k-means clustering, scatter plots, simple and polynomial regression models, and multiple regression models to assess factors influencing diabetes risk. Furthermore, the solution addresses logistic regression models for customer behavior analysis and builds a model to calculate the profit of a European put option using data tables. The assignment requires the use of Excel for data analysis and the presentation of results in a Word document.
1 out of 3

Your All-in-One AI-Powered Toolkit for Academic Success.
+13062052269
info@desklib.com
Available 24*7 on WhatsApp / Email
![[object Object]](/_next/static/media/star-bottom.7253800d.svg)
Copyright © 2020–2026 A2Z Services. All Rights Reserved. Developed and managed by ZUCOL.