logo

Variance Matrix - A key feature of DMVBI

8 Pages1369 Words444 Views
   

IT Management Issues (ITC563)


Added on  2020-04-01

About This Document

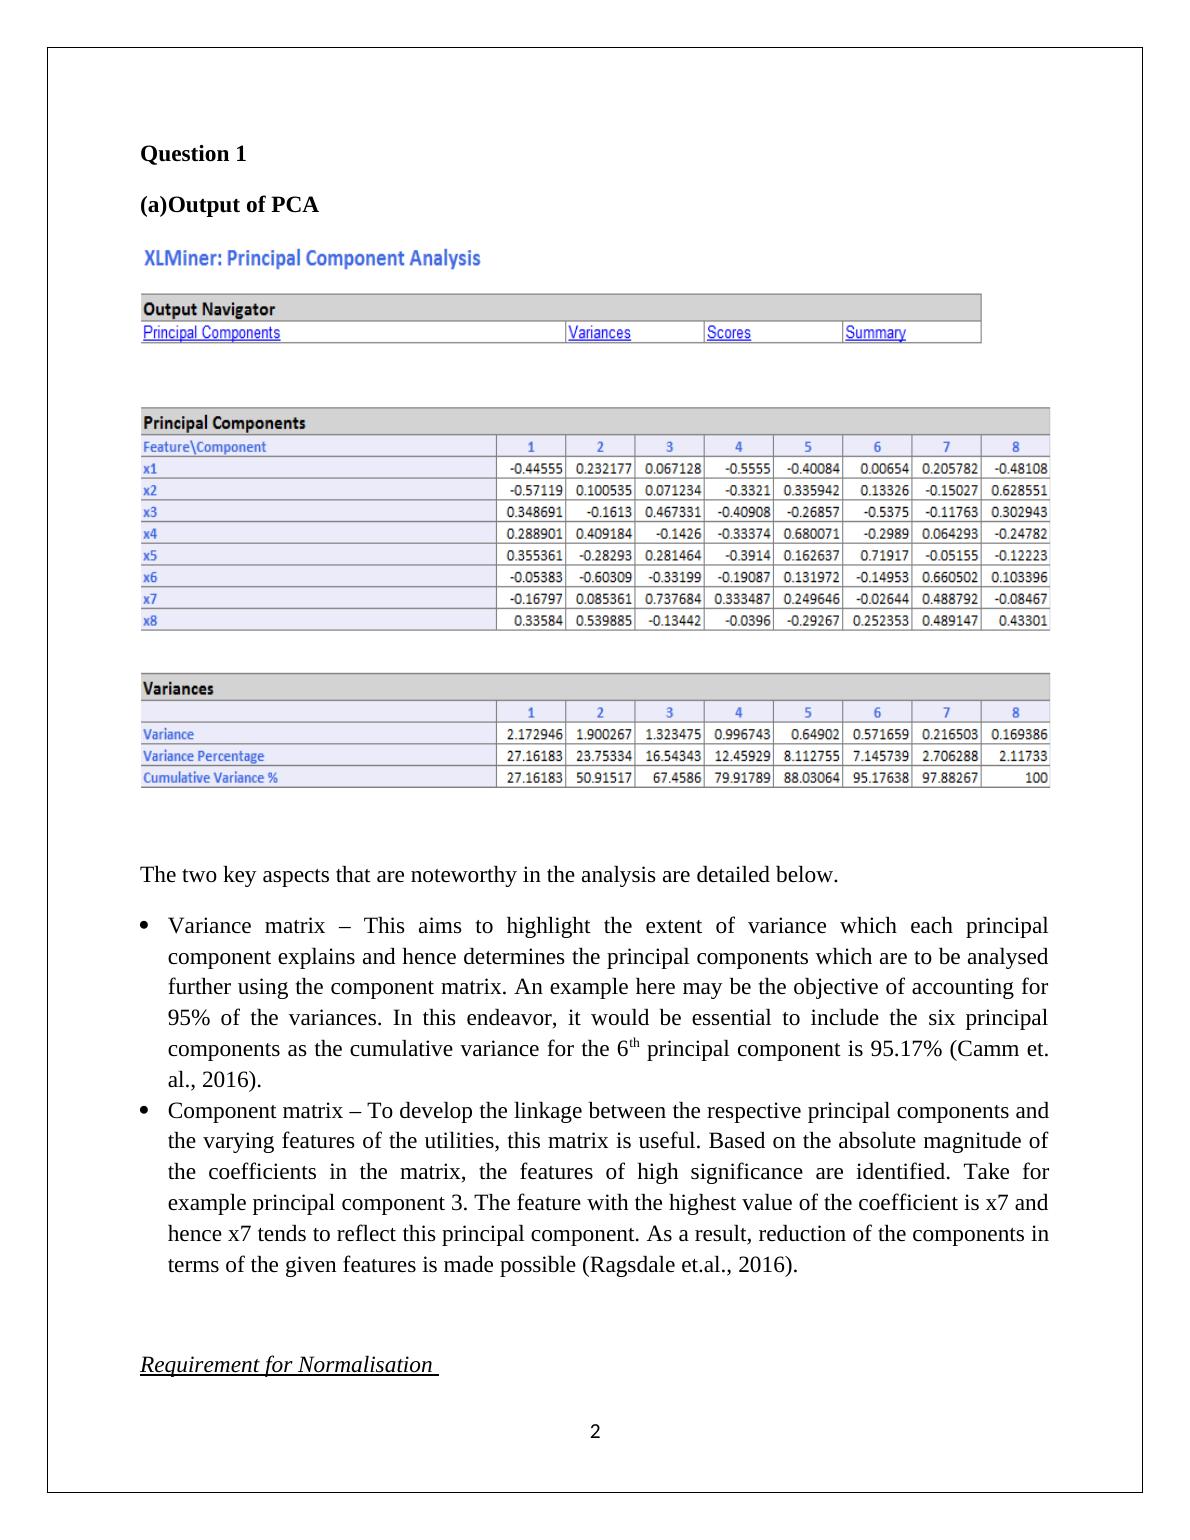
Online = 1 shows that customers have credit card and bank data are not distributed below: (i) Online = 1 shows that customers have credit card and bank data are not distributed below: (ii) Online = 1 shows that customers have credit card and bank data are not distributed below: (iii) Online = 1 shows that customers have credit card and bank data are not distributed below: (iv) Online = 1 shows that customers have credit card and bank data are not distributed below: (

Variance Matrix - A key feature of DMVBI


IT Management Issues (ITC563)

   Added on 2020-04-01

ShareRelated Documents
DATA MINING Subject Code: ITC563Subject Name: DMVBIAssignment No: 2Lecturer Name: Sarwar TaparStudent First Name: NipunaStudent Surname: EkanayakeStudent ID: 11642697Assignment Due Date:17/09/2017Assignment Submission Date: 18/09/20171
Variance Matrix - A key feature of DMVBI_1
Question 1 (a)Output of PCAThe two key aspects that are noteworthy in the analysis are detailed below.Variance matrix – This aims to highlight the extent of variance which each principalcomponent explains and hence determines the principal components which are to be analysedfurther using the component matrix. An example here may be the objective of accounting for95% of the variances. In this endeavor, it would be essential to include the six principalcomponents as the cumulative variance for the 6th principal component is 95.17% (Camm et.al., 2016).Component matrix – To develop the linkage between the respective principal components andthe varying features of the utilities, this matrix is useful. Based on the absolute magnitude ofthe coefficients in the matrix, the features of high significance are identified. Take forexample principal component 3. The feature with the highest value of the coefficient is x7 andhence x7 tends to reflect this principal component. As a result, reduction of the components interms of the given features is made possible (Ragsdale et.al., 2016).Requirement for Normalisation 2
Variance Matrix - A key feature of DMVBI_2
Normalisation is a common requirement in PCA which arises as the underlying variables ofinterest have different measurement scales and hence the variable which has higher values wouldhave a corresponding greater magnitude of variance which can provide an edge in the totalvariance analysis. However, this possibility is not seen for the utility data as no variable seems tohave a very high value which undermines other variables. Also, no noticeable improvement inPCA on scaling of data is found which implies that normalisation of data has no application forthe data provided (Han, Pei & Kamber, 2011).(b) Advantages of PCA (John, 2014)It is a dimensional reduction procedure which reduces large sized dataset into fewdimensional dataset. This technique is more useful when the data variables are correlated by logical, linearrelationship. The value of correlation coefficient between the principal component and original datavariable is zero. This is based on the max- variance technique and hence, it rejects the variables that have lowvariances. This technique is more useful when the aim is to determine the actual structure of the data. The visualization in PCA is considerably easier because it provides separate path to eachprincipal component to distribute in the m-dimensional cloud. The magnitude of the principal component would be determined easily because PCAprovide orthogonal matrix which is easy to understand. Disadvantage of PCA (Shumeli et. al., 2016).The procedure of dimension reduction is based on the variance distribution of thecomponents. Hence, there is high possibility that PCA may remove the components whichshow low variance but have statistically significance to the analysis. This method is not effective for those variables which are showing non-linear relation. It is essential that data are having orthogonal projection or else the determination of realdirection of component would not be easy. This is not a useful procedure when the data are derived from separated blind source data. When the size of orthogonal matrix is high, then the computation of prominent variance ofthe principal component is a difficult task. This is not suitable technique for the data which is distributed with distribution method ratherthan Gaussian. 3
Variance Matrix - A key feature of DMVBI_3

End of preview

Want to access all the pages? Upload your documents or become a member.

Related Documents
Report on Data Mining and Visualization for Business Intelligence
|10
|1048
|94

Assignment Data Mining & Visualization for Business Intelligence
|7
|1204
|86

Data Mining & Visualization for Business Intelligence
|8
|781
|55

Data Mining and Visualization Assignment
|9
|1040
|50

Data Mining and Visualization | Assessment
|10
|1183
|87

The Advantages of PCA Method in Data Mining - Desklib
|11
|1673
|84