Hat Bonanza Case Study: Excel Automation and Data Analysis Project
VerifiedAdded on 2023/01/18
|6
|846
|62
Homework Assignment
AI Summary
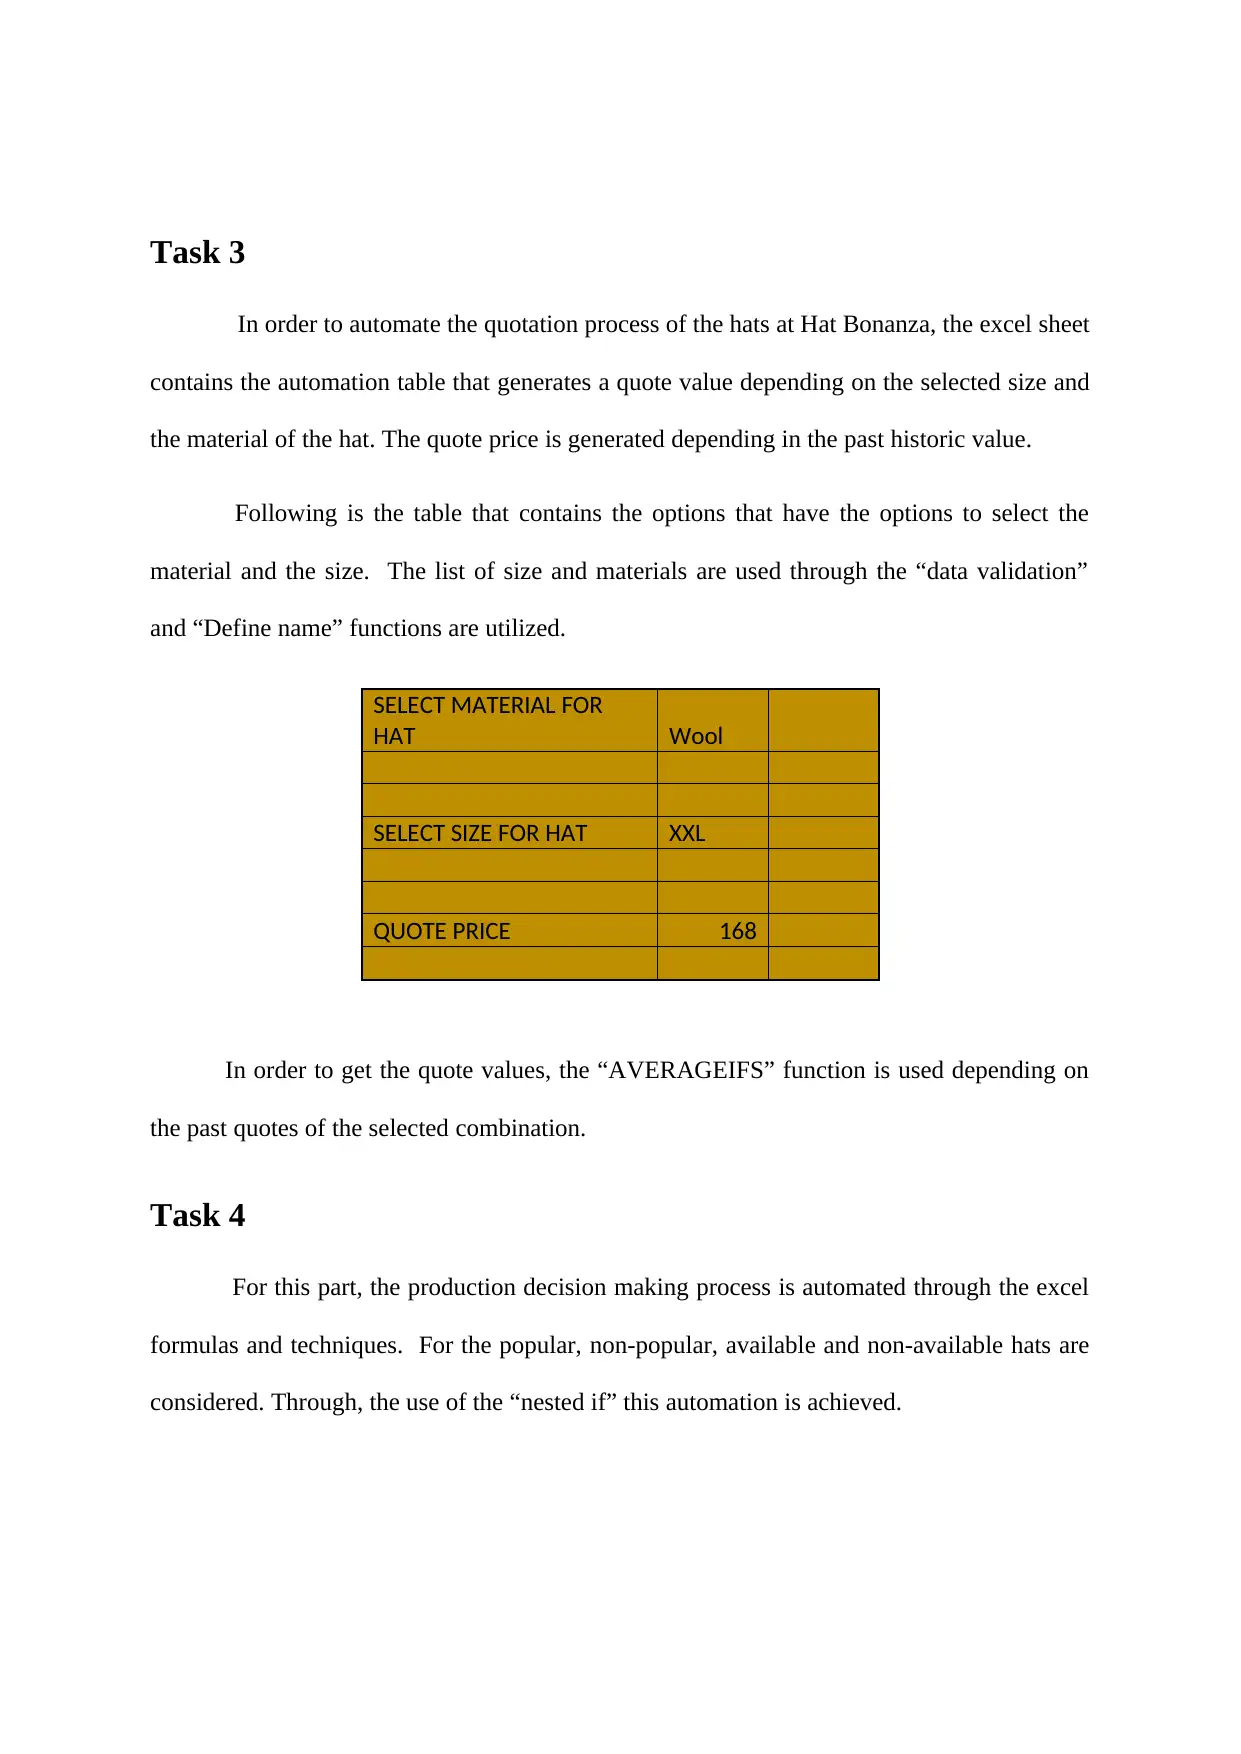
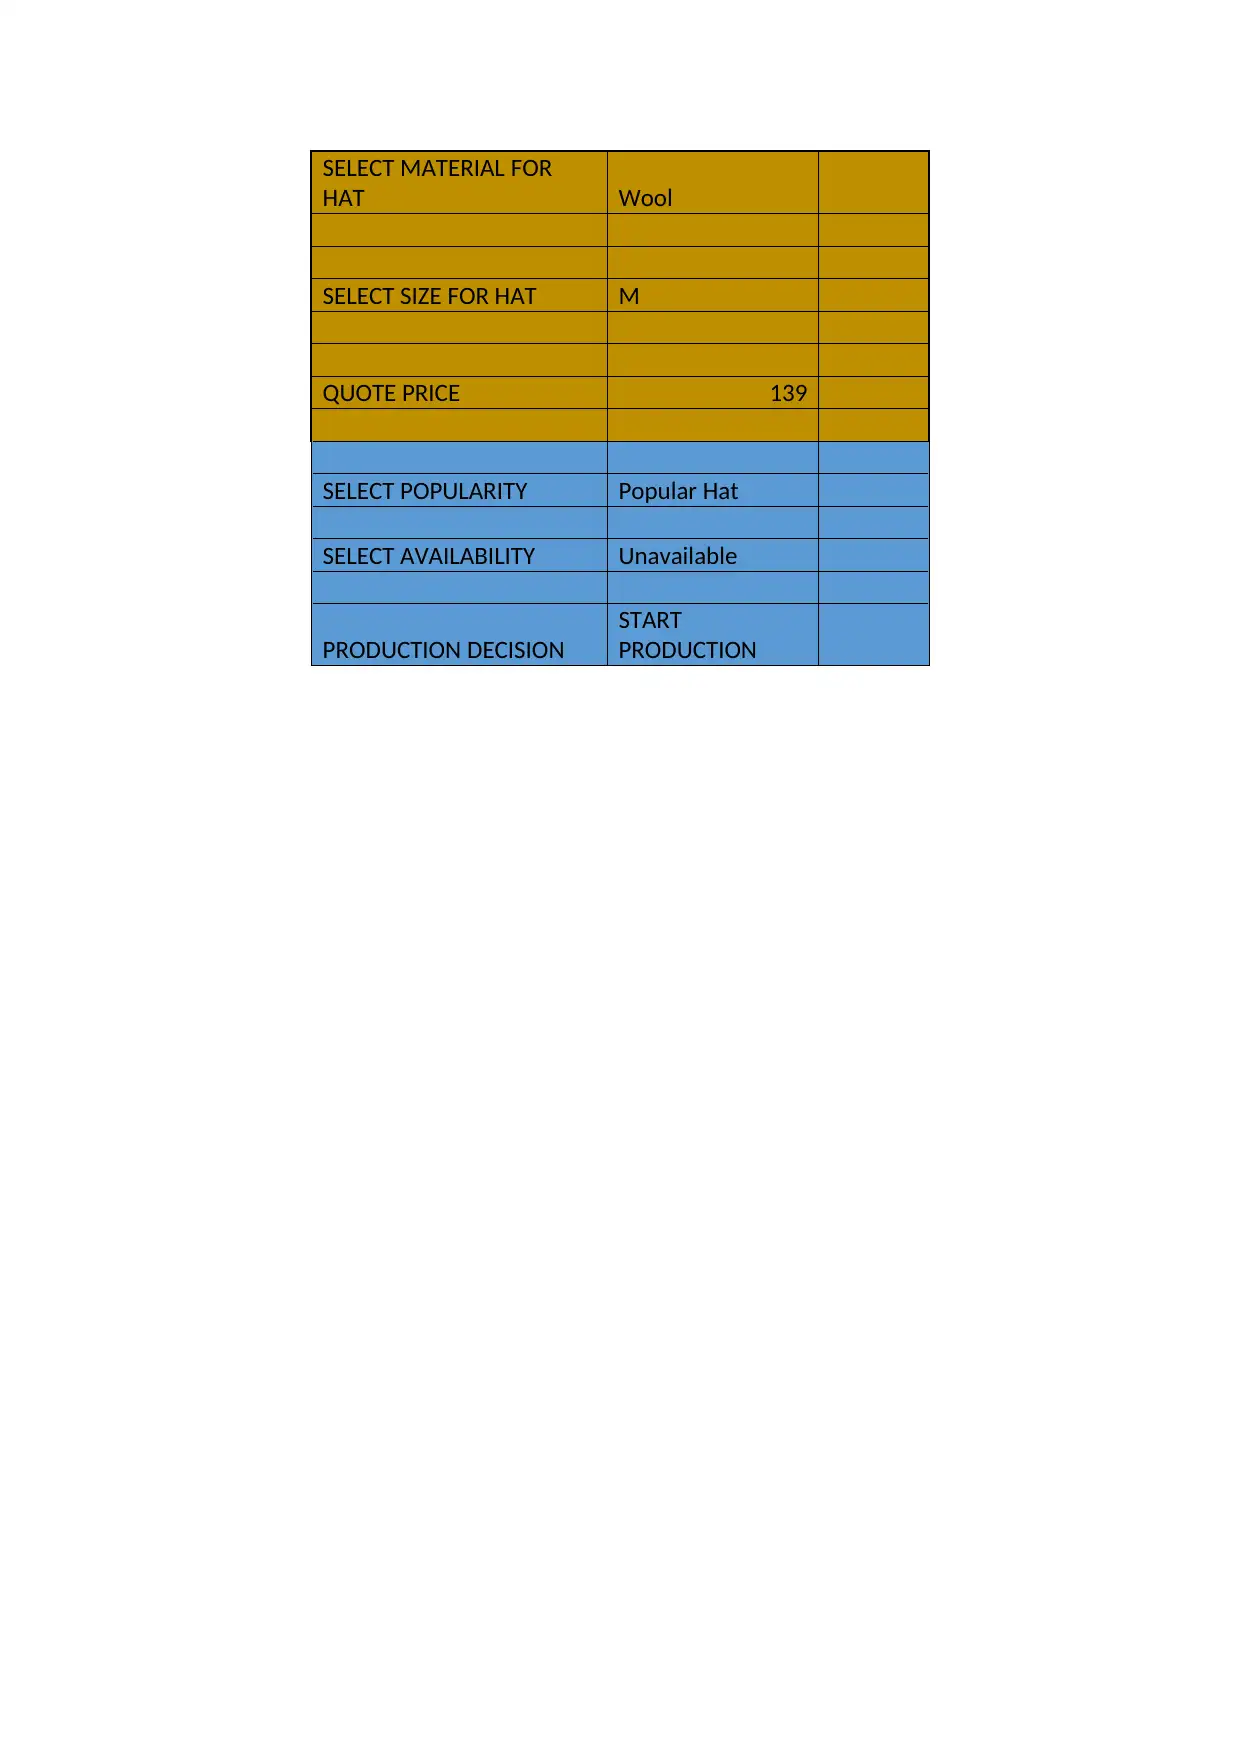
This assignment solution focuses on automating and analyzing the business processes of "Hat Bonanza" using Microsoft Excel. The solution calculates the total operational costs by considering employee salaries, replacement worker pay, and utility costs, presenting the data in a clear table. It also includes data visualization through charts that depict the distribution of quotes across different price ranges and the average profit for various hat materials. Furthermore, the assignment automates the quotation process by using the "AVERAGEIFS" function to generate quote values based on selected hat sizes and materials. Finally, it automates the production decision-making process using "nested if" statements to determine whether to start production based on the hat's popularity and availability.
1 out of 6
Related Documents


Your All-in-One AI-Powered Toolkit for Academic Success.
+13062052269
info@desklib.com
Available 24*7 on WhatsApp / Email
![[object Object]](/_next/static/media/star-bottom.7253800d.svg)
Copyright © 2020–2025 A2Z Services. All Rights Reserved. Developed and managed by ZUCOL.