SAS Visual Analytics Data Source
Added on 2022-11-24
35 Pages4825 Words288 Views
ITECH1103- Big Data and Analytics Group
Assignment
SAS Visual Analytics Data Source
Semester 1, 2019
TATA KOUSHIK
FEDERATION UNIVERSITY, AUSTRALIA
Table of Contents
Abstract...................................................................................................................................................3
Background Information......................................................................................................................4
TATA KOUSHIK.............................................................................................................................8
Conclusion...........................................................................................................................................8
1
Task 2 – Reporting / Dashboards 18 Questions.......................................................................................9
Question 2............................................................................................................................................9
Question 3............................................................................................................................................9
Question 4..........................................................................................................................................10
Question 5..........................................................................................................................................11
Question 6..........................................................................................................................................11
Question 7..........................................................................................................................................12
Question 8..........................................................................................................................................13
Question 9..........................................................................................................................................14
Question 10........................................................................................................................................15
Question 11........................................................................................................................................15
Question 12........................................................................................................................................16
Question 13........................................................................................................................................17
Question 14........................................................................................................................................17
Question 15........................................................................................................................................18
Question 16........................................................................................................................................19
Question 17........................................................................................................................................20
Question 18........................................................................................................................................21
Task 3 Additional Visualization............................................................................................................22
Finding 1: Struck Rate – Phase of Flight...........................................................................................22
Finding 2: Based on Species..............................................................................................................23
Finding 3: Finding According to Origin States vs Sky Conditions...................................................24
Finding 4: Finding According to Origin States vs Sky Conditions...................................................25
Finding 5: Top Airlines and their Cost (Size, Altitude Bin)..............................................................26
Finding 6 – Top Airlines and Their Cost (Warning Altitude Bin).....................................................27
Task 4 – Justification...........................................................................................................................27
Task 5 – Discussion of findings...........................................................................................................29
Task 6 – Executive Summary................................................................................................................30
Task 7 - The Reflection (Individual Task).............................................................................................31
(Second Group Member).................................................................................................................32
(Third Group Member)...................................................................................................................33
(Fourth Group Member).................................................................................................................34
References.............................................................................................................................................36
INDIVIDUAL REFLECTION.........................................................................................................38
2
Abstract
This project is about Federal Aviation data for bird strikes over the period of 4 years from 2014-
2018. The dataset is provided by the Federal Aviation Administration and contains 391,000
records which contain information about bird strikes incidences along with information such as
incident number, incident date, dispatch time etc. IBM Watson Analytics was used to process the
data which is an advanced data analysis and visualization tool. Watson helped us to produce
dashboards which show key findings from dataset for operational manger and CEO to help
management to utilize their resources optimally, improve their operations and services and
prevent/reduce the average incidences of bird strikes.
3
Background Information
A bird strike is best defined as an impact between the bird and an aircraft which is in flight or on a
take-off or landing move (Mohammed, et al 2013). The term is frequently extended to cover other
natural strikes including bats or ground creatures. Bird strike are considered to be normal but which
can be a huge risk to aircraft security. Bird strikes have not exclusively been a wellbeing worry to the
common aircrafts and planes but also in addition to and military flying machines/aircrafts. These
winged animal strikes happen when the moving aircrafts are nearing the ground. The forward looking
segments of an airplane which incorporate the nacelles, windshield, and wind driving edge, blower
cutting edge, and so forth are regularly most defenceless to such strikes (Daniels et al., 2018). It is
along these lines basic to guarantee that the diverse basic parts can withstand such high speed sway. In
addition, they ought to likewise be in a situation to ensure the protected arriving of the air ship after
the strike.
Confirmation guidelines, which incorporate checking the basic trustworthiness of airframes
and motors, are built up by the United States. Federal Aviation Administration (FAA) and European
Joint Aviation Authority (EJAA) (Storace, et al, 2018). These exact confirmations, which result in the
harm of models and the natural risk of utilizing genuine winged creatures, can be exorbitant and
tedious. The utilization of PC recreation to re-enact the winged animal effect on new auxiliary
segments fills in as an integral asset for the improvement of new parts by limiting the quantity of
experimental testing (Storace, et al, 2018). It permits the effect reaction of various auxiliary and
material parameters to be examined before the real creation of the models, consequently decreasing
time and cost brought about in experimental testing.
4
Impact of the bird strikes and fledgling has been a worry since they compromise the security of
the general population on board the air ship, results in expensive fixes and on account of business
airplane, a misfortune in income. It is a peril that takes steps to debilitate the open confidences
towards the flying enterprises (Mohammed, et al 2013). Universal panels, for example, the
International fledgling strike advisory group, the U.S and Italian fowl strike board, and so on., have
been framed to counter the danger presented by winged animal strikes, to all the more likely
comprehend the idea of strikes and to execute measures to forestall such strikes (Mohammed, et al
2013).
The Federal Aviation Administration (FAA) is a legislative body of the United States with
forces to direct all parts of common flight in that country just as over its encompassing worldwide
waters. Its forces incorporate the development and task of airplane terminals, air traffic the executives,
the confirmation of work force and flying machine, and the security of United States resources amid
the dispatch or re-entry of business space vehicles. Controls over neighbouring worldwide waters
were appointed to the FAA by power of the International Civil Aviation Organization.
Made in August 1958, the FAA supplanted the previous Civil Aeronautics Administration
(CAA) and later turned into an organization inside the US Department of Transportation. By giving
access to open, the mission of Government is to improve city administrations, tasks and bolster
straightforwardness and responsibility.
5
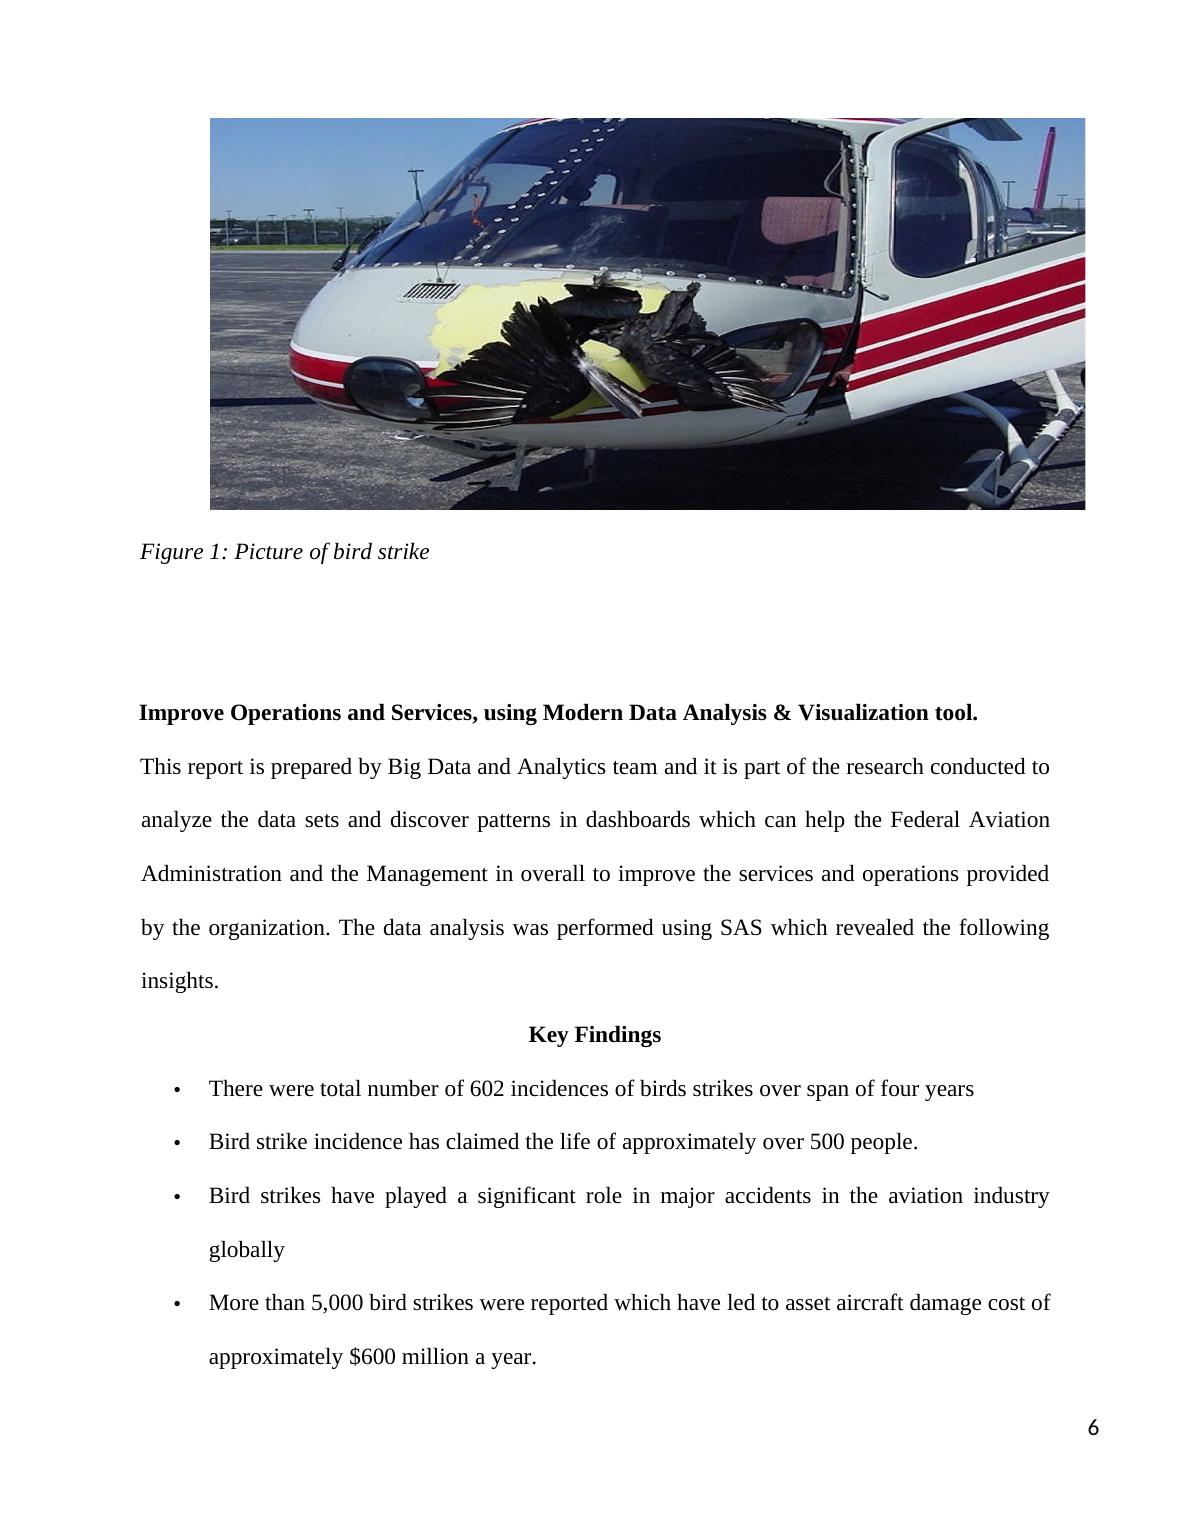
Figure 1: Picture of bird strike
Improve Operations and Services, using Modern Data Analysis & Visualization tool.
This report is prepared by Big Data and Analytics team and it is part of the research conducted to
analyze the data sets and discover patterns in dashboards which can help the Federal Aviation
Administration and the Management in overall to improve the services and operations provided
by the organization. The data analysis was performed using SAS which revealed the following
insights.
Key Findings
• There were total number of 602 incidences of birds strikes over span of four years
• Bird strike incidence has claimed the life of approximately over 500 people.
• Bird strikes have played a significant role in major accidents in the aviation industry
globally
• More than 5,000 bird strikes were reported which have led to asset aircraft damage cost of
approximately $600 million a year.
6
• The most challenging part in these incidences of bird strikes is that there is nothing that
can be done to keep away the birds from the flight path.
To achieve strategic objectives that you have set for you company, we would like to recommend
some actions based on the important data insights we have gathered regarding the analysis.
Recommendations:
• Dataset was inconsistent and on some occasions not standardised therefore, we
recommend employees use cautious approach while capturing the data and ascertain data
standardisation.
• By using the findings, aviation authorities can improve bird strike hazard mitigation
strategies, flight crews can reduce the potential of bird strikes resulting in engine failure,
and researchers can better understand the nature of bird strikes and develop a scientific
approach to minimize the likelihood of engine failure in the event of a bird strike.
• To prevent or reduce the consequences of a bird strike, the flight crew should: Discuss
bird strikes during take-off and approach briefings when operating at airports with known
or suspected bird activity.
• Birds distress signals can also be used to alert the airports authorities on the potential
occurrence of bird strikes and this will enable them develop strategies for mitigating the
incidence.
• It is also important for the airport authorities to reduce or eliminate vegetation that attracts
birds near the runway of the airport.
Sincerely,
TATA KOUSHIK
Conclusion
7
Bird strikes are serious problems facing the aviation industry globally and therefore have become a
concern to flight safety, people and aircraft. Bird strikes are one of the causes of aircraft crushes and
thus have resulted in loss of revenue. More than 200 people have been killed between 2018 to 2019.
More than 5,000 bird strikes were reported by the U.S. Currently, there is enough data on bird strikes
that before therefore it is the time to test the avoiding solutions and see what work the best.
Some of the proposed recommendations based on findings are:
Airport authorities should also be extremely vigilant if birds are reported on final approach. If birds
are expected on final approach, plan additional landing distance to account for the possibility of no
thrust reverser use if a bird strike occurs. On the other hand, airports should also consider using
pyrotechnics.
Birds distress signals can also be used to alert the airports authorities on the potential occurrence of
bird strikes and this will enable them develop strategies for mitigating the incidence. It is also
important for the airport authorities to reduce or eliminate vegetation that attracts birds near the
runway of the airport.
Task 2 – Reporting / Dashboards
18 Questions
Question 2
Figure 1: Distinct Species Involved in Bird Strike
8
End of preview
Want to access all the pages? Upload your documents or become a member.
Related Documents
Analyzing Bird Strike Data using SASlg...
|29
|1159
|369
Analyzing Bird Strike Data using SAS Analytical Toolslg...
|28
|3593
|110
Bird Strike Data and Analysislg...
|15
|1227
|422