ITECH7406: Big Data Analysis and Visualization of Energy Consumption
VerifiedAdded on 2023/06/11
|19
|3019
|479
Report
AI Summary
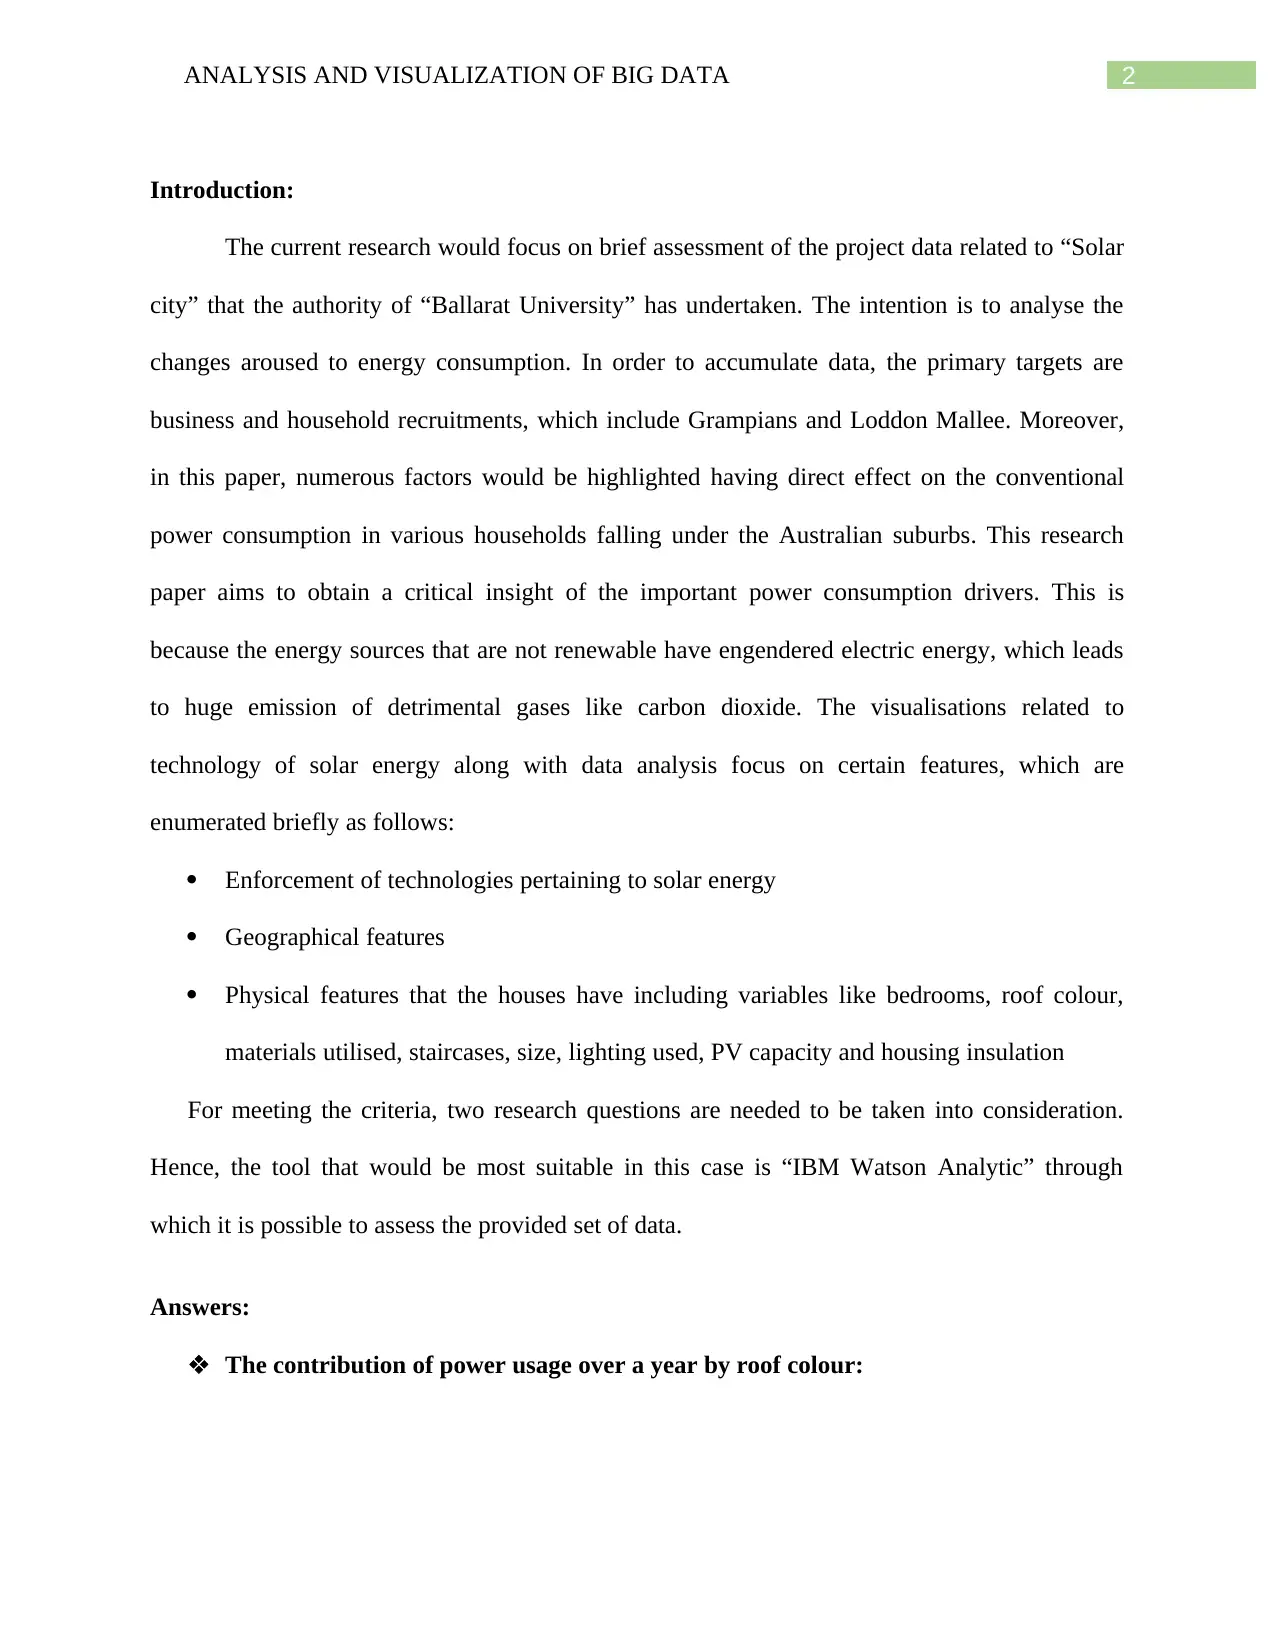
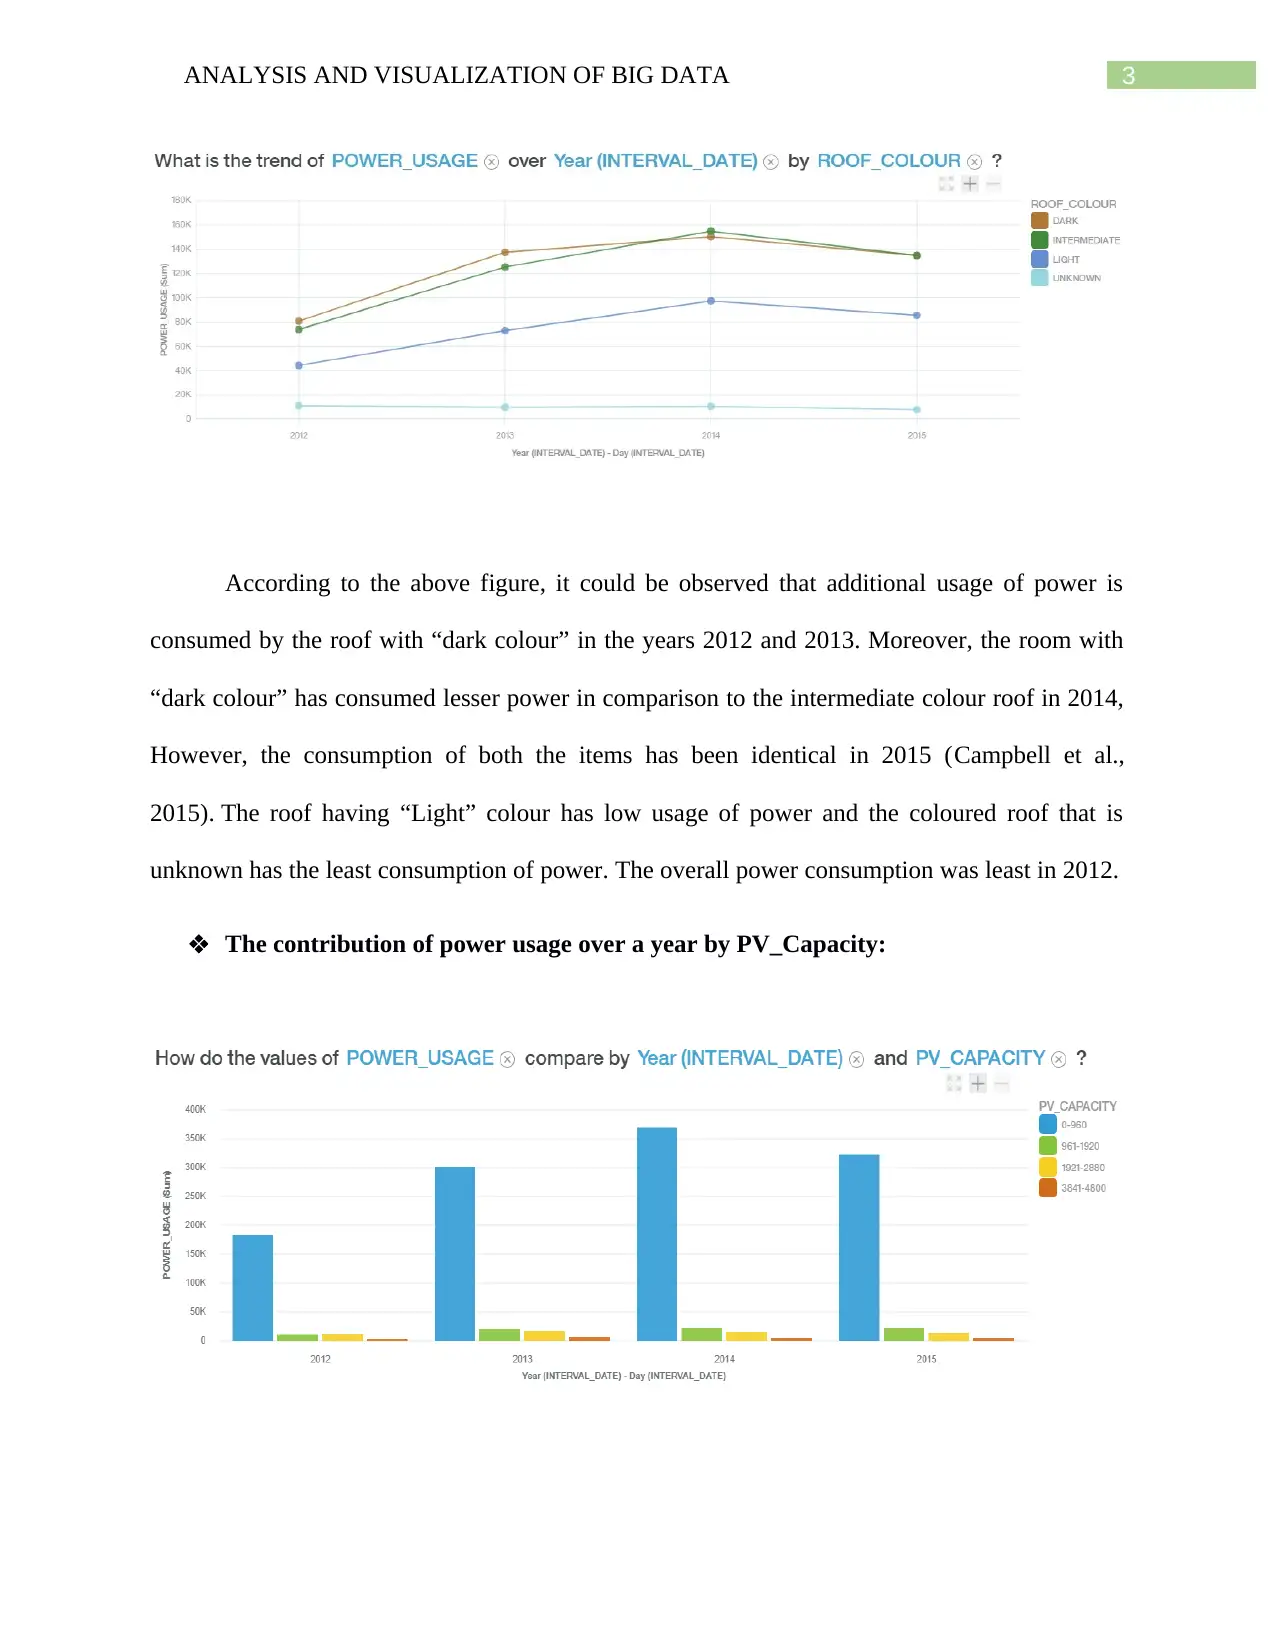
This report presents an analysis of energy consumption data related to the "Solar City" project undertaken by Ballarat University. It investigates factors influencing power usage in Australian households, focusing on geographical and physical features of houses, and solar energy technologies. The analysis utilizes IBM Watson Analytic to assess data, addressing research questions related to roof color, PV capacity, insulation, age of dwellings, and suburb. Key findings include the impact of roof color and PV capacity on power consumption, identification of top drivers of power usage like wall construction and suburb type, and insights into energy consumption patterns across different demographics and housing characteristics. The report concludes with recommendations for improving energy efficiency and reducing CO2 emissions based on the data analysis and visualizations. Desklib provides access to a variety of student-contributed assignments and study tools.

RUNNING HEAD: ANALYSIS AND VISUALIZATION OF BIG DATA
Analysis and Visualization of Big Data
Name of Student:
Name of University:
Course ID:
Analysis and Visualization of Big Data
Name of Student:
Name of University:
Course ID:
Paraphrase This Document
Need a fresh take? Get an instant paraphrase of this document with our AI Paraphraser

1ANALYSIS AND VISUALIZATION OF BIG DATA
Table of Contents
Introduction:....................................................................................................................................2
Answers:..........................................................................................................................................3
Dashboard Presentation:................................................................................................................13
Reporting:......................................................................................................................................14
Recommendation:..........................................................................................................................15
Reflection:......................................................................................................................................16
References:....................................................................................................................................17

2ANALYSIS AND VISUALIZATION OF BIG DATA
Introduction:
The current research would focus on brief assessment of the project data related to “Solar
city” that the authority of “Ballarat University” has undertaken. The intention is to analyse the
changes aroused to energy consumption. In order to accumulate data, the primary targets are
business and household recruitments, which include Grampians and Loddon Mallee. Moreover,
in this paper, numerous factors would be highlighted having direct effect on the conventional
power consumption in various households falling under the Australian suburbs. This research
paper aims to obtain a critical insight of the important power consumption drivers. This is
because the energy sources that are not renewable have engendered electric energy, which leads
to huge emission of detrimental gases like carbon dioxide. The visualisations related to
technology of solar energy along with data analysis focus on certain features, which are
enumerated briefly as follows:
Enforcement of technologies pertaining to solar energy
Geographical features
Physical features that the houses have including variables like bedrooms, roof colour,
materials utilised, staircases, size, lighting used, PV capacity and housing insulation
For meeting the criteria, two research questions are needed to be taken into consideration.
Hence, the tool that would be most suitable in this case is “IBM Watson Analytic” through
which it is possible to assess the provided set of data.
Answers:
The contribution of power usage over a year by roof colour:
⊘ This is a preview!⊘
Do you want full access?
Subscribe today to unlock all pages.

Trusted by 1+ million students worldwide

3ANALYSIS AND VISUALIZATION OF BIG DATA
According to the above figure, it could be observed that additional usage of power is
consumed by the roof with “dark colour” in the years 2012 and 2013. Moreover, the room with
“dark colour” has consumed lesser power in comparison to the intermediate colour roof in 2014,
However, the consumption of both the items has been identical in 2015 (Campbell et al.,
2015). The roof having “Light” colour has low usage of power and the coloured roof that is
unknown has the least consumption of power. The overall power consumption was least in 2012.
The contribution of power usage over a year by PV_Capacity:
Paraphrase This Document
Need a fresh take? Get an instant paraphrase of this document with our AI Paraphraser

4ANALYSIS AND VISUALIZATION OF BIG DATA
The Photo Voltaic capacity having lowest capacity ranging between 0 and 960 has the
maximum usage of power. On the contrary, the Photo Voltaic capacity having the uppermost
photo voltaic capacity ranging above 960 leads to minimised usage of power. The maximum
power usage could be observed in 2014 because the PV capacity is the lowest in the year. In
2012, considerable decline in usage of power could be observed during the year in each type of
photo voltaic capacity.
The contribution of power usage over a year by PV_Capacity and Insulation:
At 0-960 capacity of PV with an insulation of 1, the maximum power is used in 2014.
The usage of power is followed in 2013 as well as 2015, while Photo Voltaic capacity and
insulation remains same. The power usage is least for high Photo Voltaic capacity with low
insulation (Joshi et al., 2017).
The power usage by estimated age:

5ANALYSIS AND VISUALIZATION OF BIG DATA
In accordance with the above figure, it could be observed that the maximum power usage
is made by the residents of the dwellings aging “Sixty years and above”, followed by “Twenty to
twenty-nine”. The estimated age of the household between “0 years and 4 years” is observed to
have the lowermost usage of power.
The month of most power usage:
It is evident from the above figure that in July 2015, power is used at the maximum level.
The month of least power usage:
⊘ This is a preview!⊘
Do you want full access?
Subscribe today to unlock all pages.

Trusted by 1+ million students worldwide

6ANALYSIS AND VISUALIZATION OF BIG DATA
The above figure clearly states that in February, the use of power is minimal.
The top drivers of power usage:
According to the above figure, “Wall Construction” and “Suburb” types can explain the
variability of the amount of power usage mostly and simultaneously, which is 28%. In case of
“One driver” of usage of power, “Suburb” type could be deemed as the strongest predictor.
The suburbs have the most houses with pv_capacity:
Paraphrase This Document
Need a fresh take? Get an instant paraphrase of this document with our AI Paraphraser

7ANALYSIS AND VISUALIZATION OF BIG DATA
The suburb having maximum houses with capacity of PV capacity is the “Portland”
Suburb followed by “Heywood” suburb.
The age houses that are more likely to have pv_capacity:
PV_capacity could be observed in six conditions for the below stated age houses:
At 0-960 photo voltaic capacity while the projected age of the dwellings is forty and above.
The houses that are “Owned” more likely to use less power than the ones that are
“Rented”:

8ANALYSIS AND VISUALIZATION OF BIG DATA
The houses that are self-owned consume lower amount of power in comparison to those
houses that are taken on rent.
The suburb dwellings use the most power:
Among all the dwellings, the dwellings of “Portland” suburb uses maximum amount of
power and after this, comes the “Heywood” suburb.
The houses with larger square meter use more power than smaller houses, also does
“Double story” make a difference:
⊘ This is a preview!⊘
Do you want full access?
Subscribe today to unlock all pages.

Trusted by 1+ million students worldwide

9ANALYSIS AND VISUALIZATION OF BIG DATA
It is clearly inherent from the above figure that the “Single-storeyed” properties consumer
much lower power than the “Double-storeyed” properties. For “Double-storeyed” dwellings, the
usage of power on an average is greater in the area have 199 square metres. Room of this
particular size, consumes more energy for both storied dwellings.
The light types in dwellings use more power:
Additional power is consumed by the “Halogen Lights” for greater frequencies.
Having more lights of any type mean the house will use more power:
Paraphrase This Document
Need a fresh take? Get an instant paraphrase of this document with our AI Paraphraser

10ANALYSIS AND VISUALIZATION OF BIG DATA
Different kinds of lights could be observed from the above figure and they constitute of
halogen, fluorescent, LED or incandescent, in which the amount of power consumed is high with
the increase in the overall number of lights. The maximum usage of power could be observed in
the households having 11 and 17 lights. The usage is not maximum for the highest number of
lights that is 32.
The age houses have what type of wall construction:
The houses that are made up of “Brick” walls are the oldest. In addition to this, the
houses that are made up of “Fibre”, “Timber” and “Weatherboard” have high estimated age as
well.

11ANALYSIS AND VISUALIZATION OF BIG DATA
The age houses and from which areas and with how many bedrooms use the most
power:
The suburb of “Heywood” consumes the maximum amount of power in respect of their
bedrooms (1 to 20) and estimated age “Sixty and above”, the significant power usage is observed
for “Casterton”. In case of the same amount of bedrooms and estimated age 15 and 19 years, the
maximum usage of power could be observed in “Heywood”.
Roof colour and roof material make difference to power consumption:
The maximum consumption of power is obtained in case of “Concrete block” walls with
“Dark” roof colour. Such consumption is followed by Timber-made walls and “Dark” roof
colour.
⊘ This is a preview!⊘
Do you want full access?
Subscribe today to unlock all pages.

Trusted by 1+ million students worldwide
1 out of 19
Related Documents
Your All-in-One AI-Powered Toolkit for Academic Success.
+13062052269
info@desklib.com
Available 24*7 on WhatsApp / Email
Unlock your academic potential
Copyright © 2020–2025 A2Z Services. All Rights Reserved. Developed and managed by ZUCOL.


