JB Hi Fi Ltd Financial Analysis Report: ACC00724, S2 2018

Verified

Added on  2023/06/10

|7
|1775
|474
Report
AI Summary
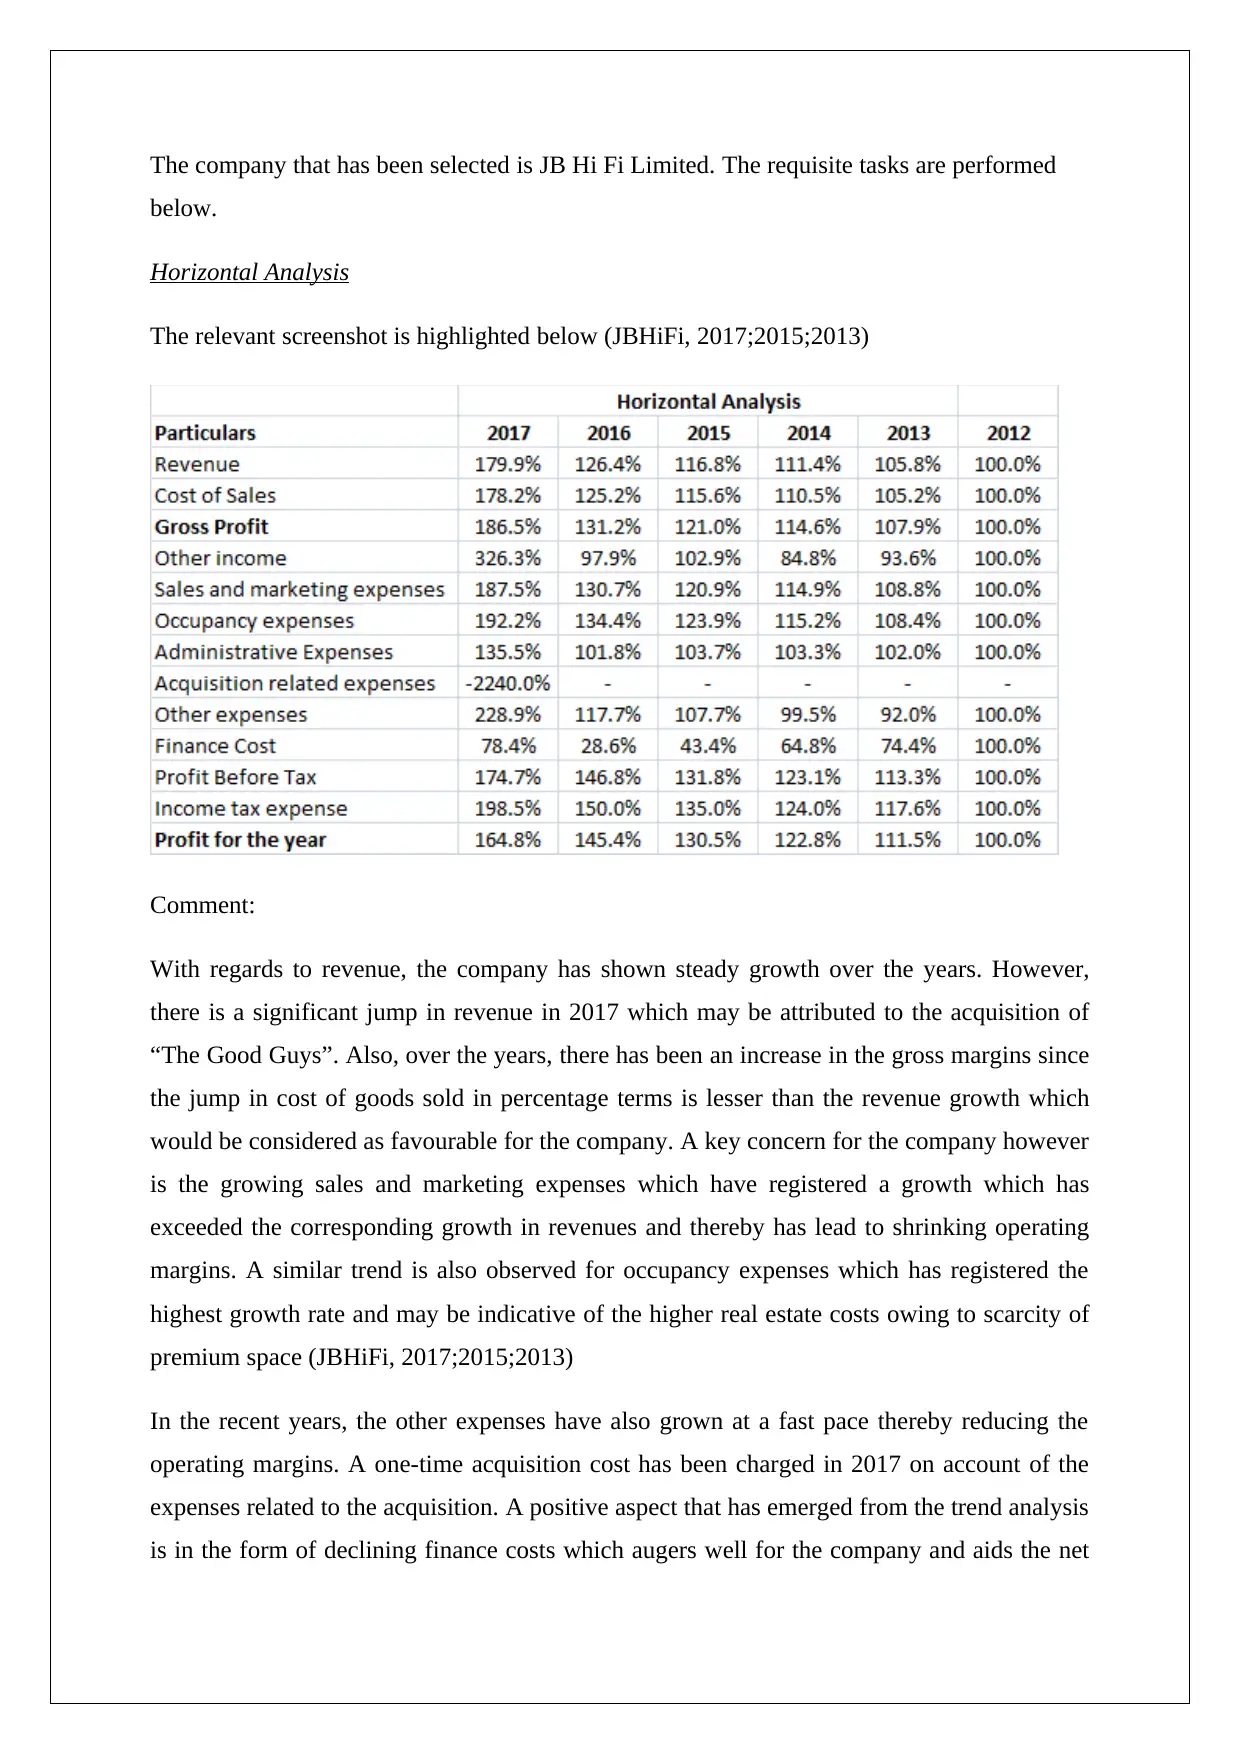
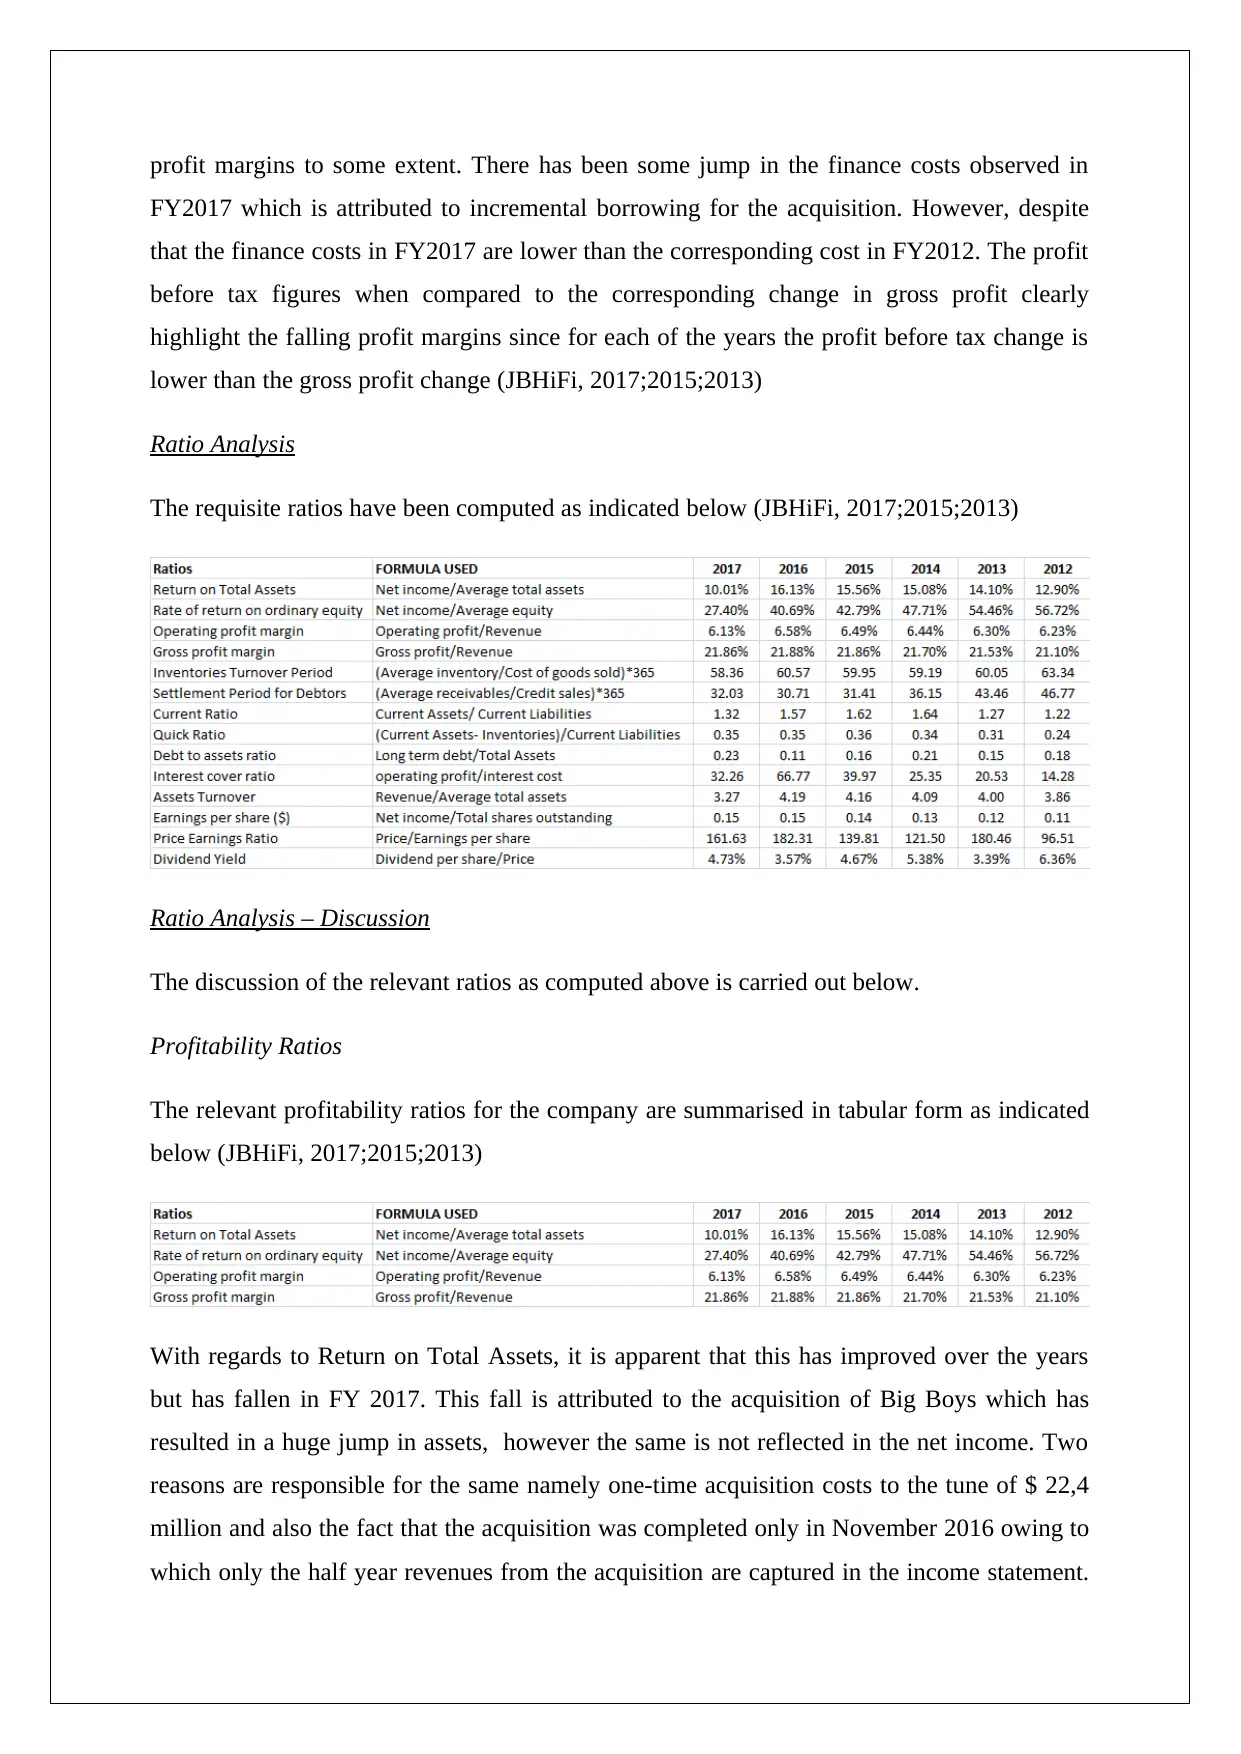
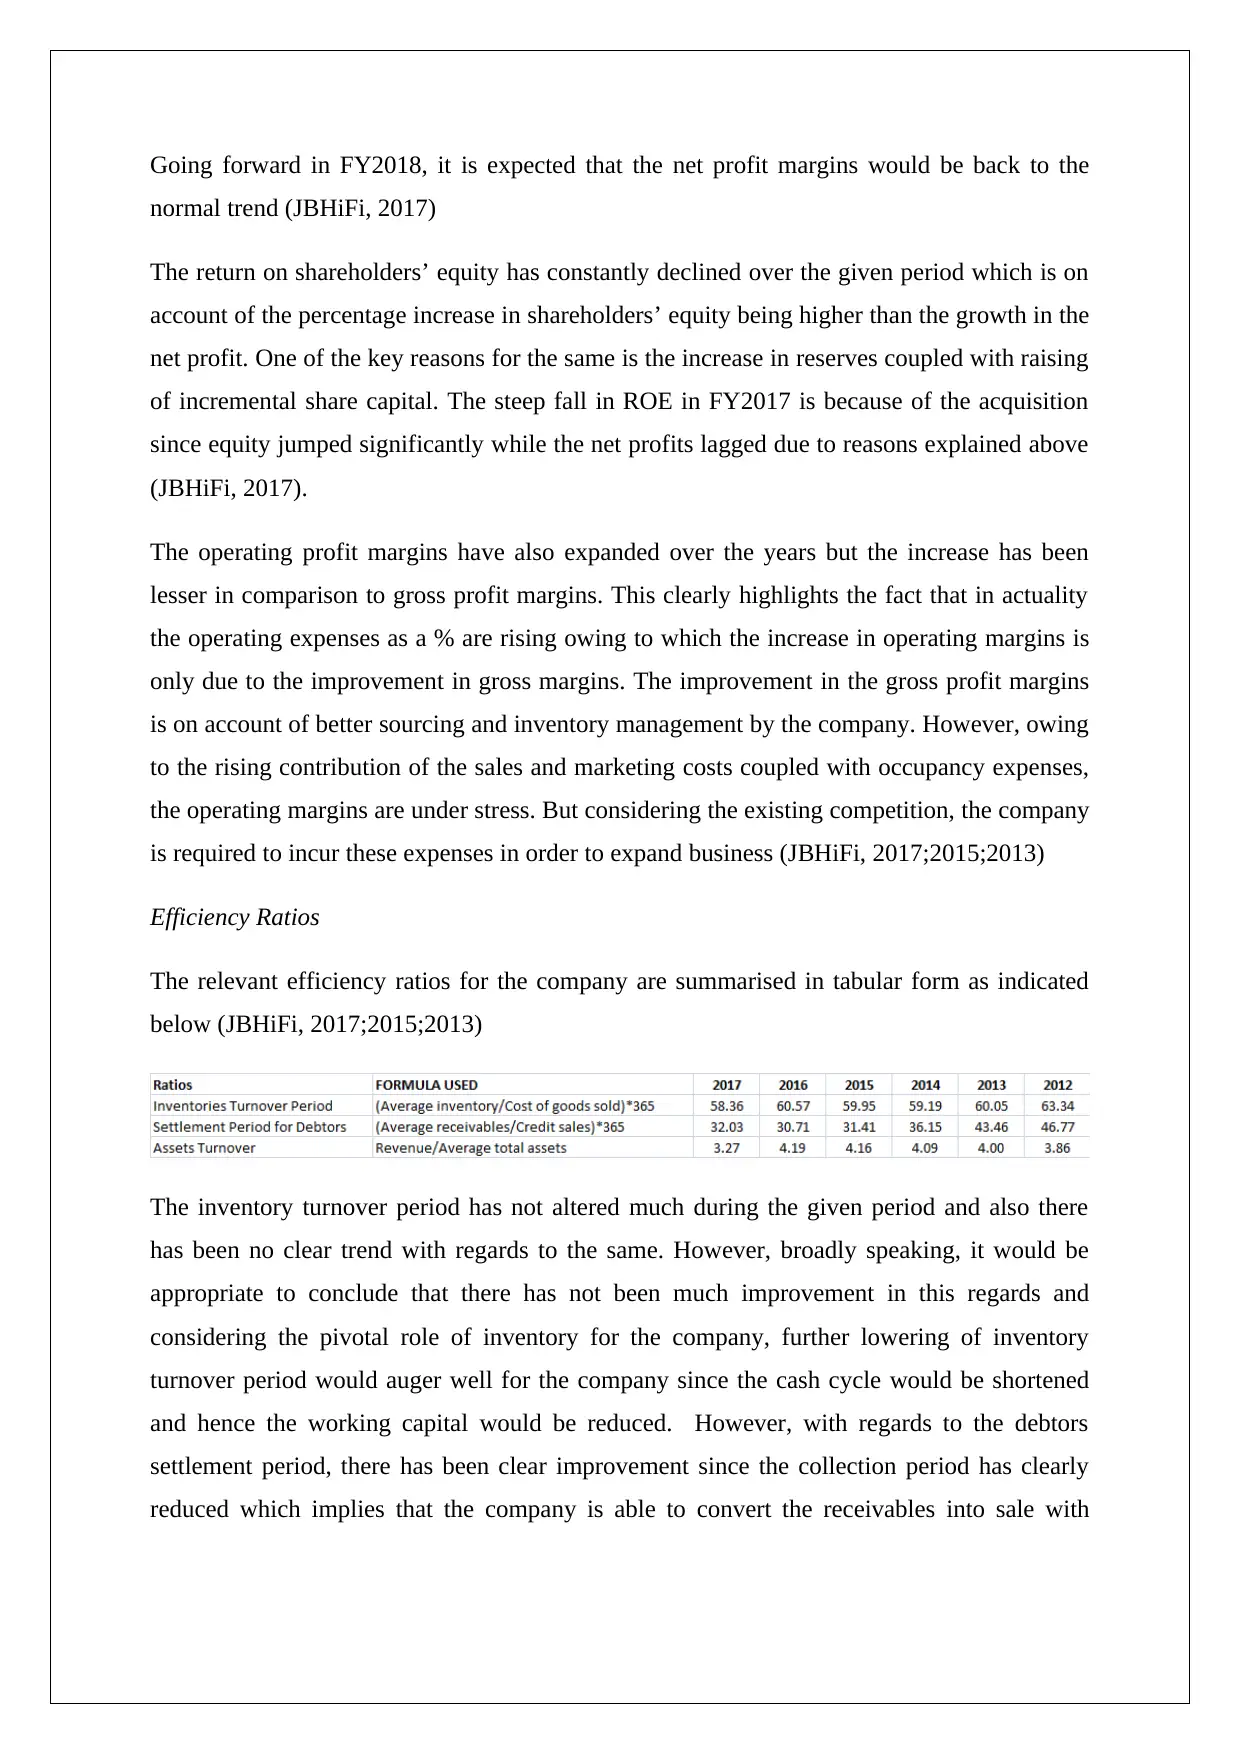
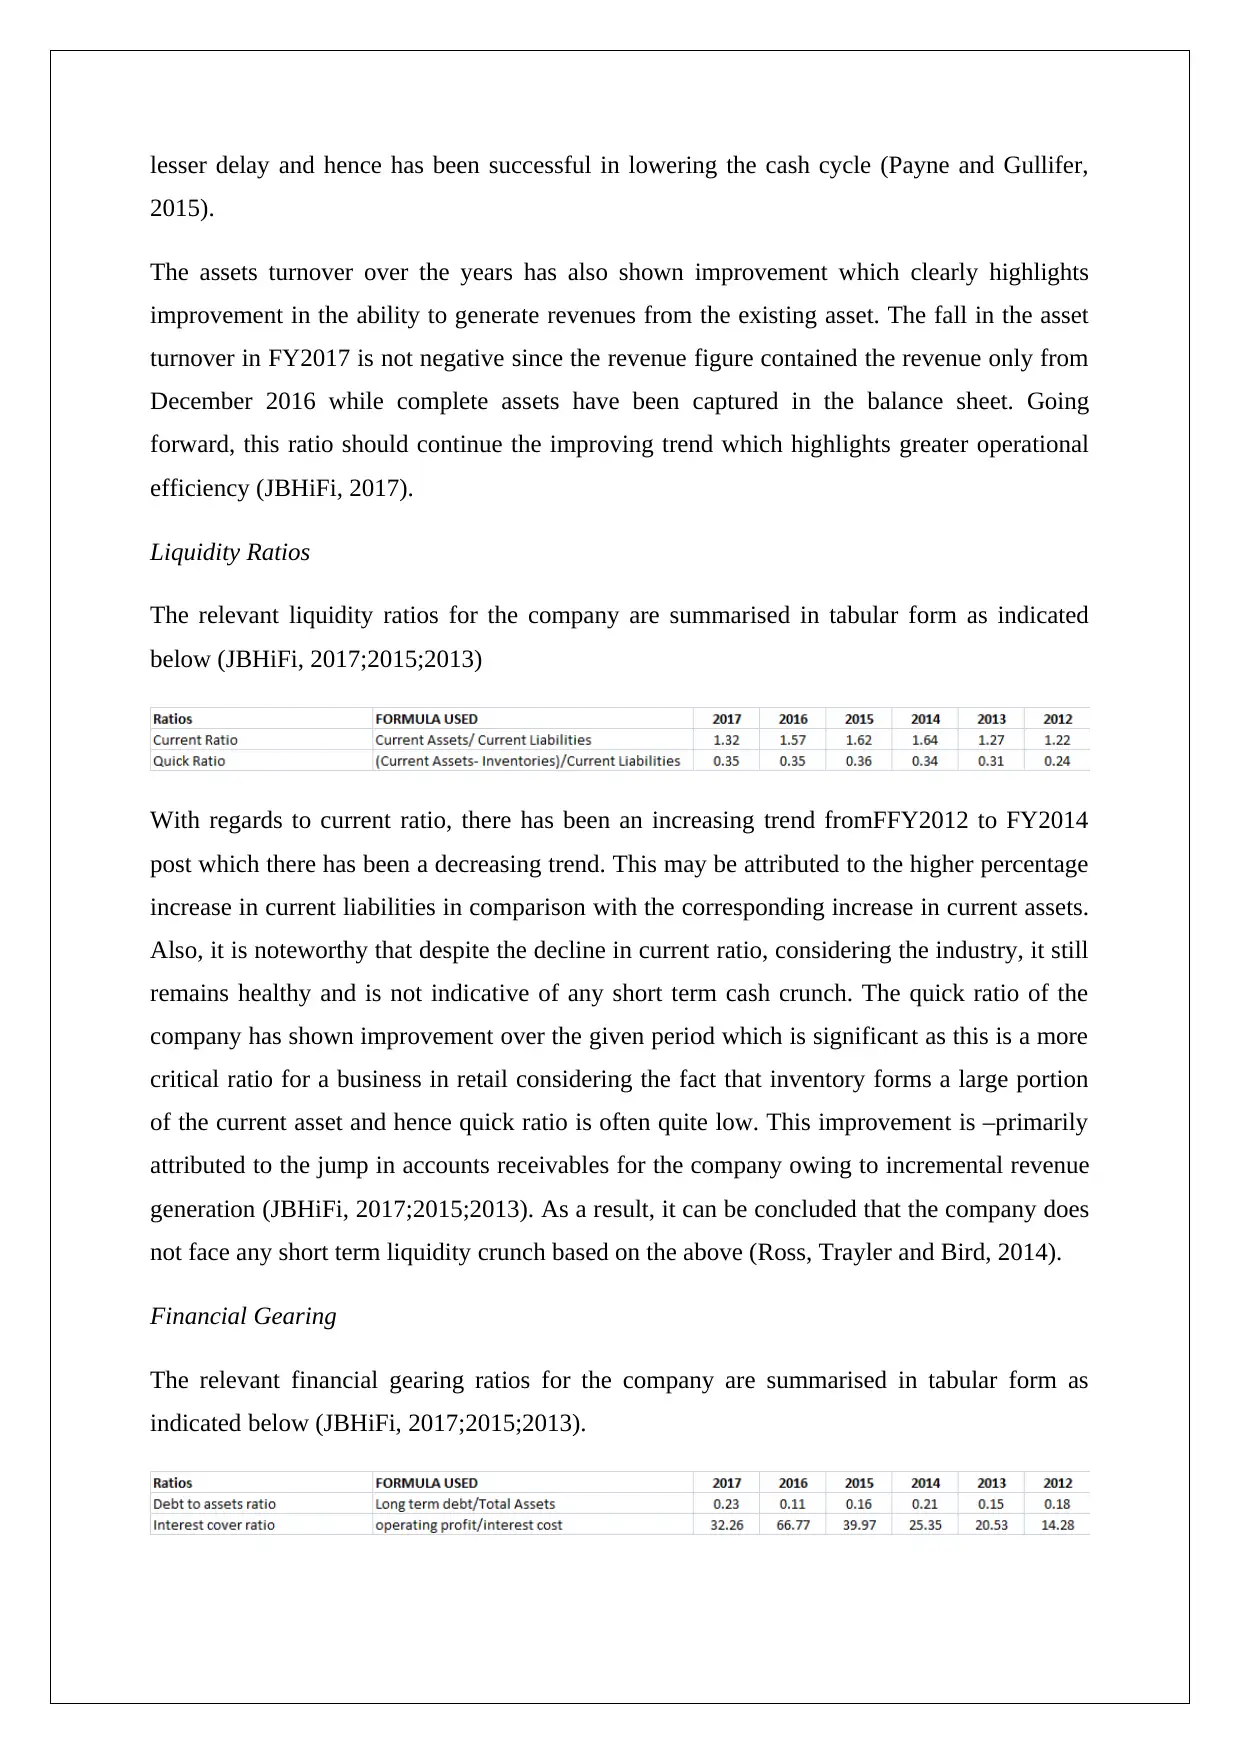
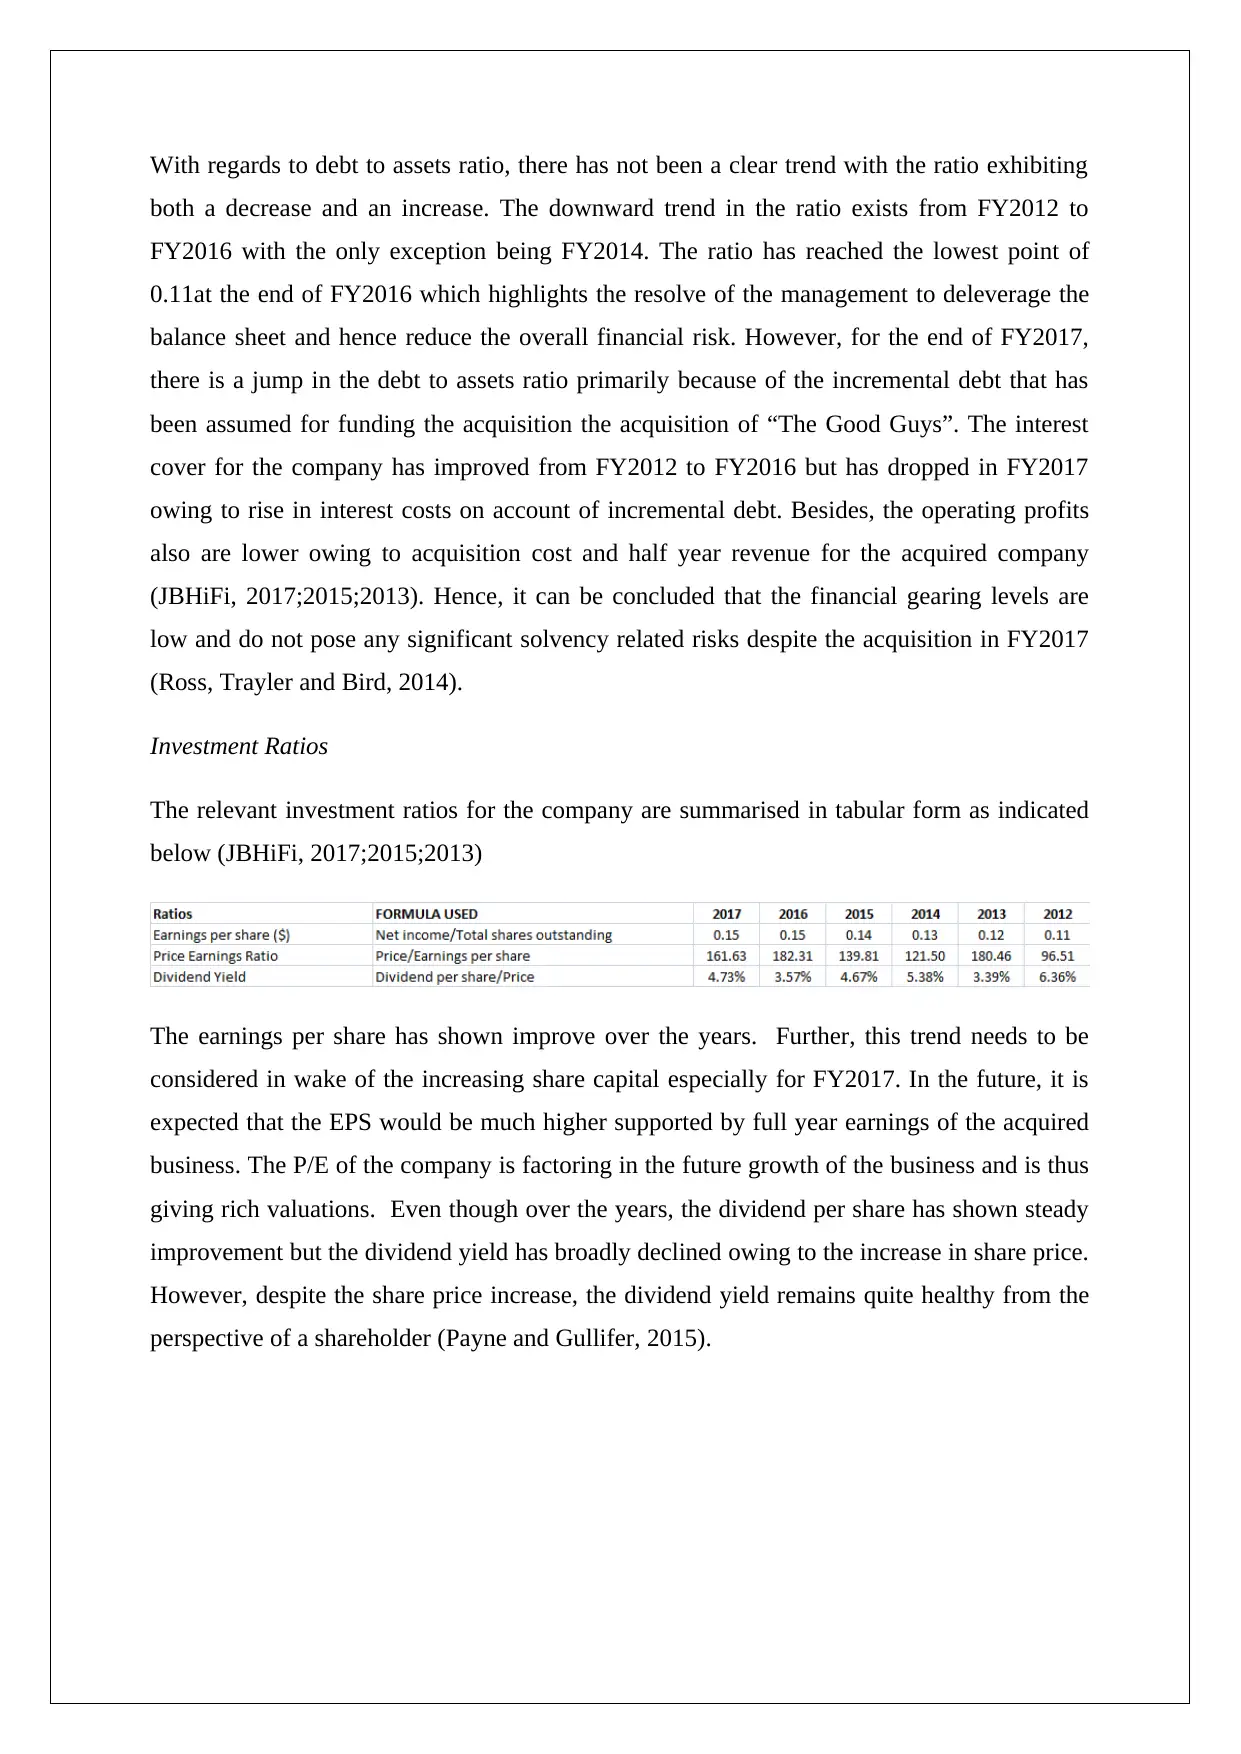
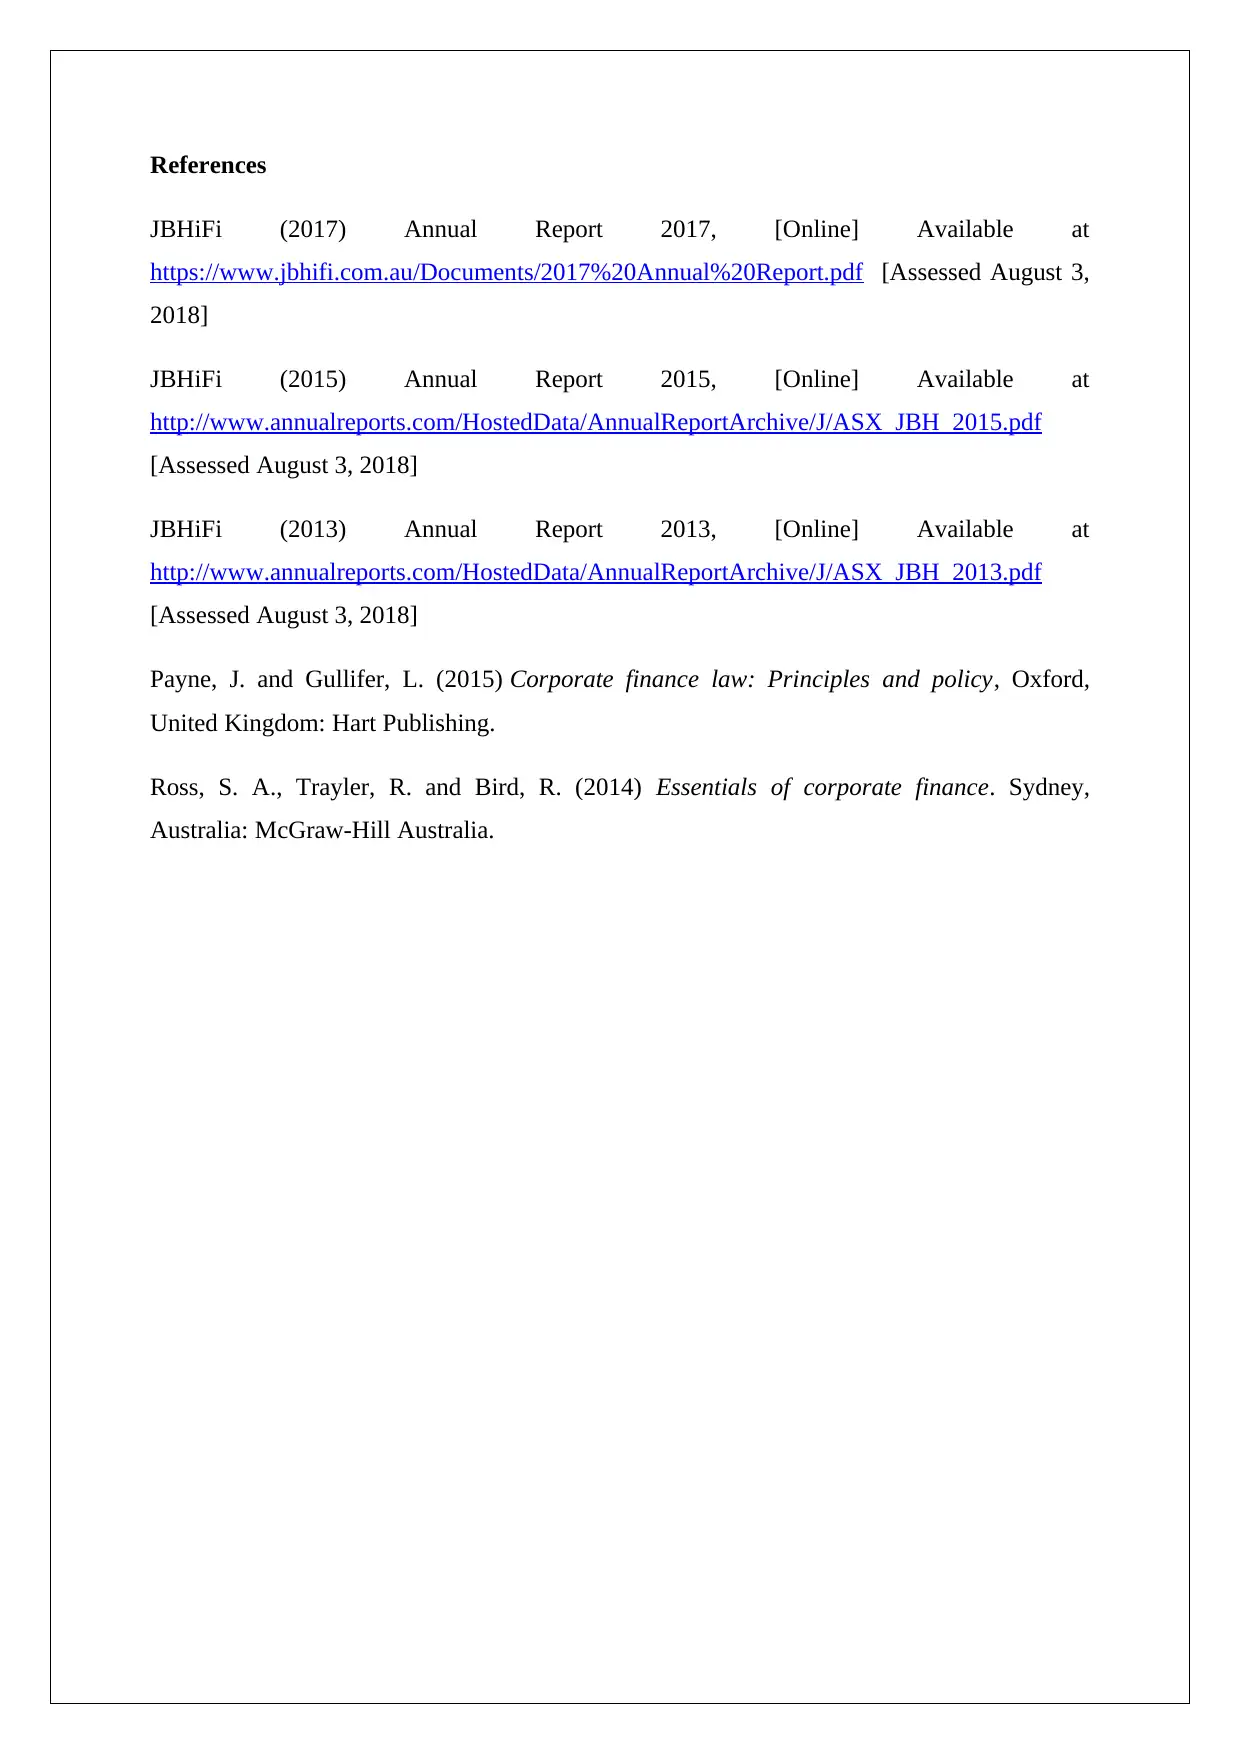
This report provides a detailed financial analysis of JB Hi Fi Limited, examining its performance from 2013 to 2017. The analysis includes a horizontal analysis of the income statement, highlighting revenue growth, changes in gross margins, and the impact of sales, marketing, and occupancy expenses. Ratio analysis is conducted, covering profitability ratios (Return on Total Assets, Return on Shareholders' Equity, and operating profit margins), efficiency ratios (inventory turnover period, debtors settlement period, and asset turnover), liquidity ratios (current ratio and quick ratio), financial gearing ratios (debt to assets ratio and interest cover), and investment ratios (earnings per share, P/E ratio, and dividend yield). The report discusses the trends and implications of these ratios, considering factors such as acquisitions, changes in debt levels, and the company's overall financial health. The analysis uses data from JB Hi Fi's annual reports and references relevant financial literature to support the findings.
Document Page
ACCOUNTING FOR MANAGERS
Jb Hi Fi Limited
STUDENT ID:
[Pick the date]
tabler-icon-diamond-filled.svg

Paraphrase This Document

Need a fresh take? Get an instant paraphrase of this document with our AI Paraphraser
Document Page
The company that has been selected is JB Hi Fi Limited. The requisite tasks are performed
below.
Horizontal Analysis
The relevant screenshot is highlighted below (JBHiFi, 2017;2015;2013)
Comment:
With regards to revenue, the company has shown steady growth over the years. However,
there is a significant jump in revenue in 2017 which may be attributed to the acquisition of
“The Good Guys”. Also, over the years, there has been an increase in the gross margins since
the jump in cost of goods sold in percentage terms is lesser than the revenue growth which
would be considered as favourable for the company. A key concern for the company however
is the growing sales and marketing expenses which have registered a growth which has
exceeded the corresponding growth in revenues and thereby has lead to shrinking operating
margins. A similar trend is also observed for occupancy expenses which has registered the
highest growth rate and may be indicative of the higher real estate costs owing to scarcity of
premium space (JBHiFi, 2017;2015;2013)
In the recent years, the other expenses have also grown at a fast pace thereby reducing the
operating margins. A one-time acquisition cost has been charged in 2017 on account of the
expenses related to the acquisition. A positive aspect that has emerged from the trend analysis
is in the form of declining finance costs which augers well for the company and aids the net
Document Page
profit margins to some extent. There has been some jump in the finance costs observed in
FY2017 which is attributed to incremental borrowing for the acquisition. However, despite
that the finance costs in FY2017 are lower than the corresponding cost in FY2012. The profit
before tax figures when compared to the corresponding change in gross profit clearly
highlight the falling profit margins since for each of the years the profit before tax change is
lower than the gross profit change (JBHiFi, 2017;2015;2013)
Ratio Analysis
The requisite ratios have been computed as indicated below (JBHiFi, 2017;2015;2013)
Ratio Analysis – Discussion
The discussion of the relevant ratios as computed above is carried out below.
Profitability Ratios
The relevant profitability ratios for the company are summarised in tabular form as indicated
below (JBHiFi, 2017;2015;2013)
With regards to Return on Total Assets, it is apparent that this has improved over the years
but has fallen in FY 2017. This fall is attributed to the acquisition of Big Boys which has
resulted in a huge jump in assets, however the same is not reflected in the net income. Two
reasons are responsible for the same namely one-time acquisition costs to the tune of $ 22,4
million and also the fact that the acquisition was completed only in November 2016 owing to
which only the half year revenues from the acquisition are captured in the income statement.
Document Page
Going forward in FY2018, it is expected that the net profit margins would be back to the
normal trend (JBHiFi, 2017)
The return on shareholders’ equity has constantly declined over the given period which is on
account of the percentage increase in shareholders’ equity being higher than the growth in the
net profit. One of the key reasons for the same is the increase in reserves coupled with raising
of incremental share capital. The steep fall in ROE in FY2017 is because of the acquisition
since equity jumped significantly while the net profits lagged due to reasons explained above
(JBHiFi, 2017).
The operating profit margins have also expanded over the years but the increase has been
lesser in comparison to gross profit margins. This clearly highlights the fact that in actuality
the operating expenses as a % are rising owing to which the increase in operating margins is
only due to the improvement in gross margins. The improvement in the gross profit margins
is on account of better sourcing and inventory management by the company. However, owing
to the rising contribution of the sales and marketing costs coupled with occupancy expenses,
the operating margins are under stress. But considering the existing competition, the company
is required to incur these expenses in order to expand business (JBHiFi, 2017;2015;2013)
Efficiency Ratios
The relevant efficiency ratios for the company are summarised in tabular form as indicated
below (JBHiFi, 2017;2015;2013)
The inventory turnover period has not altered much during the given period and also there
has been no clear trend with regards to the same. However, broadly speaking, it would be
appropriate to conclude that there has not been much improvement in this regards and
considering the pivotal role of inventory for the company, further lowering of inventory
turnover period would auger well for the company since the cash cycle would be shortened
and hence the working capital would be reduced. However, with regards to the debtors
settlement period, there has been clear improvement since the collection period has clearly
reduced which implies that the company is able to convert the receivables into sale with
tabler-icon-diamond-filled.svg

Paraphrase This Document

Need a fresh take? Get an instant paraphrase of this document with our AI Paraphraser
Document Page
lesser delay and hence has been successful in lowering the cash cycle (Payne and Gullifer,
2015).
The assets turnover over the years has also shown improvement which clearly highlights
improvement in the ability to generate revenues from the existing asset. The fall in the asset
turnover in FY2017 is not negative since the revenue figure contained the revenue only from
December 2016 while complete assets have been captured in the balance sheet. Going
forward, this ratio should continue the improving trend which highlights greater operational
efficiency (JBHiFi, 2017).
Liquidity Ratios
The relevant liquidity ratios for the company are summarised in tabular form as indicated
below (JBHiFi, 2017;2015;2013)
With regards to current ratio, there has been an increasing trend fromFFY2012 to FY2014
post which there has been a decreasing trend. This may be attributed to the higher percentage
increase in current liabilities in comparison with the corresponding increase in current assets.
Also, it is noteworthy that despite the decline in current ratio, considering the industry, it still
remains healthy and is not indicative of any short term cash crunch. The quick ratio of the
company has shown improvement over the given period which is significant as this is a more
critical ratio for a business in retail considering the fact that inventory forms a large portion
of the current asset and hence quick ratio is often quite low. This improvement is –primarily
attributed to the jump in accounts receivables for the company owing to incremental revenue
generation (JBHiFi, 2017;2015;2013). As a result, it can be concluded that the company does
not face any short term liquidity crunch based on the above (Ross, Trayler and Bird, 2014).
Financial Gearing
The relevant financial gearing ratios for the company are summarised in tabular form as
indicated below (JBHiFi, 2017;2015;2013).
Document Page
With regards to debt to assets ratio, there has not been a clear trend with the ratio exhibiting
both a decrease and an increase. The downward trend in the ratio exists from FY2012 to
FY2016 with the only exception being FY2014. The ratio has reached the lowest point of
0.11at the end of FY2016 which highlights the resolve of the management to deleverage the
balance sheet and hence reduce the overall financial risk. However, for the end of FY2017,
there is a jump in the debt to assets ratio primarily because of the incremental debt that has
been assumed for funding the acquisition the acquisition of “The Good Guys”. The interest
cover for the company has improved from FY2012 to FY2016 but has dropped in FY2017
owing to rise in interest costs on account of incremental debt. Besides, the operating profits
also are lower owing to acquisition cost and half year revenue for the acquired company
(JBHiFi, 2017;2015;2013). Hence, it can be concluded that the financial gearing levels are
low and do not pose any significant solvency related risks despite the acquisition in FY2017
(Ross, Trayler and Bird, 2014).
Investment Ratios
The relevant investment ratios for the company are summarised in tabular form as indicated
below (JBHiFi, 2017;2015;2013)
The earnings per share has shown improve over the years. Further, this trend needs to be
considered in wake of the increasing share capital especially for FY2017. In the future, it is
expected that the EPS would be much higher supported by full year earnings of the acquired
business. The P/E of the company is factoring in the future growth of the business and is thus
giving rich valuations. Even though over the years, the dividend per share has shown steady
improvement but the dividend yield has broadly declined owing to the increase in share price.
However, despite the share price increase, the dividend yield remains quite healthy from the
perspective of a shareholder (Payne and Gullifer, 2015).
Document Page
References
JBHiFi (2017) Annual Report 2017, [Online] Available at
https://www.jbhifi.com.au/Documents/2017%20Annual%20Report.pdf [Assessed August 3,
2018]
JBHiFi (2015) Annual Report 2015, [Online] Available at
http://www.annualreports.com/HostedData/AnnualReportArchive/J/ASX_JBH_2015.pdf
[Assessed August 3, 2018]
JBHiFi (2013) Annual Report 2013, [Online] Available at
http://www.annualreports.com/HostedData/AnnualReportArchive/J/ASX_JBH_2013.pdf
[Assessed August 3, 2018]
Payne, J. and Gullifer, L. (2015) Corporate finance law: Principles and policy, Oxford,
United Kingdom: Hart Publishing.
Ross, S. A., Trayler, R. and Bird, R. (2014) Essentials of corporate finance. Sydney,
Australia: McGraw-Hill Australia.
chevron_up_icon
1 out of 7
circle_padding
hide_on_mobile
zoom_out_icon
[object Object]