Crime, the Criminal Justice System, and Socioeconomic Inequality
Review 8 journal articles discussing issues with respect to the Canadian Criminal Justice System and the administration of this system.
24 Pages12850 Words413 Views
Added on 2023-04-21
About This Document
This article explores the relationship between crime, the criminal justice system, and socioeconomic inequality in the United States. It discusses the decline in crime rates and the simultaneous increase in incarceration rates, highlighting the disproportionate impact on poor and minority communities. The article also examines the role of incarceration in reducing crime and suggests that public policy should focus on reducing crime and inequality in victimization.
Crime, the Criminal Justice System, and Socioeconomic Inequality
Review 8 journal articles discussing issues with respect to the Canadian Criminal Justice System and the administration of this system.
Added on 2023-04-21
ShareRelated Documents
Journal of Economic Perspectives—Volume 30, Number 2—Spring 2016—Pages 103–126
After peaking in the early 1990s, official measures of violent and property
crime rates have dropped to levels not seen since the 1960s. Proportional
declines in the most serious offenses have been particularly pronounced.
For example, murders/manslaughter per 100,000 declined by more than half,
from 9.8 in 1991 to 4.5 in 2014, the lowest recorded murder rate since 1960. The
violent crime rate overall fell by approximately half over this period, while overall
property crime rates fell by nearly 50 percent. Juxtaposed against this declining
crime rate has been an enormous and unprecedented expansion in US correc-
tional populations. Between 1980 and 2013, the prison incarceration rate increased
nearly 3.5 times, the jail incarceration rate increased by nearly three times, while
the community correction supervision rate (numbers of people on probation or
parole per 100,000) increased by 2.6 times. By 2013, roughly 3 percent of the adult
population in the United States was under some form of criminal justice supervi-
sion. During this time period, the United States transitioned from a nation with
an incarceration rate slightly higher than that of western European nations to the
nation with the highest incarceration rate in the world.
These two coinciding trends present a provocative contrast, illustrating the
conflicting manner in which changes in crime and punishment over the past few
decades have impacted socioeconomic inequality in the United States. As we will
Crime, the Criminal Justice System, and
Socioeconomic Inequality
■ Magnus Lofstrom is a Senior Fellow, Public Policy Institute of California, San Francisco,
California. Steven Raphael is Professor of Public Policy, Goldman School of Public Policy,
University of California, Berkeley, California. Their email addresses are lofstrom@ppic.org
and stevenraphael@berkeley.edu.
† For supplementary materials such as appendices, datasets, and author disclosure statements, see the
article page at
http://dx.doi.org/10.1257/jep.30.2.103 doi=10.1257/jep.30.2.103
Magnus Lofstrom and Steven Raphael
104 Journal of Economic Perspectives
show, crime rates declined the most in poorer and more minority cities, and within
cities in the poorest neighborhoods. In other words, the benefits of the crime
decline have been progressively distributed. By contrast, the social costs created
by the unprecedented expansion in correctional populations have been regres-
sively distributed, with poor, disproportionately minority males (African-American
males in particular) being most directly impacted and poor minority families (again
African-American families in particular) disproportionately bearing the collateral
social costs of the stiffening of US sentencing policy.
There is an ongoing debate on the extent to which the rise in incarceration and
the extended reach of the criminal justice system drove recent declines in crime.
There is fairly strong evidence for the United States and other nations that incarcer-
ation can have sizeable effects in reducing crime, operating largely through physical
incapacitation. These effects, however, diminish with scale. Expanding the use of
incarceration along the intensive margin of longer sentences results in the incar-
ceration of individuals into advanced ages when the propensity to offend declines,
while expanding along the extensive margin will lead to the incarceration of indi-
viduals who are less criminally active. There is less evidence that the more extensive
use of probation, and the increased propensity of courts to levy fines and fees on
those convicted of serious and less-serious criminal offenses, have contributed to
crime declines.
In what follows, we document that poor and minority communities have dispro-
portionately experienced both the decline in crime and the increase in criminal justice
sanctioning. We argue that the coincidence of these two trends do not necessarily
mean that one has caused the other. In particular, the crime decline commencing
in the early 1990s is observed in other countries that have not greatly expanded the
scope and reach of their criminal justice systems. Moreover, while increases in incar-
ceration during the 1980s likely suppressed peak crime rates in the early 1990s, the
decline in crime since that time corresponds to a period of rapid growth in incar-
ceration levels for which there is little evidence of an appreciable impact on crime.
Finally, the recent experiences of several states with reducing incarceration suggest
that the contribution of higher incarceration rates to crime abatement is limited at
current levels. The experience of California where the state was forced by a federal
court to reduce its incarceration rate to 1990 levels is particularly instructive. In the
conclusion, we argue that public policy can and should pursue ongoing reductions
in crime and in the inequality of crime victimization, while simultaneously seeking to
reduce the inequality of criminal justice sanctioning.
Inequality in Criminal Victimization
There are two principal sources of crime data in the United States. First, the
Uniform Crime Reports (UCR) provide counts of crimes known to the police by
month and crime type. Second, the National Crime Victimization Survey (NCVS)
provides crime rate estimates based on an annual household survey conducted by
Magnus Lofstrom and Steven Raphael 105
the US Census Bureau. Crime rates tabulated from the NCVS tend to be higher
than those tabulated from the UCR due to underreporting of crimes to the police.
In addition, there can be notable differences in trend estimates from these two
data sources. For example, during the 1970s and 1980s, the NCVS shows overall
decreases in crime while crime rates as measured by the UCR increase substantially. 1
In recent years, trends in these two data sources tend to align. Both suggest an
increase in serious violent crime during the 1980s. As we will soon see, both show
very pronounced declines in crime and victimization since the early 1990s. The
simultaneous analysis of these two data sources permits a more complete picture of
how crime/victimization risk varies with socioeconomic characteristics.
Figure 1 presents rates of property crime and violent crime, both expressed as
the number of incidents per 100,000 people, from the Uniform Crime Reports for
the period 1980 through 2013. Property crime rates are the number of burglaries,
motor vehicle thefts, and larceny thefts per 100,000 residents. The violent crime
1 As participation of the nation’s thousands of police departments in the collection of crime statistics
improved during the 20th century and as victim reporting increases, aggregate crime rates rose (Boggess
and Bound 1997).
Figure 1
Trends in US Property Crime and Violent Crime Rates, 1980 through 2012
(per 100,000)
Source: Authors using data from the Uniform Crime Reports.
Note:s The figures present rates of property crime and violent crime, both expressed as the number of
incidents per 100,000 people. Property crime rates are the number of burglaries, motor vehicle thefts,
and larceny thefts per 100,000 residents. The violent crime rate is the sum of murders, rapes, robberies,
and aggravated assaults per 100,000 residents.
A: Violent crimes
400
500
600
700
800
Violent crimes per 100,000
1980 1990 2000 2010
Year
3,000
3,500
4,000
4,500
5,000
5,500
Property crimes per 100,000
1980 1990 2000 2010
Year
B: Property crimes
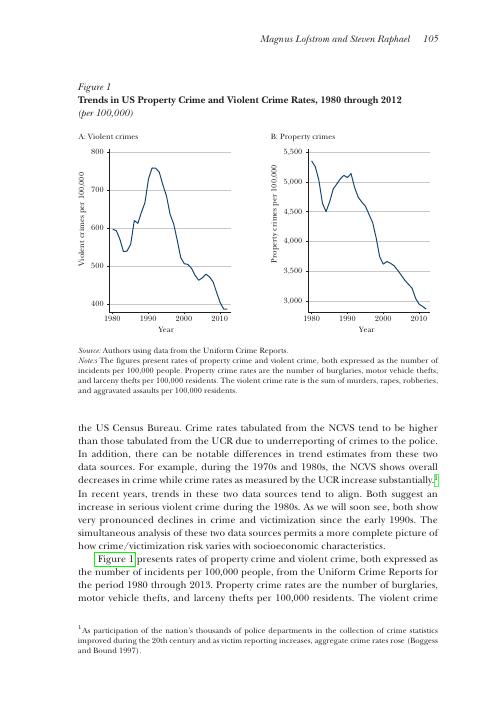
106 Journal of Economic Perspectives
rate is the sum of murders, rapes, robberies, and aggravated assaults per 100,000
residents. These seven felony crimes (often referred to as the FBI’s “part 1” felony
offenses) provide the standard categorization of serious offenses in the United
States. Both series show peaks in 1991. While there are some doubts about whether
the UCR-measured increase in property crime during the late 1980s captures an
actual rise in crime or trends in crime reporting by both victims and agencies
participating in the UCR (Boggess and Bound 1997), the increase in serious violent
crime—and homicide in particular—beginning around 1985 is a well-documented
fact (Blumstein and Rosenfeld 1998). Figure 1 also reveals very large declines in
crime rates from 1991 on. Violent crime rates dropped by more than half over this
period, while property crime rates fell by nearly half. As we will see shortly, victimiza-
tion statistics reveal very similar overall patterns.
One cannot use the historical data from the Uniform Crime Reports to explore
in a direct way how crime rates as experienced by different socioeconomic groups
have changed over time. For the most part, the data are summarized at the law
enforcement agency level with little micro-level information on specific criminal
incidents.2 However, police agencies tend to correspond geographically with incor-
porated cities, and cities vary considerably with respect to average socioeconomic
and demographic characteristics. Hence, one can assess the incidence of the crime
decline by examining the relationship between changes in crime rates across cities
with different socioeconomic characteristics.
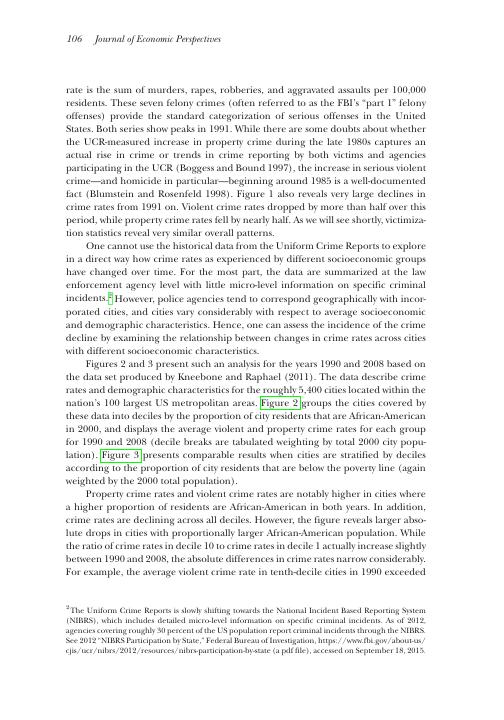
Figures 2 and 3 present such an analysis for the years 1990 and 2008 based on
the data set produced by Kneebone and Raphael (2011). The data describe crime
rates and demographic characteristics for the roughly 5,400 cities located within the
nation’s 100 largest US metropolitan areas. Figure 2 groups the cities covered by
these data into deciles by the proportion of city residents that are African-American
in 2000, and displays the average violent and property crime rates for each group
for 1990 and 2008 (decile breaks are tabulated weighting by total 2000 city popu-
lation). Figure 3 presents comparable results when cities are stratified by deciles
according to the proportion of city residents that are below the poverty line (again
weighted by the 2000 total population).
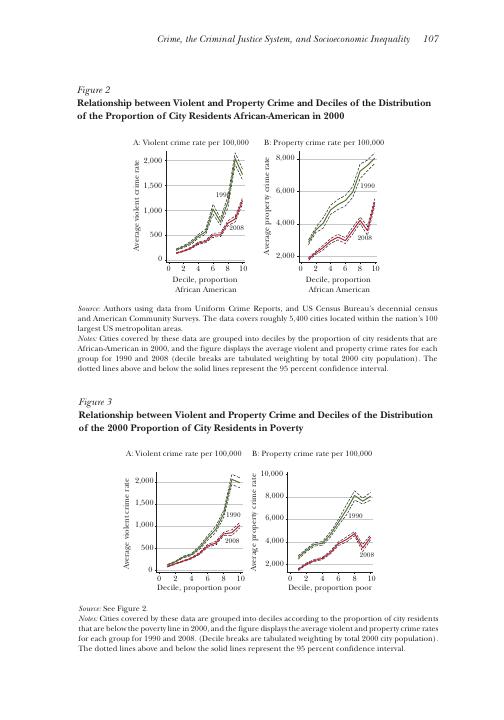
Property crime rates and violent crime rates are notably higher in cities where
a higher proportion of residents are African-American in both years. In addition,
crime rates are declining across all deciles. However, the figure reveals larger abso-
lute drops in cities with proportionally larger African-American population. While
the ratio of crime rates in decile 10 to crime rates in decile 1 actually increase slightly
between 1990 and 2008, the absolute differences in crime rates narrow considerably.
For example, the average violent crime rate in tenth-decile cities in 1990 exceeded
2 The Uniform Crime Reports is slowly shifting towards the National Incident Based Reporting System
(NIBRS), which includes detailed micro-level information on specific criminal incidents. As of 2012,
agencies covering roughly 30 percent of the US population report criminal incidents through the NIBRS.
See 2012 “NIBRS Participation by State,” Federal Bureau of Investigation, https://www.fbi.gov/about-us/
cjis/ucr/nibrs/2012/resources/nibrs-participation-by-state (a pdf file), accessed on September 18, 2015.
rate is the sum of murders, rapes, robberies, and aggravated assaults per 100,000
residents. These seven felony crimes (often referred to as the FBI’s “part 1” felony
offenses) provide the standard categorization of serious offenses in the United
States. Both series show peaks in 1991. While there are some doubts about whether
the UCR-measured increase in property crime during the late 1980s captures an
actual rise in crime or trends in crime reporting by both victims and agencies
participating in the UCR (Boggess and Bound 1997), the increase in serious violent
crime—and homicide in particular—beginning around 1985 is a well-documented
fact (Blumstein and Rosenfeld 1998). Figure 1 also reveals very large declines in
crime rates from 1991 on. Violent crime rates dropped by more than half over this
period, while property crime rates fell by nearly half. As we will see shortly, victimiza-
tion statistics reveal very similar overall patterns.
One cannot use the historical data from the Uniform Crime Reports to explore
in a direct way how crime rates as experienced by different socioeconomic groups
have changed over time. For the most part, the data are summarized at the law
enforcement agency level with little micro-level information on specific criminal
incidents.2 However, police agencies tend to correspond geographically with incor-
porated cities, and cities vary considerably with respect to average socioeconomic
and demographic characteristics. Hence, one can assess the incidence of the crime
decline by examining the relationship between changes in crime rates across cities
with different socioeconomic characteristics.
Figures 2 and 3 present such an analysis for the years 1990 and 2008 based on
the data set produced by Kneebone and Raphael (2011). The data describe crime
rates and demographic characteristics for the roughly 5,400 cities located within the
nation’s 100 largest US metropolitan areas. Figure 2 groups the cities covered by
these data into deciles by the proportion of city residents that are African-American
in 2000, and displays the average violent and property crime rates for each group
for 1990 and 2008 (decile breaks are tabulated weighting by total 2000 city popu-
lation). Figure 3 presents comparable results when cities are stratified by deciles
according to the proportion of city residents that are below the poverty line (again
weighted by the 2000 total population).
Property crime rates and violent crime rates are notably higher in cities where
a higher proportion of residents are African-American in both years. In addition,
crime rates are declining across all deciles. However, the figure reveals larger abso-
lute drops in cities with proportionally larger African-American population. While
the ratio of crime rates in decile 10 to crime rates in decile 1 actually increase slightly
between 1990 and 2008, the absolute differences in crime rates narrow considerably.
For example, the average violent crime rate in tenth-decile cities in 1990 exceeded
2 The Uniform Crime Reports is slowly shifting towards the National Incident Based Reporting System
(NIBRS), which includes detailed micro-level information on specific criminal incidents. As of 2012,
agencies covering roughly 30 percent of the US population report criminal incidents through the NIBRS.
See 2012 “NIBRS Participation by State,” Federal Bureau of Investigation, https://www.fbi.gov/about-us/
cjis/ucr/nibrs/2012/resources/nibrs-participation-by-state (a pdf file), accessed on September 18, 2015.
Crime, the Criminal Justice System, and Socioeconomic Inequality 107
Figure 2
Relationship between Violent and Property Crime and Deciles of the Distribution
of the Proportion of City Residents African-American in 2000
Source: Authors using data from Uniform Crime Reports, and US Census Bureau’s decennial census
and American Community Surveys. The data covers roughly 5,400 cities located within the nation’s 100
largest US metropolitan areas.
Notes: Cities covered by these data are grouped into deciles by the proportion of city residents that are
African-American in 2000, and the figure displays the average violent and property crime rates for each
group for 1990 and 2008 (decile breaks are tabulated weighting by total 2000 city population). The
dotted lines above and below the solid lines represent the 95 percent confidence interval.
A: Violent crime rate per 100,000 B: Property crime rate per 100,000
1990
2008
0
500
1,000
1,500
2,000
Average violent crime rate
0 2 4 6 8 10
Decile, proportion
African American
1990
2008
2,000
4,000
6,000
8,000
Average property crime rate
0 2 4 6 8 10
Decile, proportion
African American
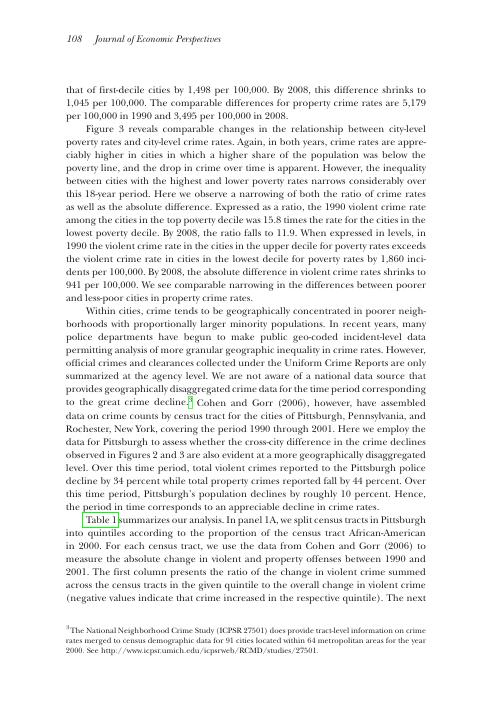
Figure 3
Relationship between Violent and Property Crime and Deciles of the Distribution
of the 2000 Proportion of City Residents in Poverty
Source: See Figure 2.
Notes: Cities covered by these data are grouped into deciles according to the proportion of city residents
that are below the poverty line in 2000, and the figure displays the average violent and property crime rates
for each group for 1990 and 2008. (Decile breaks are tabulated weighting by total 2000 city population).
The dotted lines above and below the solid lines represent the 95 percent confidence interval.
1990
2008
0
500
1,000
1,500
2,000
Average violent crime rate
0 2 4 6 8 10
Decile, proportion poor
1990
2008
2,000
4,000
6,000
8,000
10,000
Average property crime rate
0 2 4 6 8 10
Decile, proportion poor
A: Violent crime rate per 100,000 B: Property crime rate per 100,000
Figure 2
Relationship between Violent and Property Crime and Deciles of the Distribution
of the Proportion of City Residents African-American in 2000
Source: Authors using data from Uniform Crime Reports, and US Census Bureau’s decennial census
and American Community Surveys. The data covers roughly 5,400 cities located within the nation’s 100
largest US metropolitan areas.
Notes: Cities covered by these data are grouped into deciles by the proportion of city residents that are
African-American in 2000, and the figure displays the average violent and property crime rates for each
group for 1990 and 2008 (decile breaks are tabulated weighting by total 2000 city population). The
dotted lines above and below the solid lines represent the 95 percent confidence interval.
A: Violent crime rate per 100,000 B: Property crime rate per 100,000
1990
2008
0
500
1,000
1,500
2,000
Average violent crime rate
0 2 4 6 8 10
Decile, proportion
African American
1990
2008
2,000
4,000
6,000
8,000
Average property crime rate
0 2 4 6 8 10
Decile, proportion
African American
Figure 3
Relationship between Violent and Property Crime and Deciles of the Distribution
of the 2000 Proportion of City Residents in Poverty
Source: See Figure 2.
Notes: Cities covered by these data are grouped into deciles according to the proportion of city residents
that are below the poverty line in 2000, and the figure displays the average violent and property crime rates
for each group for 1990 and 2008. (Decile breaks are tabulated weighting by total 2000 city population).
The dotted lines above and below the solid lines represent the 95 percent confidence interval.
1990
2008
0
500
1,000
1,500
2,000
Average violent crime rate
0 2 4 6 8 10
Decile, proportion poor
1990
2008
2,000
4,000
6,000
8,000
10,000
Average property crime rate
0 2 4 6 8 10
Decile, proportion poor
A: Violent crime rate per 100,000 B: Property crime rate per 100,000
108 Journal of Economic Perspectives
that of first-decile cities by 1,498 per 100,000. By 2008, this difference shrinks to
1,045 per 100,000. The comparable differences for property crime rates are 5,179
per 100,000 in 1990 and 3,495 per 100,000 in 2008.
Figure 3 reveals comparable changes in the relationship between city-level
poverty rates and city-level crime rates. Again, in both years, crime rates are appre-
ciably higher in cities in which a higher share of the population was below the
poverty line, and the drop in crime over time is apparent. However, the inequality
between cities with the highest and lower poverty rates narrows considerably over
this 18-year period. Here we observe a narrowing of both the ratio of crime rates
as well as the absolute difference. Expressed as a ratio, the 1990 violent crime rate
among the cities in the top poverty decile was 15.8 times the rate for the cities in the
lowest poverty decile. By 2008, the ratio falls to 11.9. When expressed in levels, in
1990 the violent crime rate in the cities in the upper decile for poverty rates exceeds
the violent crime rate in cities in the lowest decile for poverty rates by 1,860 inci-
dents per 100,000. By 2008, the absolute difference in violent crime rates shrinks to
941 per 100,000. We see comparable narrowing in the differences between poorer
and less-poor cities in property crime rates.
Within cities, crime tends to be geographically concentrated in poorer neigh-
borhoods with proportionally larger minority populations. In recent years, many
police departments have begun to make public geo-coded incident-level data
permitting analysis of more granular geographic inequality in crime rates. However,
official crimes and clearances collected under the Uniform Crime Reports are only
summarized at the agency level. We are not aware of a national data source that
provides geographically disaggregated crime data for the time period corresponding
to the great crime decline. 3 Cohen and Gorr (2006), however, have assembled
data on crime counts by census tract for the cities of Pittsburgh, Pennsylvania, and
Rochester, New York, covering the period 1990 through 2001. Here we employ the
data for Pittsburgh to assess whether the cross-city difference in the crime declines
observed in Figures 2 and 3 are also evident at a more geographically disaggregated
level. Over this time period, total violent crimes reported to the Pittsburgh police
decline by 34 percent while total property crimes reported fall by 44 percent. Over
this time period, Pittsburgh’s population declines by roughly 10 percent. Hence,
the period in time corresponds to an appreciable decline in crime rates.
Table 1 summarizes our analysis. In panel 1A, we split census tracts in Pittsburgh
into quintiles according to the proportion of the census tract African-American
in 2000. For each census tract, we use the data from Cohen and Gorr (2006) to
measure the absolute change in violent and property offenses between 1990 and
2001. The first column presents the ratio of the change in violent crime summed
across the census tracts in the given quintile to the overall change in violent crime
(negative values indicate that crime increased in the respective quintile). The next
3 The National Neighborhood Crime Study (ICPSR 27501) does provide tract-level information on crime
rates merged to census demographic data for 91 cities located within 64 metropolitan areas for the year
2000. See http://www.icpsr.umich.edu/icpsrweb/RCMD/studies/27501.
End of preview
Want to access all the pages? Upload your documents or become a member.