AI Assignment: K-Means Clustering, Initialization, and Elbow Method
VerifiedAdded on 2023/05/30
|13
|2191
|495
Homework Assignment
AI Summary
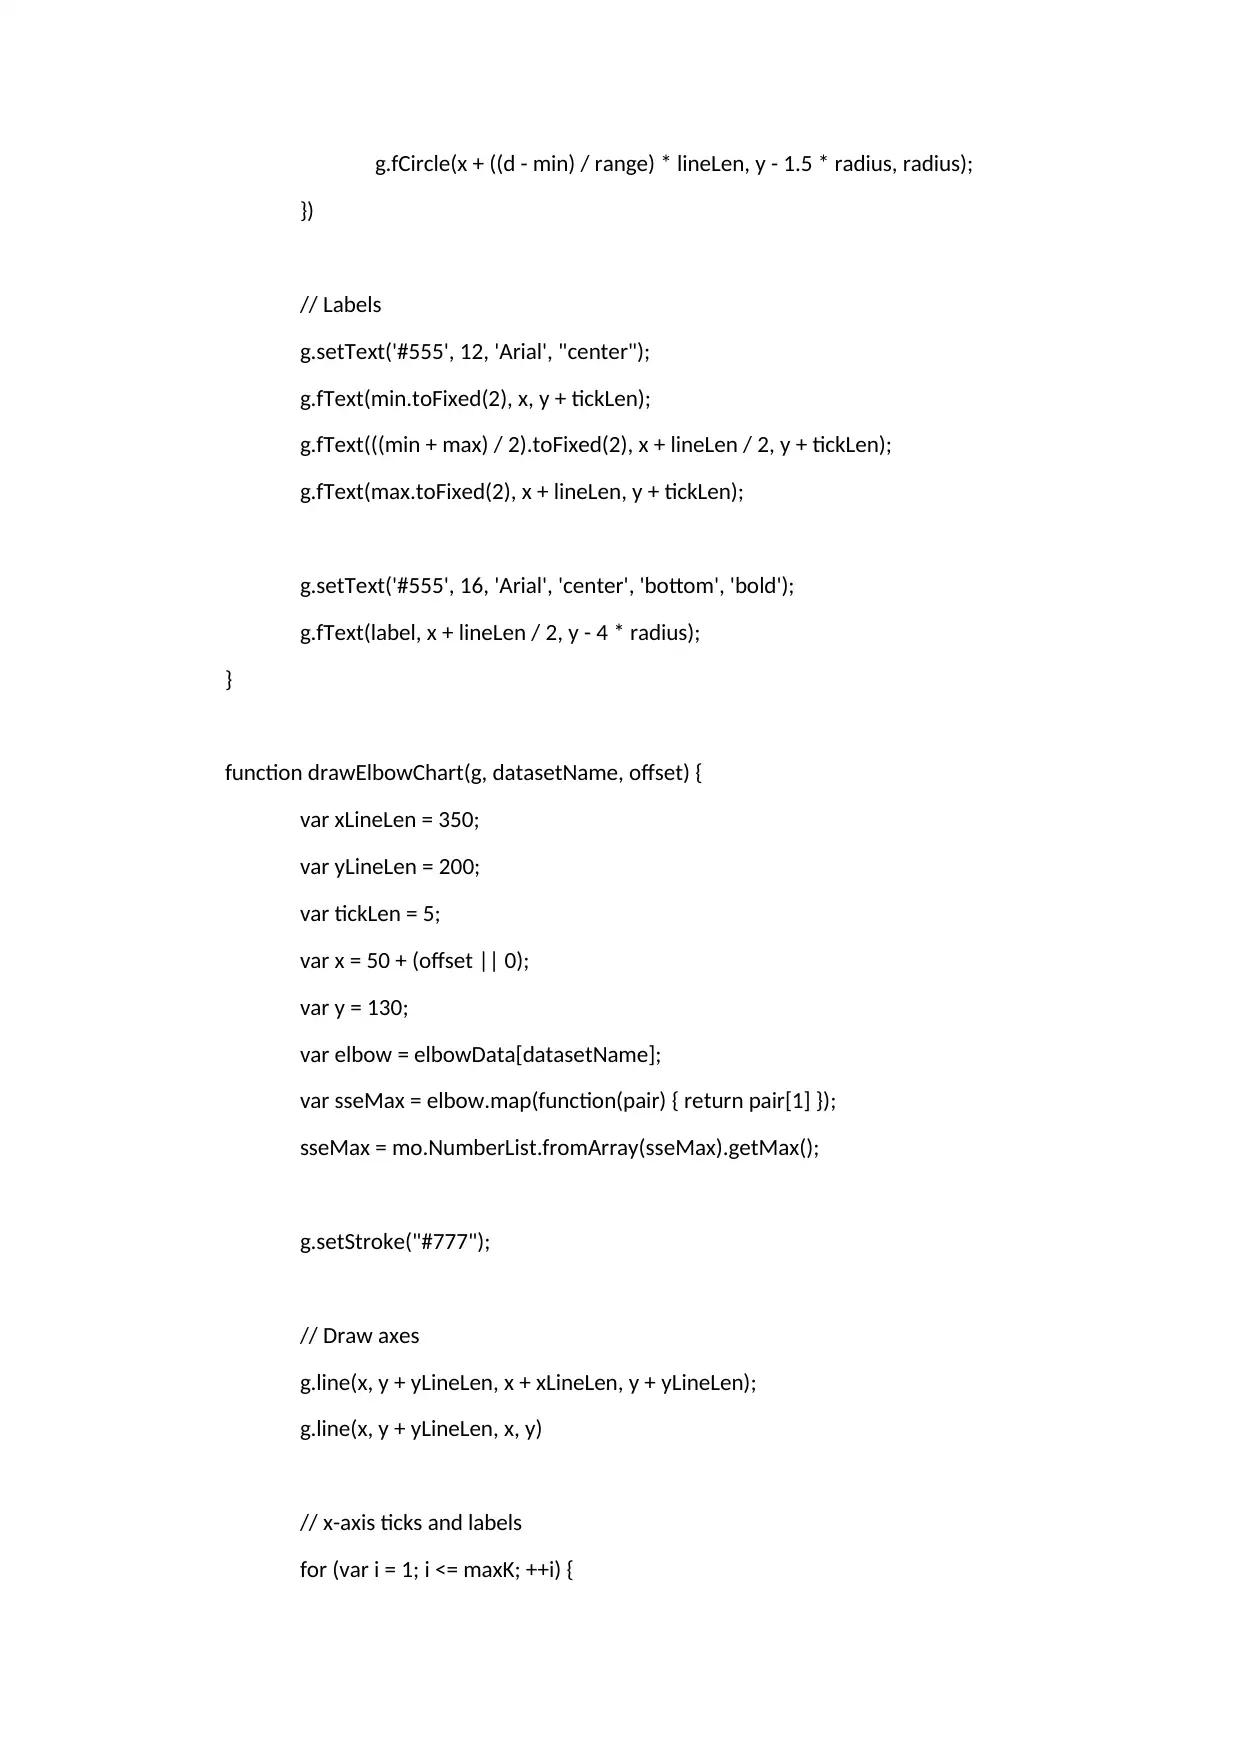
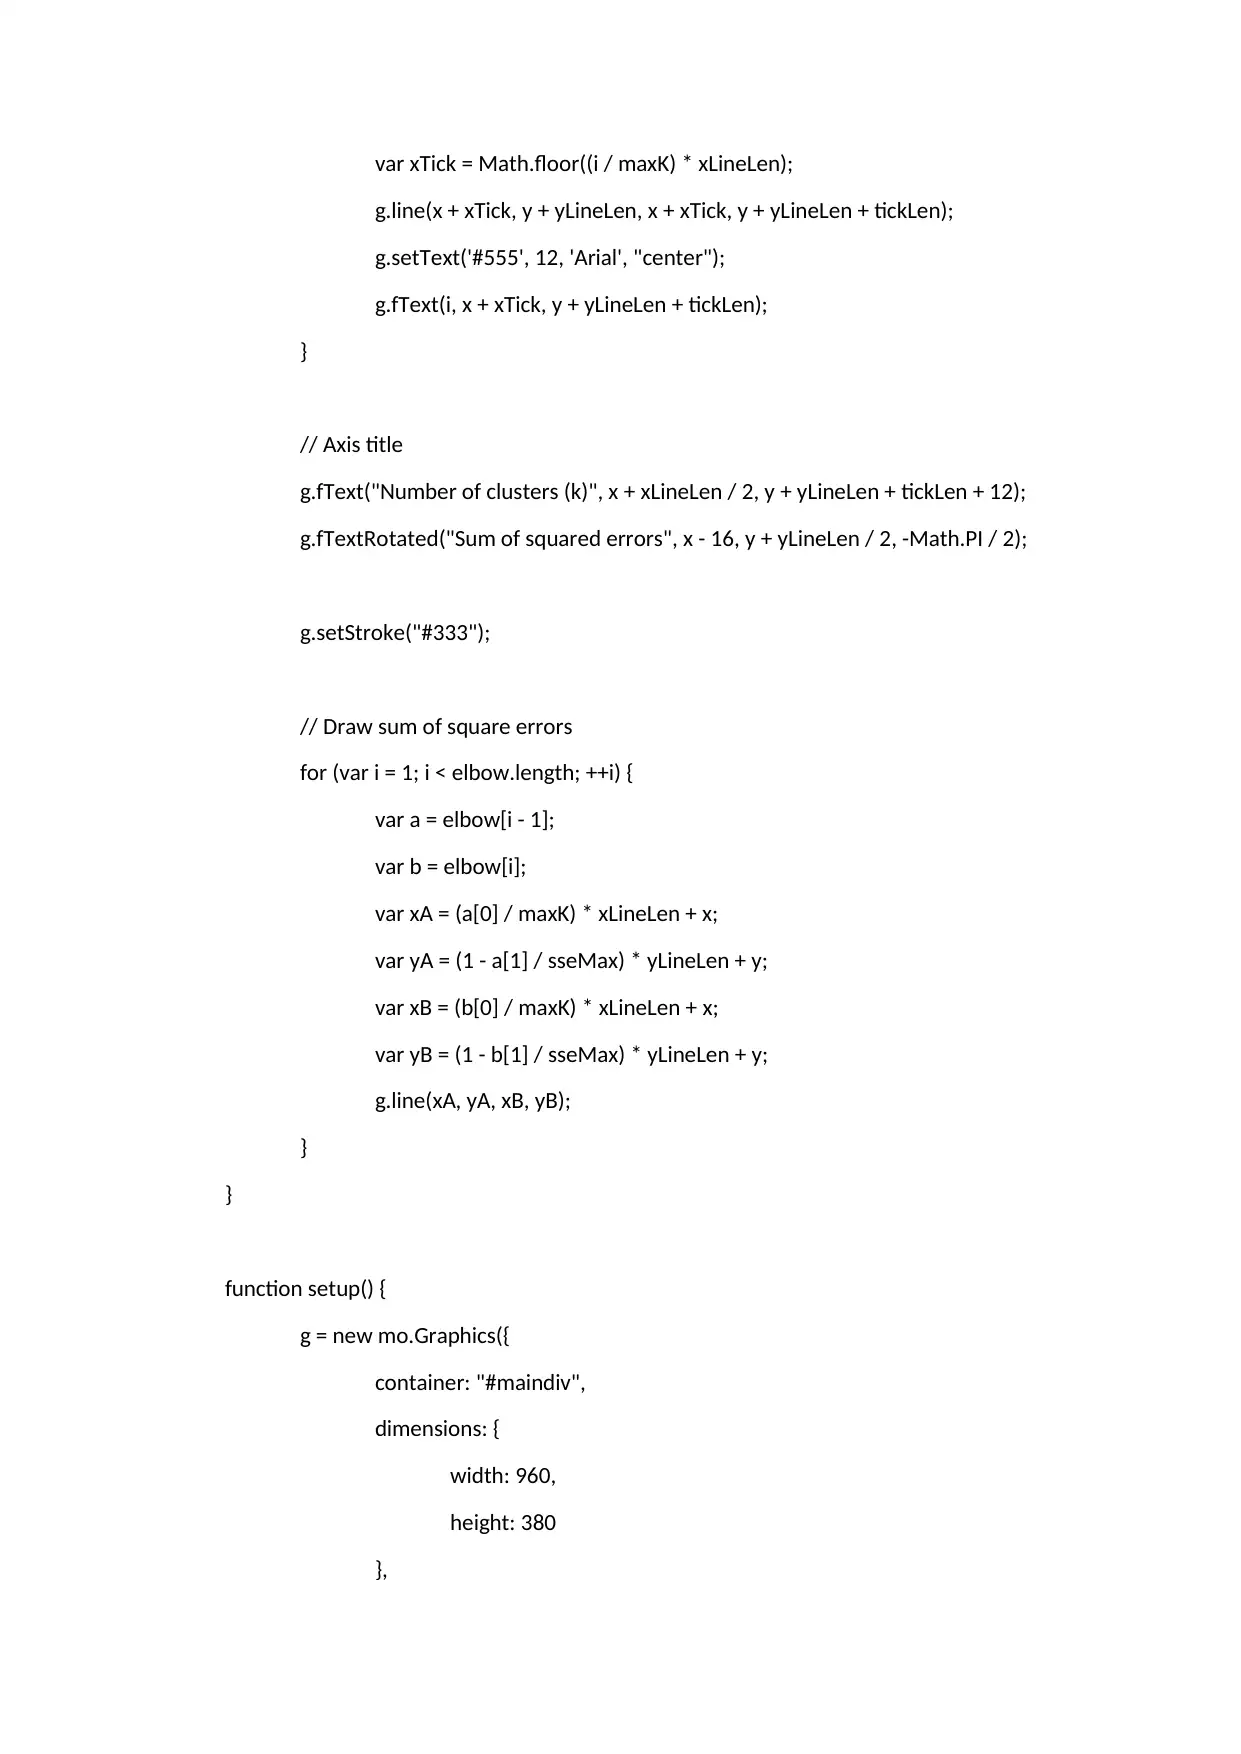
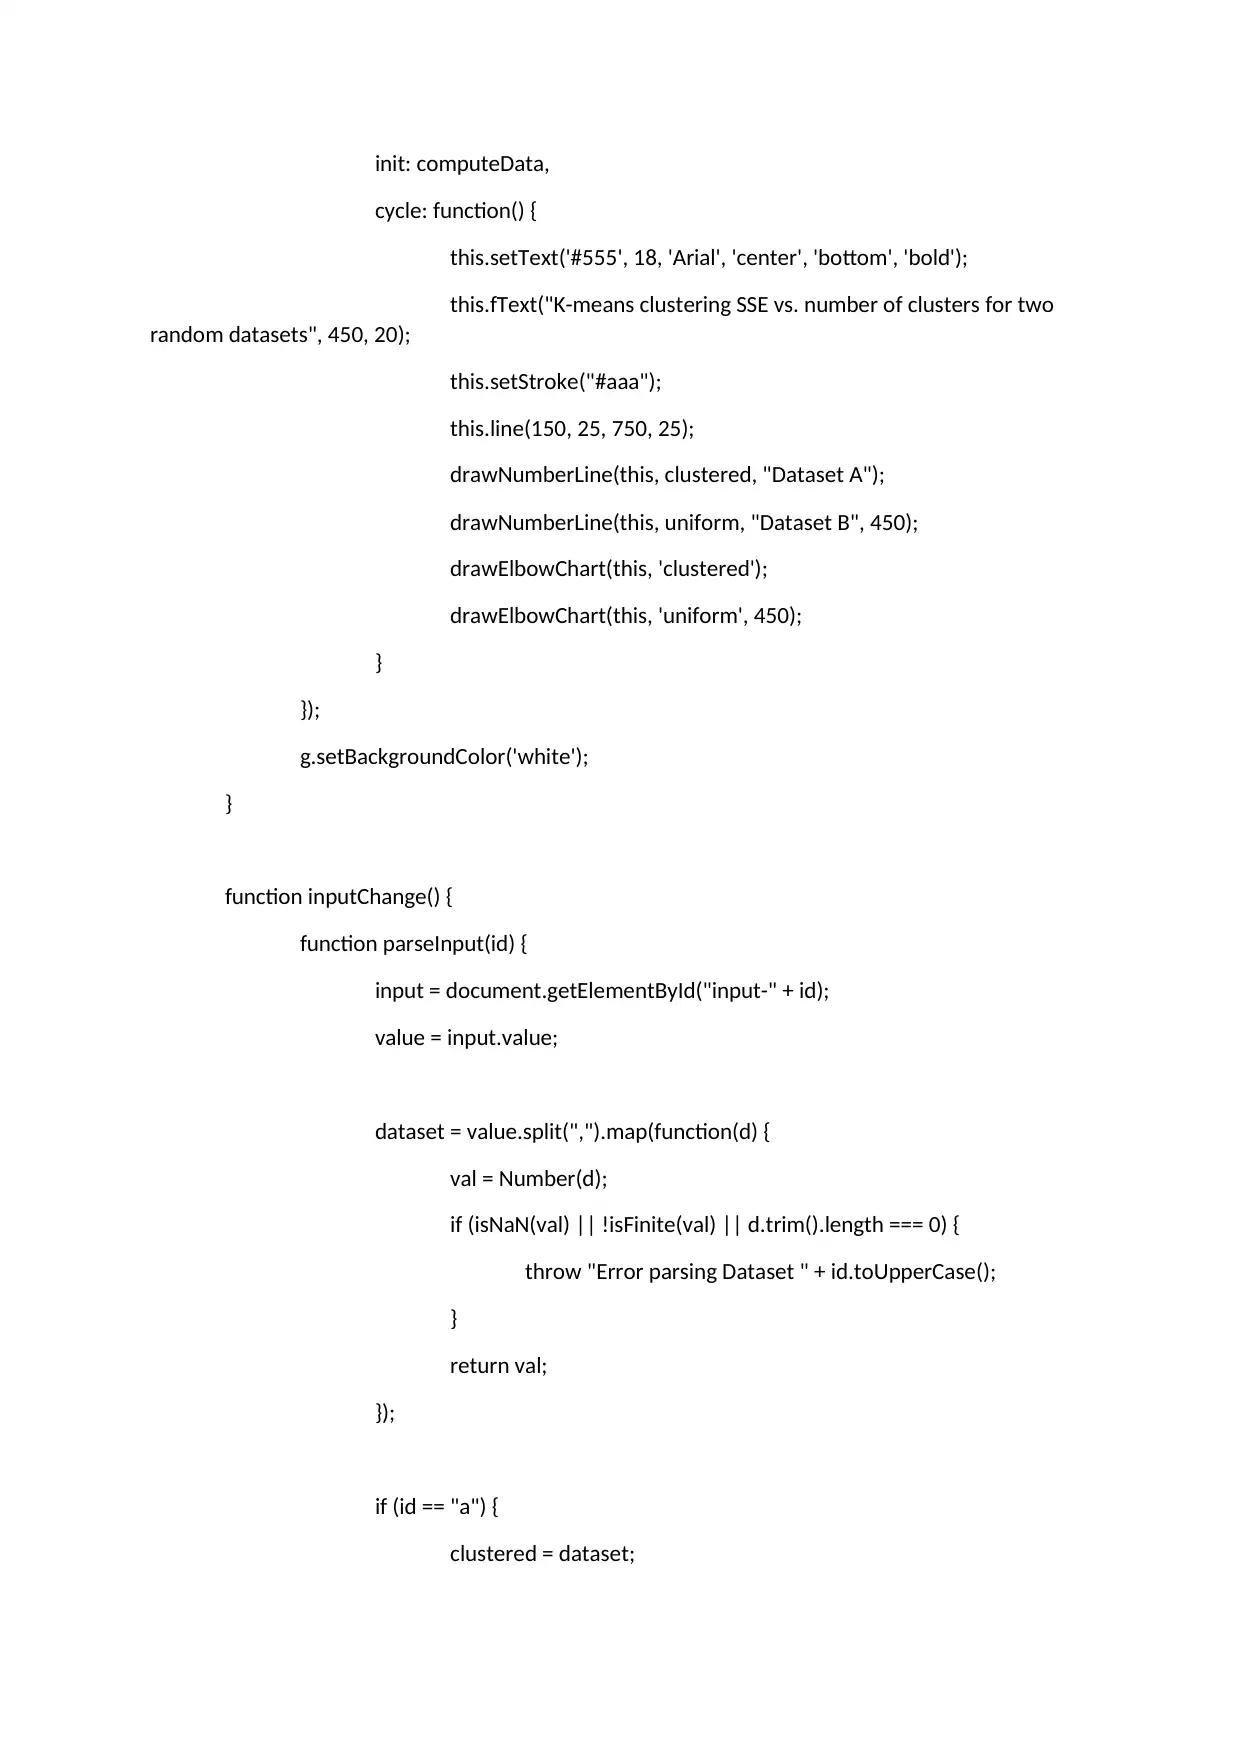
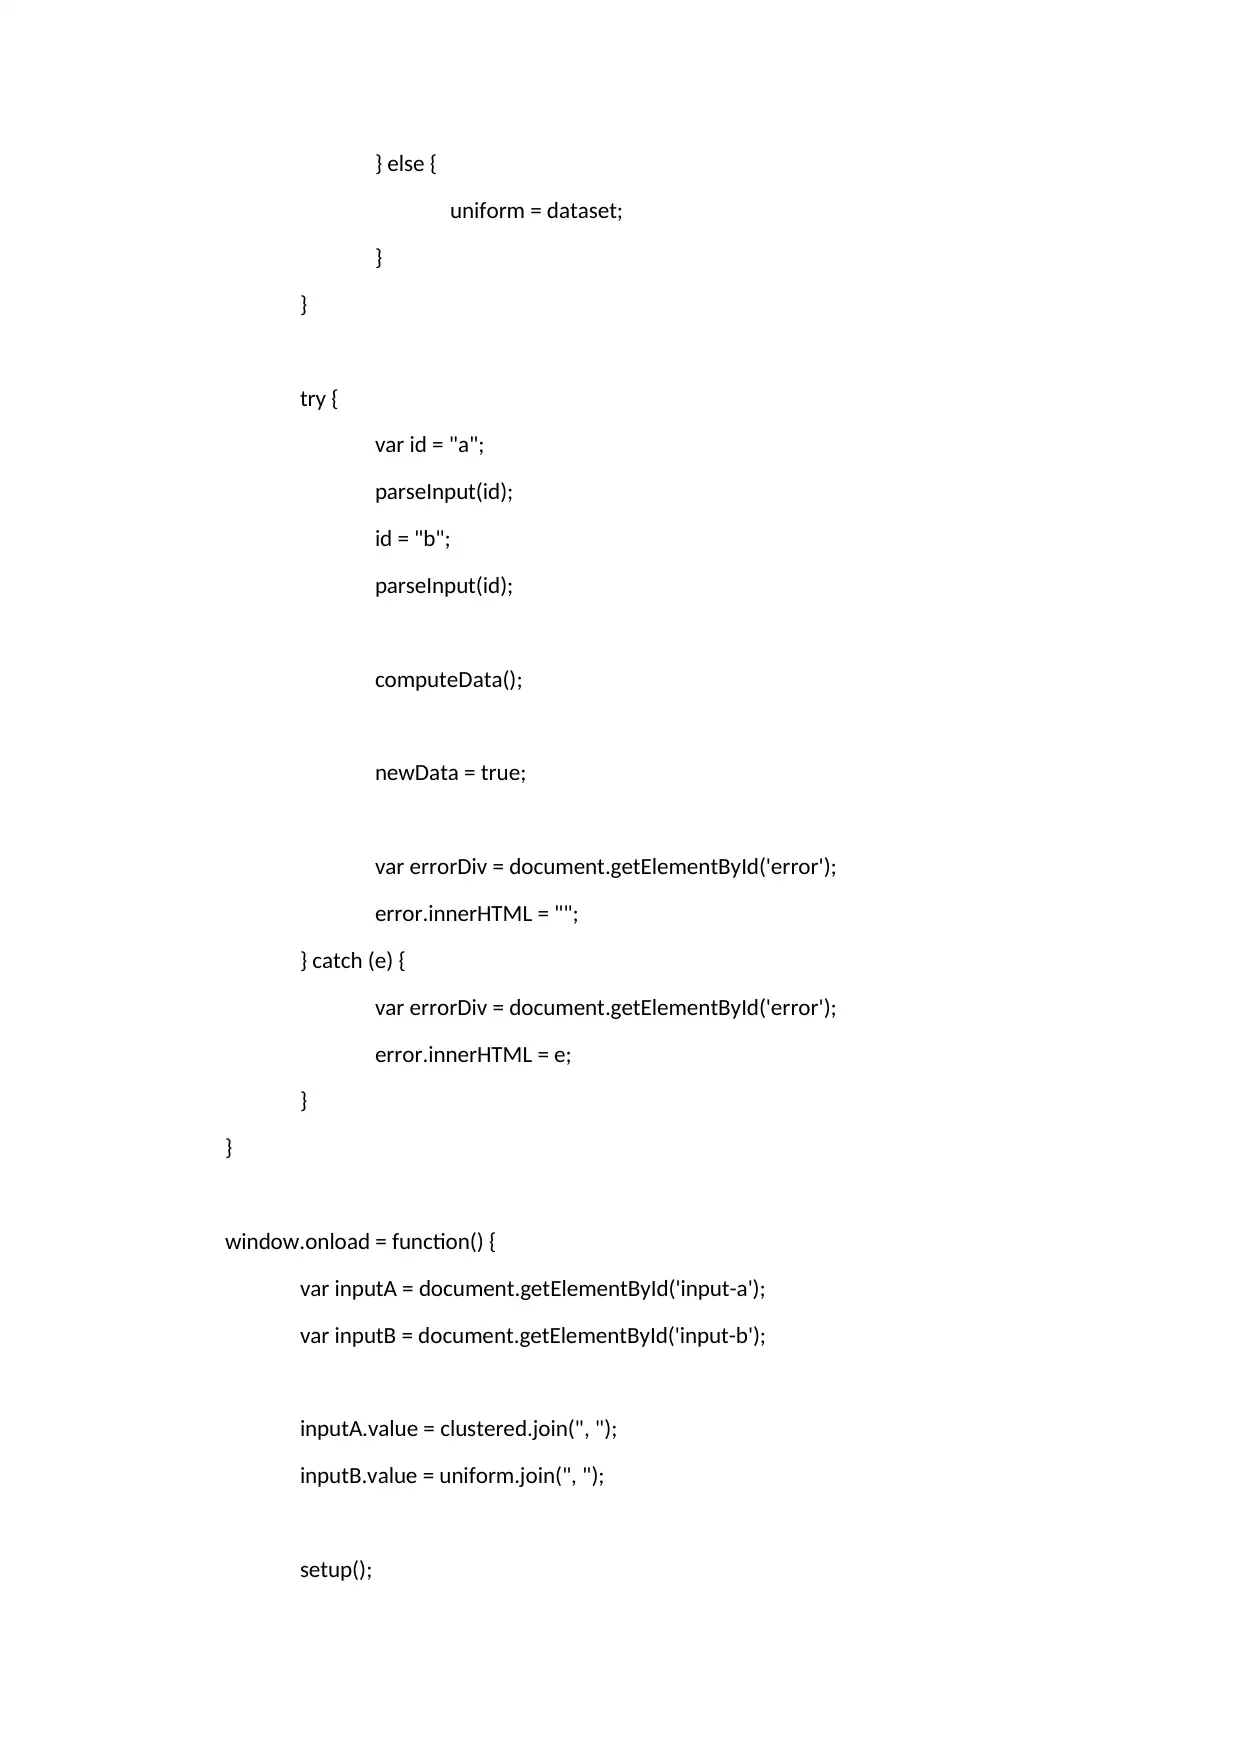
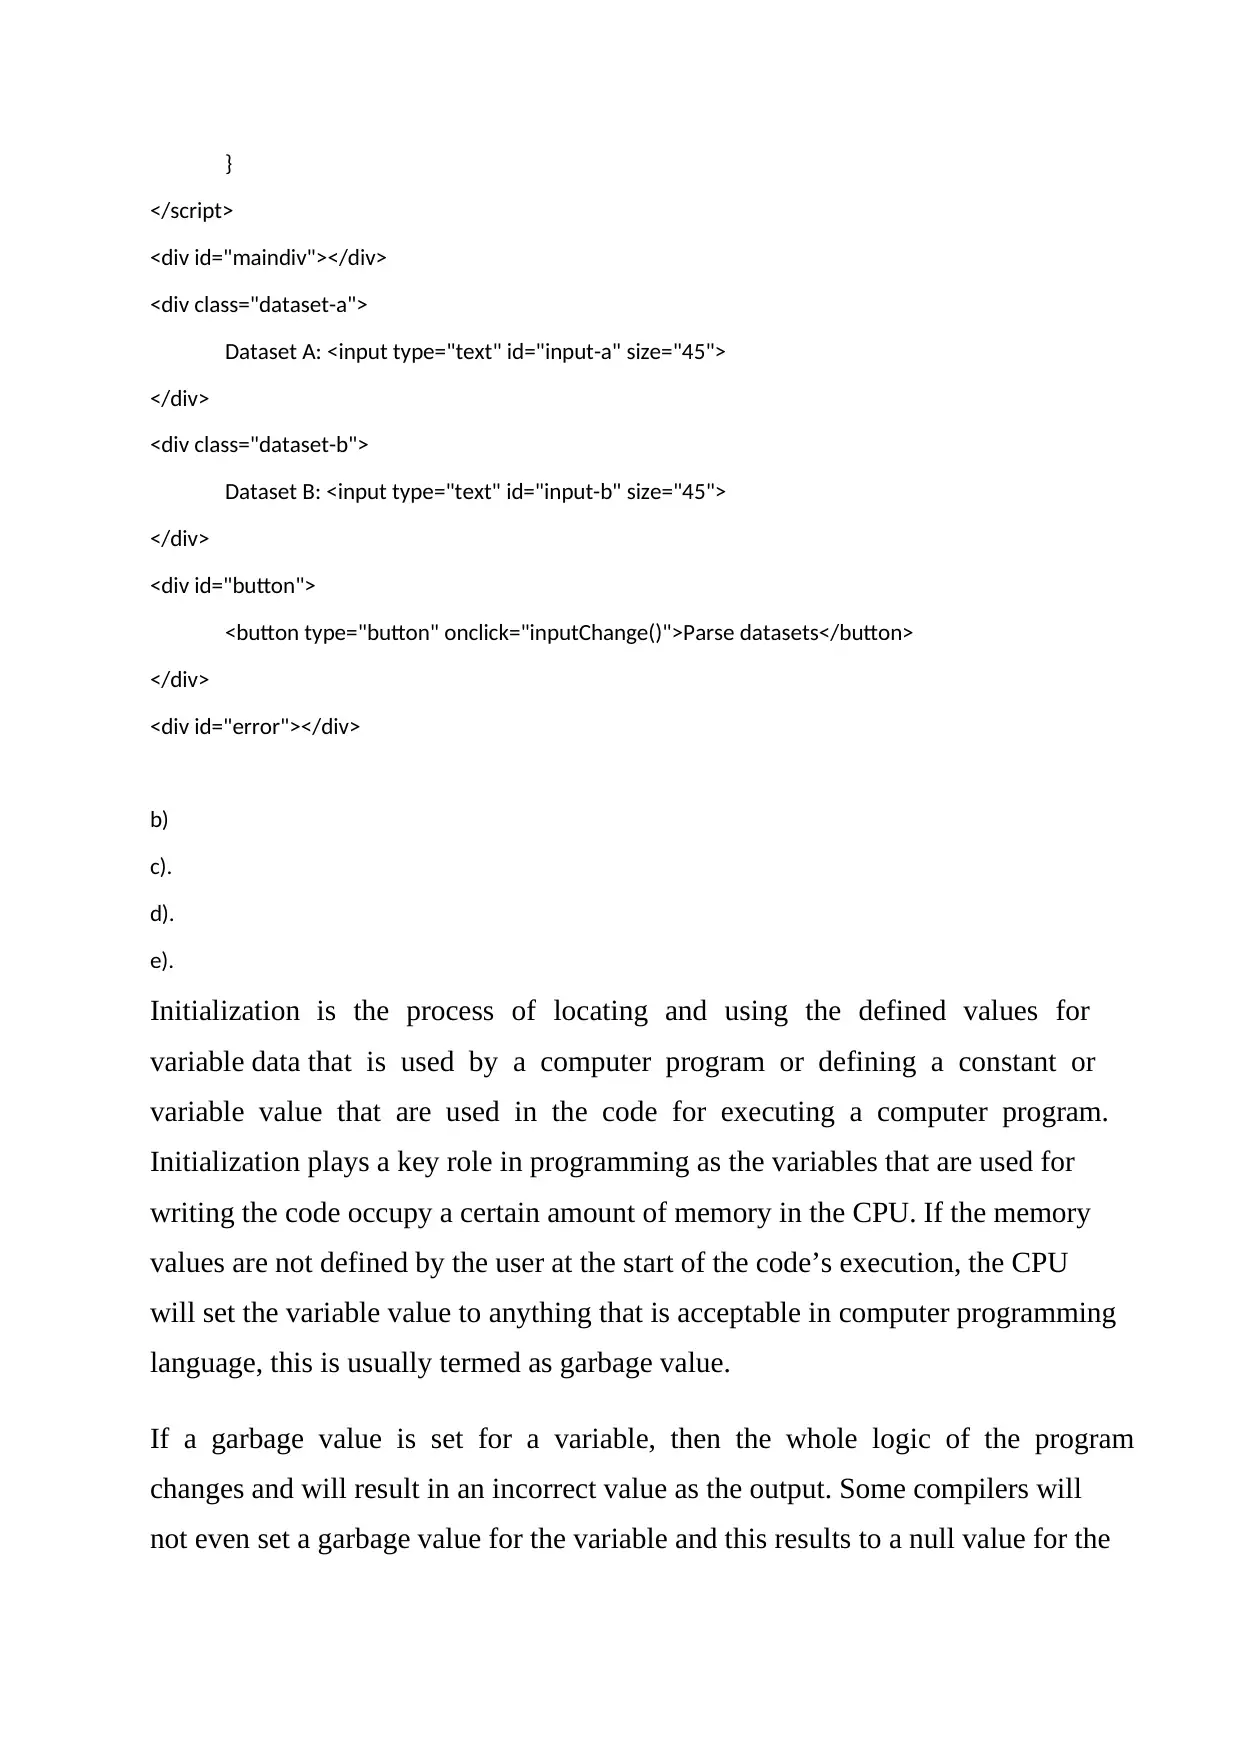
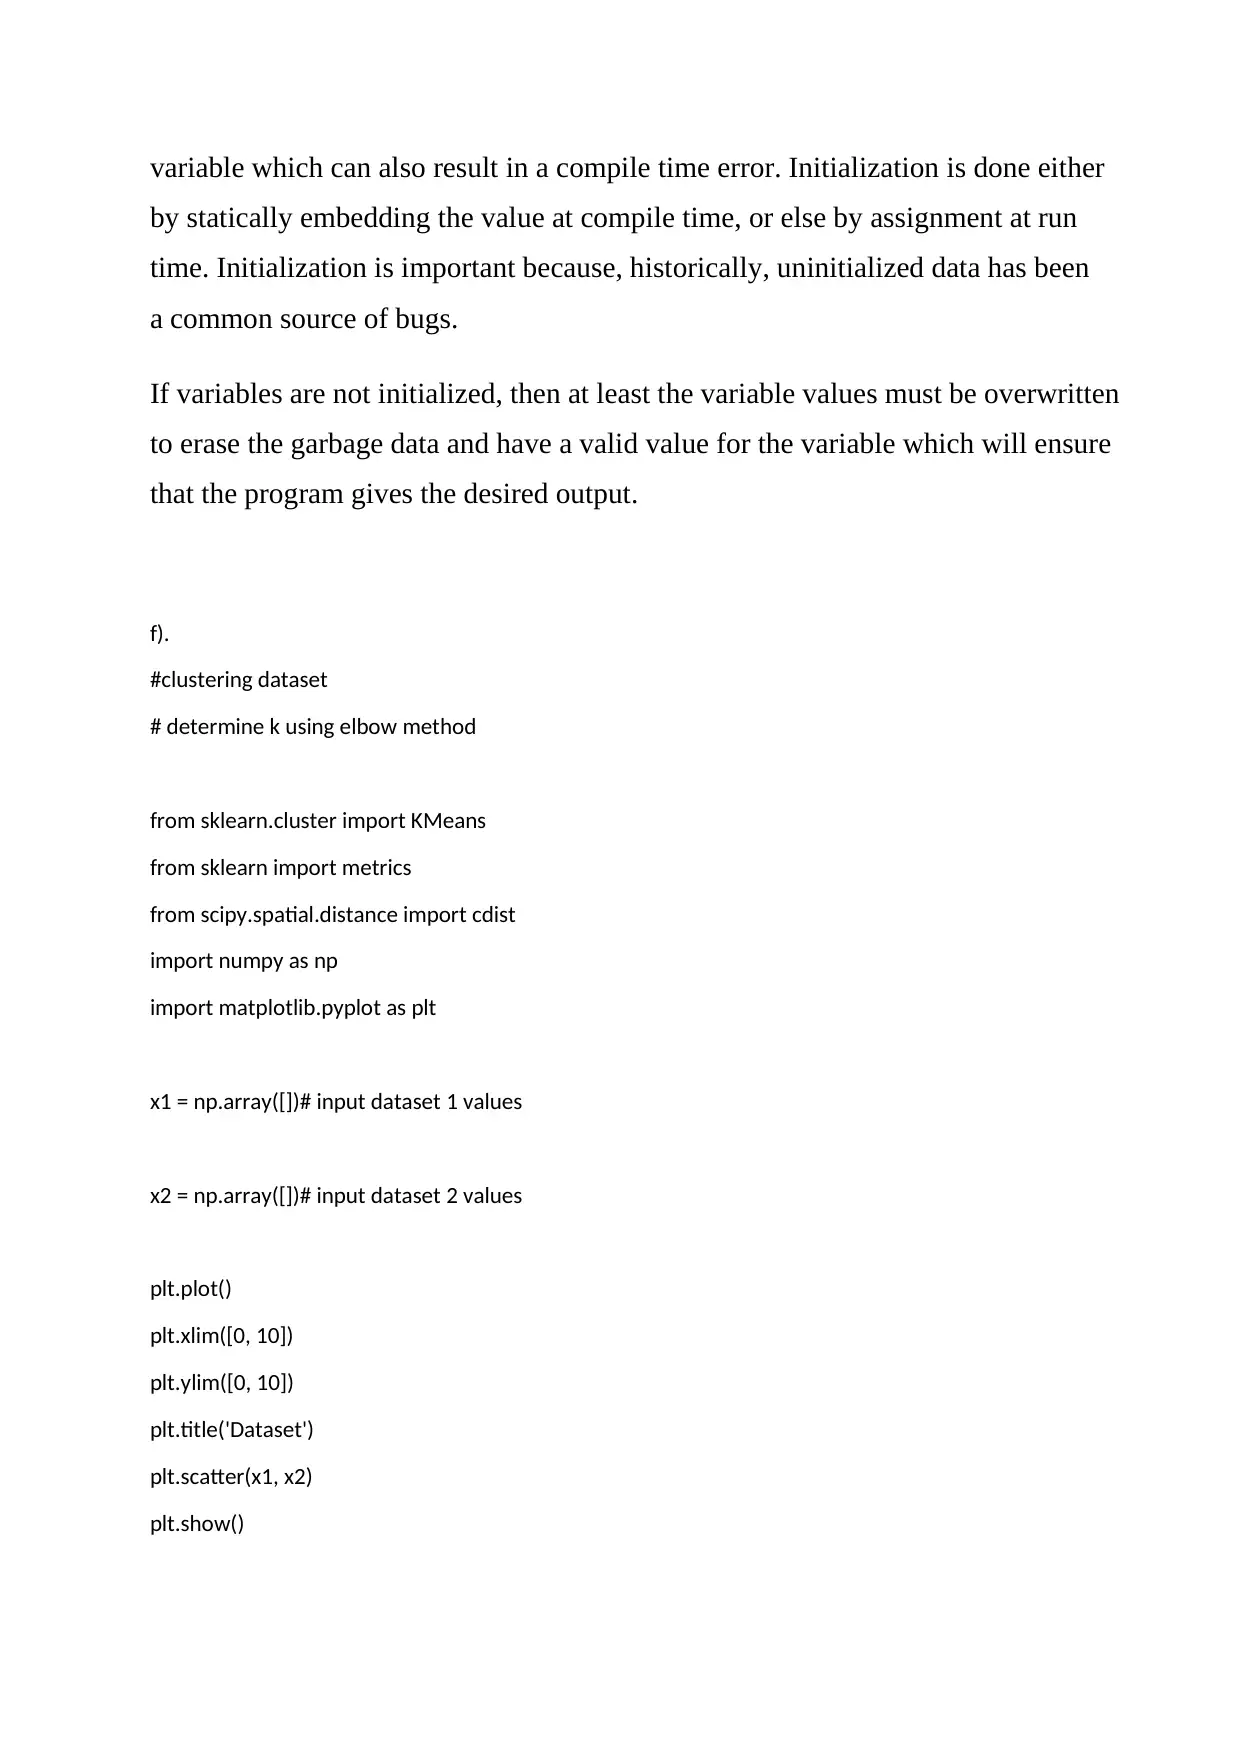
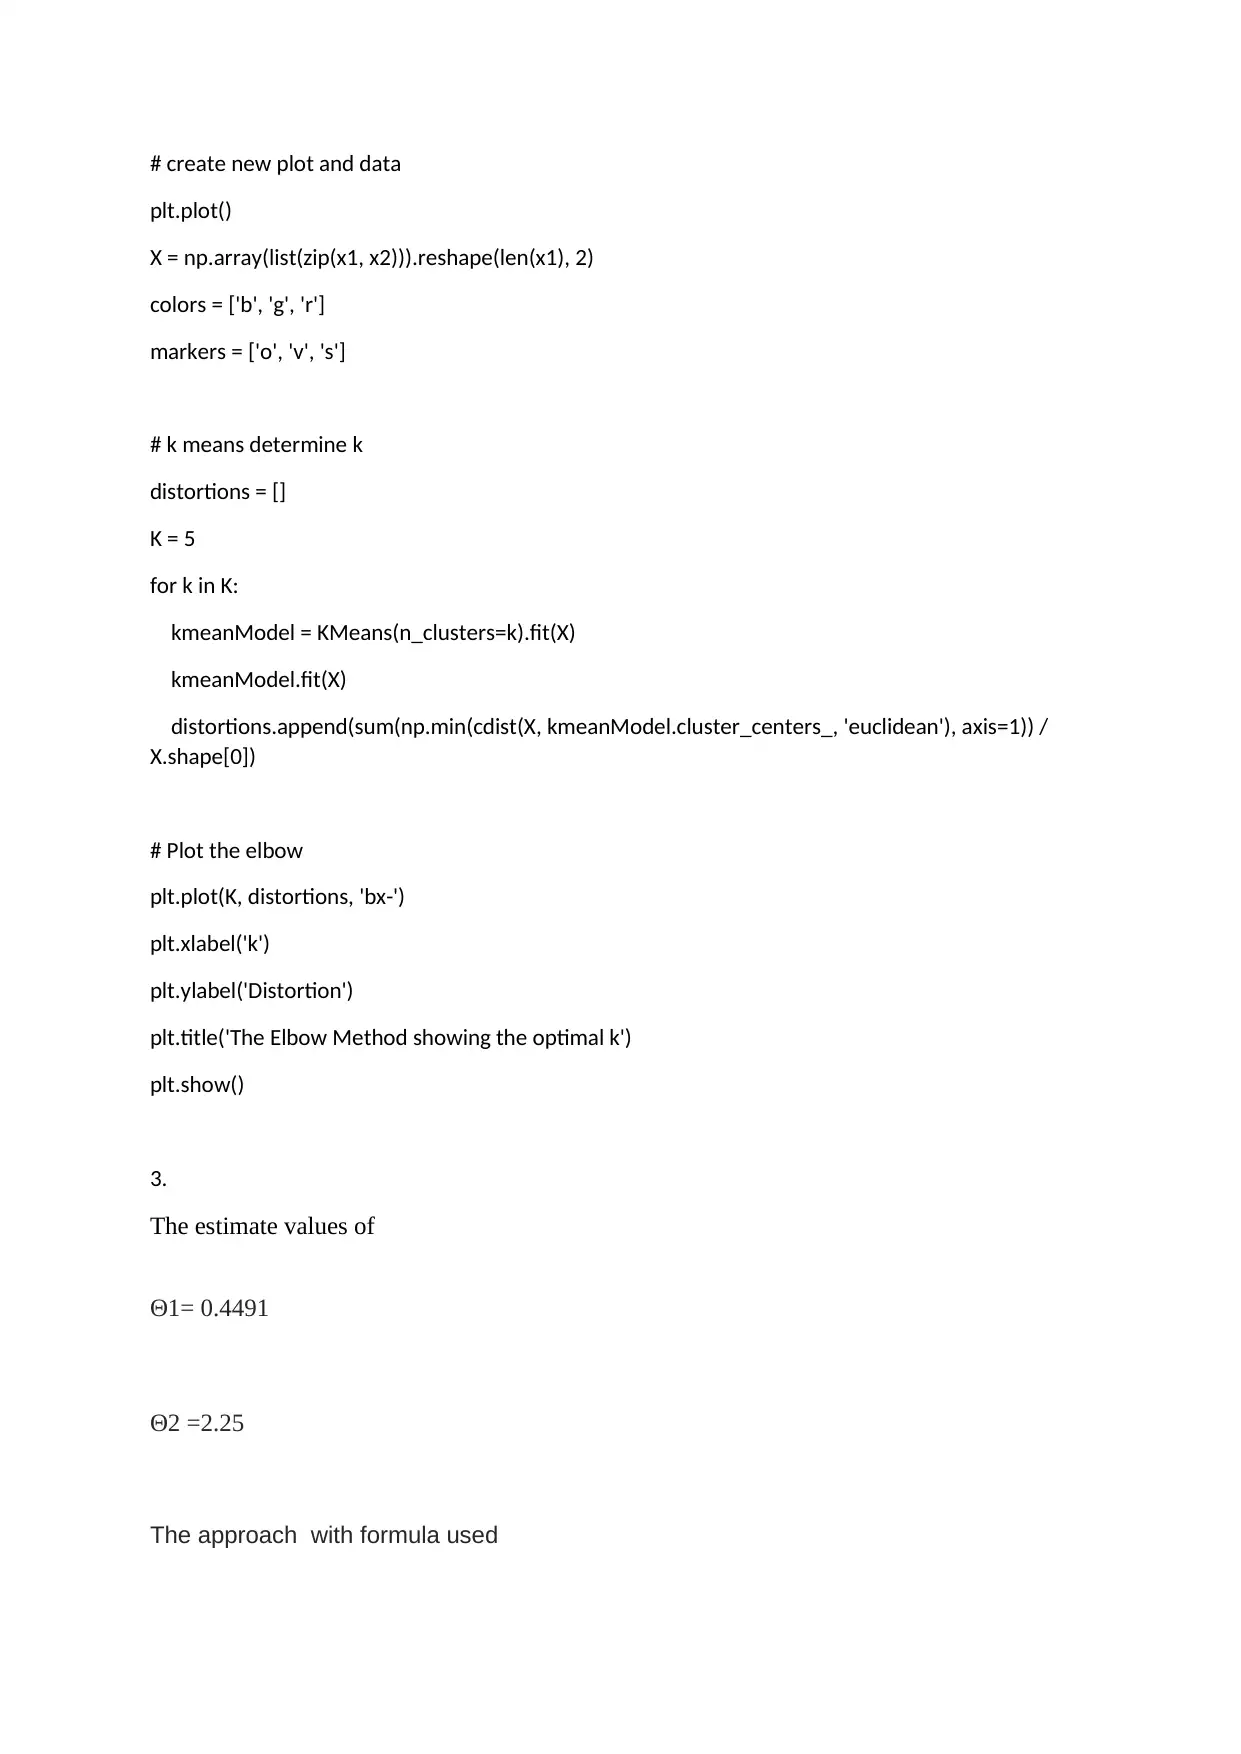
This assignment solution addresses several aspects of K-Means clustering, a fundamental algorithm in machine learning. The first part provides code using the scikit-learn library to perform K-Means clustering on a sample dataset and demonstrates how to predict cluster assignments and find cluster centers. The second part involves an HTML and JavaScript implementation for visualizing K-Means clustering and the elbow method. The HTML code sets up the structure, while the JavaScript code uses a library to create interactive visualizations, including number lines, and elbow charts to determine the optimal number of clusters (k). The solution also includes explanations of variable initialization in programming and its importance. Finally, the assignment shows an implementation of the elbow method using Python code and libraries like scikit-learn, NumPy, and Matplotlib to determine the optimal number of clusters for a given dataset. The solution also provides the estimated values of Θ1 and Θ2.

Q 1.
from sklearn.cluster import KMeans
import numpy as np
X = np.array([[1, 2], [1, 4], [1, 0],
[4, 2], [4, 4], [4, 0]])
kmeans = KMeans(n_clusters=2, random_state=0).fit(X)
kmeans.labels_
kmeans.predict([[0, 0], [4, 4]])
kmeans.cluster_centers_
Q 2.
a).
<!DOCTYPE html>
<meta charset="utf-8">
<style>
html, body {
height: 100%;
}
body {
margin: 0;
padding: 0;
overflow: hidden;
font-size: 12px;
font-family: Arial, sans-serif;
}
#maindiv {
width: 960px;
Paraphrase This Document
Need a fresh take? Get an instant paraphrase of this document with our AI Paraphraser

height: 380px;
}
.dataset-a, .dataset-b {
display: inline-block;
width: 400px;
padding: 0 0 0 50px;
}
#button {
margin: 20px 50px;
}
#error {
margin: 20px 50px;
font-size: 20px;
color: red;
}
</style>
<body>
<script src="moebio_framework.min.js"></script>
<script>
var uniform = []; // please enter values from dataset
var clustered = []; // please enter values from dataset
var elbowData = {};
var maxK = 5;
var newData = false;
var g;
}
.dataset-a, .dataset-b {
display: inline-block;
width: 400px;
padding: 0 0 0 50px;
}
#button {
margin: 20px 50px;
}
#error {
margin: 20px 50px;
font-size: 20px;
color: red;
}
</style>
<body>
<script src="moebio_framework.min.js"></script>
<script>
var uniform = []; // please enter values from dataset
var clustered = []; // please enter values from dataset
var elbowData = {};
var maxK = 5;
var newData = false;
var g;

function computeData() {
// Reset elbowData
elbowData = {};
uniformNL = mo.NumberList.fromArray(uniform);
clusteredNL = mo.NumberList.fromArray(clustered);
// Compute k-means clusters for k from 1 to 10, and populate the elbowData
// for each dataset and each value of k
for (var k = 1; k <= maxK; ++k) {
uniformKMeans = mo.NumberListOperators.linearKMeans(uniformNL, k);
clusteredKMeans = mo.NumberListOperators.linearKMeans(clusteredNL, k);
function SSE(datasetName, numClusters) {
return function(dataset) {
// Sum up the sum of squared errors for each cluster
sse = 0;
for (var c = 0; c < dataset.length; ++c) {
mean = dataset[c].getAverage();
sse += dataset[c].subtract(mean).pow(2).getNorm();
}
elbowData[datasetName] = elbowData[datasetName] || [];
elbowData[datasetName].push([numClusters, sse]);
}
}
// Compute sum of squared errors for each cluster
SSE('uniform', k)(uniformKMeans);
SSE('clustered', k)(clusteredKMeans);
}
⊘ This is a preview!⊘
Do you want full access?
Subscribe today to unlock all pages.

Trusted by 1+ million students worldwide

}
function drawNumberLine(g, dataset, label, offset) {
var lineLen = 350;
var tickLen = 5;
var x = 50 + (offset || 0);
var y = 80;
var radius = 5;
var min = 0;
var max = 1;
if (newData) {
min = mo.NumberList.fromArray(dataset).getMin();
max = mo.NumberList.fromArray(dataset).getMax();
}
var range = max - min;
g.setStroke('#777');
g.setFill('rgba(125,125,125,0.5)');
// x-axis
g.line(x, y, x + lineLen, y);
// Ticks
g.line(x, y, x, y + tickLen);
g.line(x + lineLen / 2, y, x + lineLen / 2, y + tickLen);
g.line(x + lineLen, y, x + lineLen, y + tickLen);
// Draw each data point
dataset.forEach(function(d) {
Paraphrase This Document
Need a fresh take? Get an instant paraphrase of this document with our AI Paraphraser

g.fCircle(x + ((d - min) / range) * lineLen, y - 1.5 * radius, radius);
})
// Labels
g.setText('#555', 12, 'Arial', "center");
g.fText(min.toFixed(2), x, y + tickLen);
g.fText(((min + max) / 2).toFixed(2), x + lineLen / 2, y + tickLen);
g.fText(max.toFixed(2), x + lineLen, y + tickLen);
g.setText('#555', 16, 'Arial', 'center', 'bottom', 'bold');
g.fText(label, x + lineLen / 2, y - 4 * radius);
}
function drawElbowChart(g, datasetName, offset) {
var xLineLen = 350;
var yLineLen = 200;
var tickLen = 5;
var x = 50 + (offset || 0);
var y = 130;
var elbow = elbowData[datasetName];
var sseMax = elbow.map(function(pair) { return pair[1] });
sseMax = mo.NumberList.fromArray(sseMax).getMax();
g.setStroke("#777");
// Draw axes
g.line(x, y + yLineLen, x + xLineLen, y + yLineLen);
g.line(x, y + yLineLen, x, y)
// x-axis ticks and labels
for (var i = 1; i <= maxK; ++i) {

var xTick = Math.floor((i / maxK) * xLineLen);
g.line(x + xTick, y + yLineLen, x + xTick, y + yLineLen + tickLen);
g.setText('#555', 12, 'Arial', "center");
g.fText(i, x + xTick, y + yLineLen + tickLen);
}
// Axis title
g.fText("Number of clusters (k)", x + xLineLen / 2, y + yLineLen + tickLen + 12);
g.fTextRotated("Sum of squared errors", x - 16, y + yLineLen / 2, -Math.PI / 2);
g.setStroke("#333");
// Draw sum of square errors
for (var i = 1; i < elbow.length; ++i) {
var a = elbow[i - 1];
var b = elbow[i];
var xA = (a[0] / maxK) * xLineLen + x;
var yA = (1 - a[1] / sseMax) * yLineLen + y;
var xB = (b[0] / maxK) * xLineLen + x;
var yB = (1 - b[1] / sseMax) * yLineLen + y;
g.line(xA, yA, xB, yB);
}
}
function setup() {
g = new mo.Graphics({
container: "#maindiv",
dimensions: {
width: 960,
height: 380
},
⊘ This is a preview!⊘
Do you want full access?
Subscribe today to unlock all pages.

Trusted by 1+ million students worldwide

init: computeData,
cycle: function() {
this.setText('#555', 18, 'Arial', 'center', 'bottom', 'bold');
this.fText("K-means clustering SSE vs. number of clusters for two
random datasets", 450, 20);
this.setStroke("#aaa");
this.line(150, 25, 750, 25);
drawNumberLine(this, clustered, "Dataset A");
drawNumberLine(this, uniform, "Dataset B", 450);
drawElbowChart(this, 'clustered');
drawElbowChart(this, 'uniform', 450);
}
});
g.setBackgroundColor('white');
}
function inputChange() {
function parseInput(id) {
input = document.getElementById("input-" + id);
value = input.value;
dataset = value.split(",").map(function(d) {
val = Number(d);
if (isNaN(val) || !isFinite(val) || d.trim().length === 0) {
throw "Error parsing Dataset " + id.toUpperCase();
}
return val;
});
if (id == "a") {
clustered = dataset;
Paraphrase This Document
Need a fresh take? Get an instant paraphrase of this document with our AI Paraphraser

} else {
uniform = dataset;
}
}
try {
var id = "a";
parseInput(id);
id = "b";
parseInput(id);
computeData();
newData = true;
var errorDiv = document.getElementById('error');
error.innerHTML = "";
} catch (e) {
var errorDiv = document.getElementById('error');
error.innerHTML = e;
}
}
window.onload = function() {
var inputA = document.getElementById('input-a');
var inputB = document.getElementById('input-b');
inputA.value = clustered.join(", ");
inputB.value = uniform.join(", ");
setup();

}
</script>
<div id="maindiv"></div>
<div class="dataset-a">
Dataset A: <input type="text" id="input-a" size="45">
</div>
<div class="dataset-b">
Dataset B: <input type="text" id="input-b" size="45">
</div>
<div id="button">
<button type="button" onclick="inputChange()">Parse datasets</button>
</div>
<div id="error"></div>
b)
c).
d).
e).
Initialization is the process of locating and using the defined values for
variable data that is used by a computer program or defining a constant or
variable value that are used in the code for executing a computer program.
Initialization plays a key role in programming as the variables that are used for
writing the code occupy a certain amount of memory in the CPU. If the memory
values are not defined by the user at the start of the code’s execution, the CPU
will set the variable value to anything that is acceptable in computer programming
language, this is usually termed as garbage value.
If a garbage value is set for a variable, then the whole logic of the program
changes and will result in an incorrect value as the output. Some compilers will
not even set a garbage value for the variable and this results to a null value for the
⊘ This is a preview!⊘
Do you want full access?
Subscribe today to unlock all pages.

Trusted by 1+ million students worldwide

variable which can also result in a compile time error. Initialization is done either
by statically embedding the value at compile time, or else by assignment at run
time. Initialization is important because, historically, uninitialized data has been
a common source of bugs.
If variables are not initialized, then at least the variable values must be overwritten
to erase the garbage data and have a valid value for the variable which will ensure
that the program gives the desired output.
f).
#clustering dataset
# determine k using elbow method
from sklearn.cluster import KMeans
from sklearn import metrics
from scipy.spatial.distance import cdist
import numpy as np
import matplotlib.pyplot as plt
x1 = np.array([])# input dataset 1 values
x2 = np.array([])# input dataset 2 values
plt.plot()
plt.xlim([0, 10])
plt.ylim([0, 10])
plt.title('Dataset')
plt.scatter(x1, x2)
plt.show()
Paraphrase This Document
Need a fresh take? Get an instant paraphrase of this document with our AI Paraphraser

# create new plot and data
plt.plot()
X = np.array(list(zip(x1, x2))).reshape(len(x1), 2)
colors = ['b', 'g', 'r']
markers = ['o', 'v', 's']
# k means determine k
distortions = []
K = 5
for k in K:
kmeanModel = KMeans(n_clusters=k).fit(X)
kmeanModel.fit(X)
distortions.append(sum(np.min(cdist(X, kmeanModel.cluster_centers_, 'euclidean'), axis=1)) /
X.shape[0])
# Plot the elbow
plt.plot(K, distortions, 'bx-')
plt.xlabel('k')
plt.ylabel('Distortion')
plt.title('The Elbow Method showing the optimal k')
plt.show()
3.
The estimate values of
Θ1= 0.4491
Θ2 =2.25
The approach with formula used

⊘ This is a preview!⊘
Do you want full access?
Subscribe today to unlock all pages.

Trusted by 1+ million students worldwide
1 out of 13
Your All-in-One AI-Powered Toolkit for Academic Success.
+13062052269
info@desklib.com
Available 24*7 on WhatsApp / Email
Unlock your academic potential
Copyright © 2020–2025 A2Z Services. All Rights Reserved. Developed and managed by ZUCOL.