Ask a question from expert
Statistical Techniques and Methods in Different Manufacturing
8 Pages3026 Words373 Views
Added on 2019-09-16
Statistical Techniques and Methods in Different Manufacturing
Added on 2019-09-16
BookmarkShareRelated Documents
KING ABDULAZIZ UNIVERSITYFACULTY OF ENGINEERINGDEPARTMENT OF INDUSTRIAL ENGINEERINGIE 332Engineering Statistics IIFall 2016/2017Submission DateSunday, 27 Nov. 2016 (27/02/1438 H) at 14:30 PMDue DateSunday, 11 Dec. 2016 (12/03/1438 H) at 14:30 PMMarks180 (15% of the total marks)Group LeaderID:Student # 2ID:Student # 3ID:Student # 4ID:SectionCA; (Eng. Mohammed Alharkan)Question #Ev.Q1Q2Q3Q4TOTALMarks1834574130180Group’s MarksNOTESShow your work, charts, tables and calculations.Using Excel and Minitab is essential (Copy & Paste the output).Failure to submit the solution by the due date means you will lose 2% from the total marks daily.Similar solutions for any two groups mean they are cheating and both will get ZERO.Eng. Mohammed Alharkan Nov. 2015
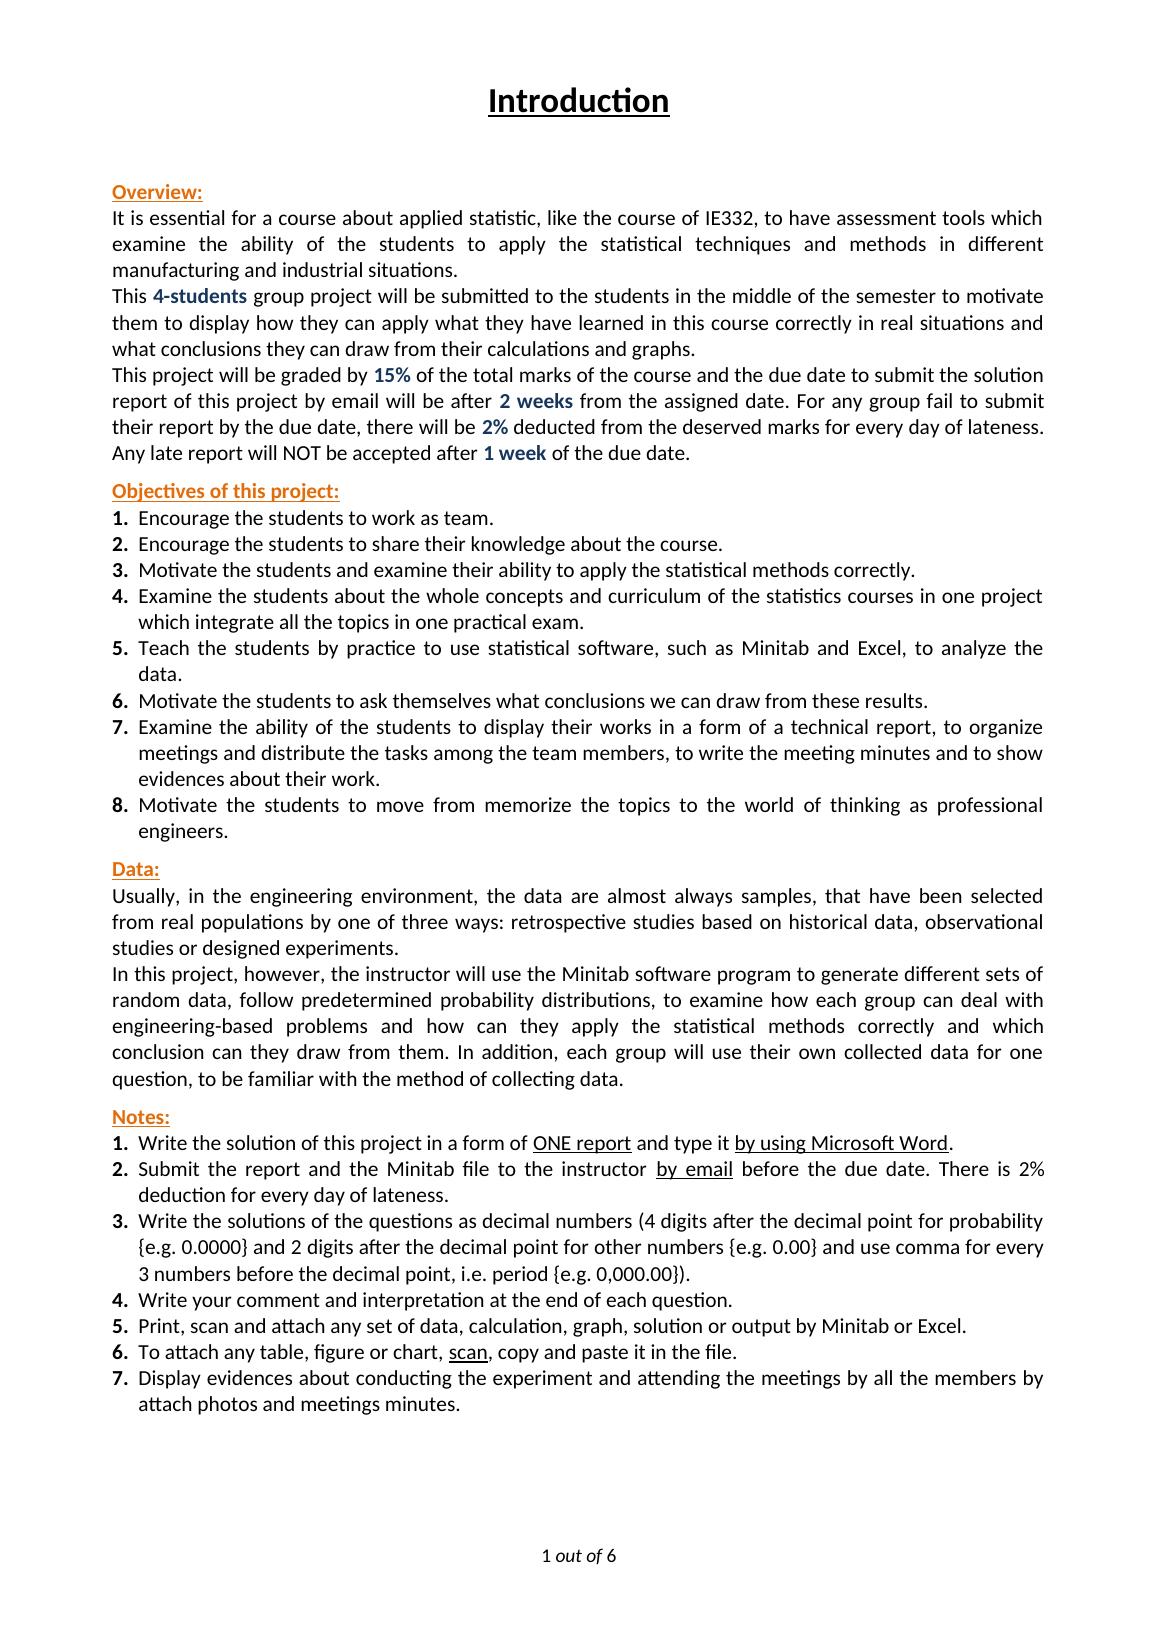
IntroductionOverview:It is essential for a course about applied statistic, like the course of IE332, to have assessment tools whichexamine the ability of the students to apply the statistical techniques and methods in differentmanufacturing and industrial situations.This 4-students group project will be submitted to the students in the middle of the semester to motivatethem to display how they can apply what they have learned in this course correctly in real situations andwhat conclusions they can draw from their calculations and graphs.This project will be graded by 15% of the total marks of the course and the due date to submit the solutionreport of this project by email will be after 2 weeks from the assigned date. For any group fail to submittheir report by the due date, there will be 2% deducted from the deserved marks for every day of lateness.Any late report will NOT be accepted after 1 week of the due date.Objectives of this project:1.Encourage the students to work as team.2.Encourage the students to share their knowledge about the course.3.Motivate the students and examine their ability to apply the statistical methods correctly.4.Examine the students about the whole concepts and curriculum of the statistics courses in one projectwhich integrate all the topics in one practical exam.5.Teach the students by practice to use statistical software, such as Minitab and Excel, to analyze thedata.6.Motivate the students to ask themselves what conclusions we can draw from these results.7.Examine the ability of the students to display their works in a form of a technical report, to organizemeetings and distribute the tasks among the team members, to write the meeting minutes and to showevidences about their work.8.Motivate the students to move from memorize the topics to the world of thinking as professionalengineers.Data:Usually, in the engineering environment, the data are almost always samples, that have been selectedfrom real populations by one of three ways: retrospective studies based on historical data, observationalstudies or designed experiments.In this project, however, the instructor will use the Minitab software program to generate different sets ofrandom data, follow predetermined probability distributions, to examine how each group can deal withengineering-based problems and how can they apply the statistical methods correctly and whichconclusion can they draw from them. In addition, each group will use their own collected data for onequestion, to be familiar with the method of collecting data.Notes:1.Write the solution of this project in a form of ONE report and type it by using Microsoft Word.2.Submit the report and the Minitab file to the instructor by email before the due date. There is 2%deduction for every day of lateness.3.Write the solutions of the questions as decimal numbers (4 digits after the decimal point for probability{e.g. 0.0000} and 2 digits after the decimal point for other numbers {e.g. 0.00} and use comma for every3 numbers before the decimal point, i.e. period {e.g. 0,000.00}).4.Write your comment and interpretation at the end of each question.5.Print, scan and attach any set of data, calculation, graph, solution or output by Minitab or Excel.6.To attach any table, figure or chart, scan, copy and paste it in the file.7.Display evidences about conducting the experiment and attending the meetings by all the members byattach photos and meetings minutes.1out of 6
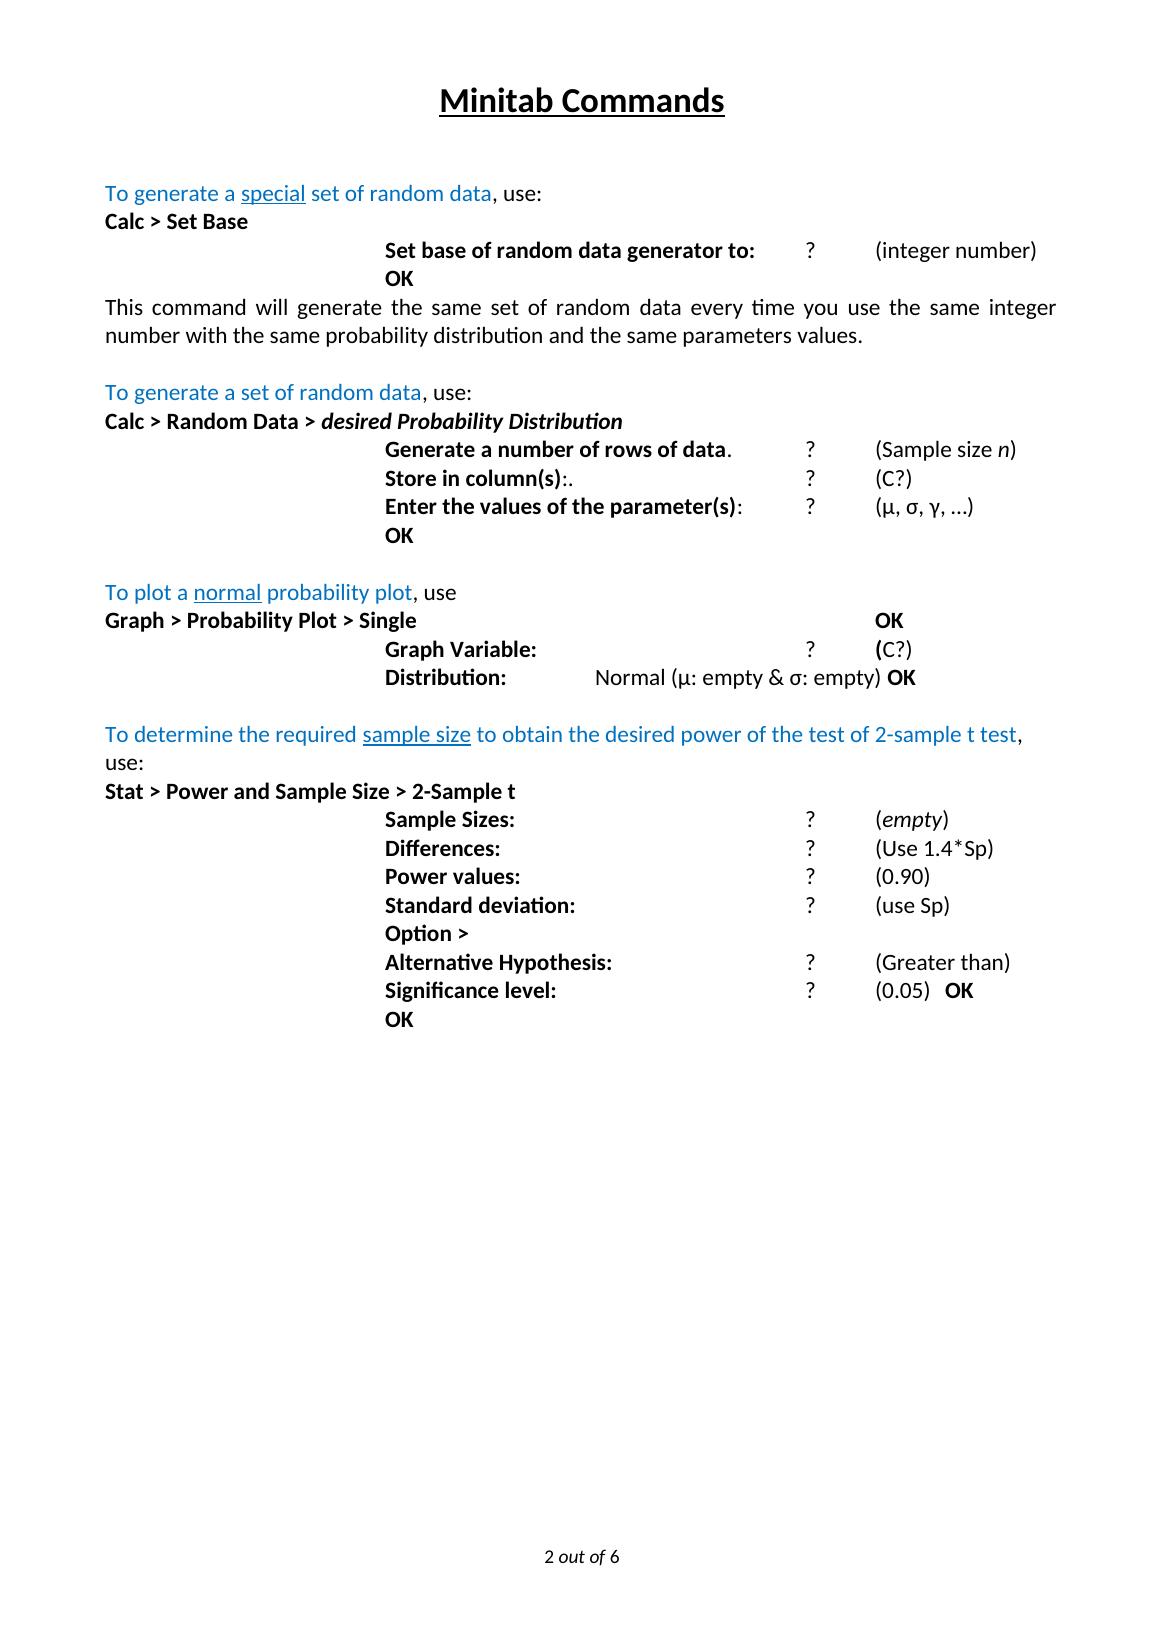
Minitab CommandsTo generate a special set of random data, use:Calc > Set BaseSet base of random data generator to:?(integer number)OKThis command will generate the same set of random data every time you use the same integernumber with the same probability distribution and the same parameters values.To generate a set of random data, use:Calc > Random Data > desired Probability DistributionGenerate a number of rows of data.?(Sample size n)Store in column(s):.?(C?)Enter the values of the parameter(s):?(μ, σ, γ, ...)OKTo plot a normal probability plot, useGraph > Probability Plot > SingleOKGraph Variable:?(C?)Distribution:Normal (μ: empty & σ: empty) OKTo determine the required sample size to obtain the desired power of the test of 2-sample t test, use:Stat > Power and Sample Size > 2-Sample tSample Sizes:?(empty)Differences:?(Use 1.4*Sp)Power values:?(0.90)Standard deviation:?(use Sp)Option >Alternative Hypothesis:?(Greater than)Significance level:?(0.05)OKOK2out of 6
End of preview
Want to access all the pages? Upload your documents or become a member.
Related Documents
Software Engineering Assessment Brief for Component 1 and 2lg...
|8
|2110
|215
Prices of Property and Housing - Statistical Analysislg...
|11
|1563
|491
Macroeconomics - Assignment Samplelg...
|6
|1807
|212
BIT103/DIP203 Assignment Introduction to Structured Programminglg...
|6
|1673
|358
Statistical Analysis of Unleaded 91 Fuel Priceslg...
|13
|2117
|308
Assignment on Programminglg...
|3
|798
|299