Saturation Pressure Measurement and Effects of Thermal Lag
Added on 2023-04-08
6 Pages1373 Words332 Views
LAB REPORT ON SATURATION PRESSURE MEASUREMENT AIMED AT
DETERMINING THE EFFECTS OF THERMAL LAG
ABSTRACT
This experiment aims at understanding of the principles behind saturation pressure
measurement with a view to determine the effects on accuracy of results as due to
unsteady conditions i.e. thermal lag effect. In a bid to determine this, using a pressured
vessel, the temperatures of water is measured against the corresponding pressure
values. The Platinum resistance thermometer used yields an electrical output
resistance for every pressure values measured by the semiconductor –type electronic
pressure sensor. These resistance values read from the Platinum Resistance
thermometer are thereafter converted, using suitable charts and relevant formulae
provided in the lab manual and formulae, to give the measured temperature readings.
The series of data obtained from the experimental results are used to plot various
graphs used to determine the thermal lag phenomenon.
INTRODUCTION
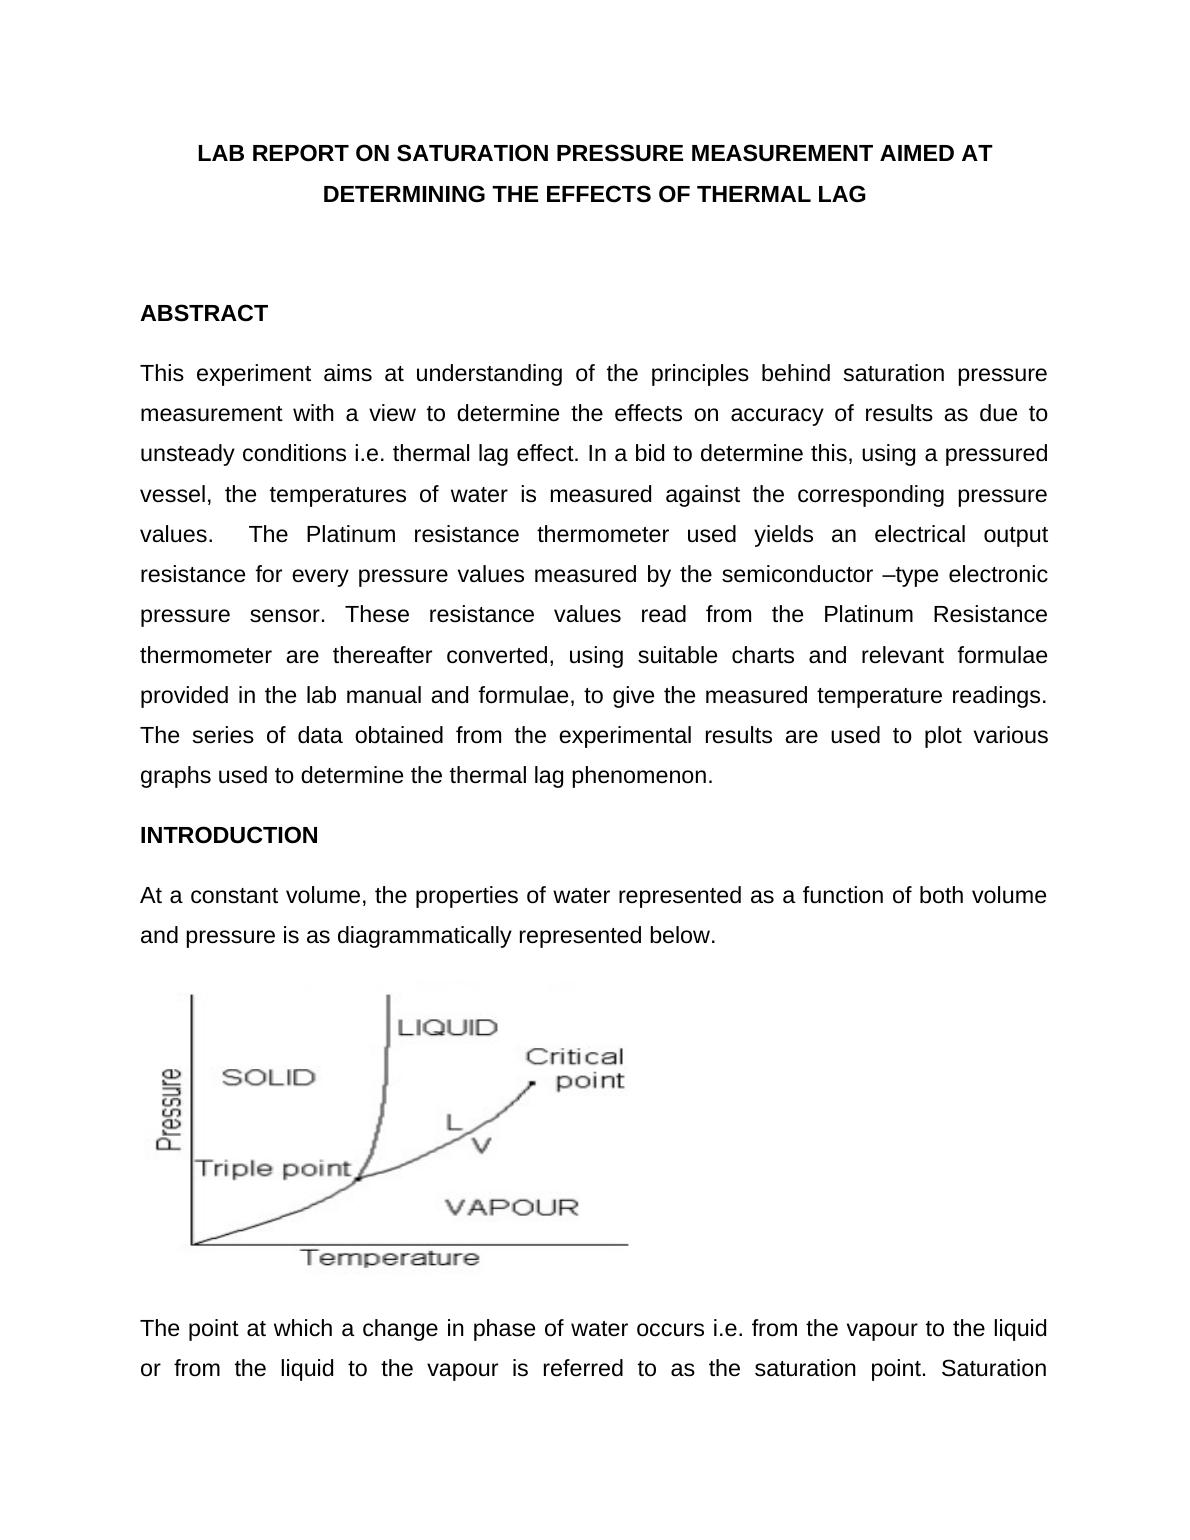
At a constant volume, the properties of water represented as a function of both volume
and pressure is as diagrammatically represented below.
The point at which a change in phase of water occurs i.e. from the vapour to the liquid
or from the liquid to the vapour is referred to as the saturation point. Saturation
DETERMINING THE EFFECTS OF THERMAL LAG
ABSTRACT
This experiment aims at understanding of the principles behind saturation pressure
measurement with a view to determine the effects on accuracy of results as due to
unsteady conditions i.e. thermal lag effect. In a bid to determine this, using a pressured
vessel, the temperatures of water is measured against the corresponding pressure
values. The Platinum resistance thermometer used yields an electrical output
resistance for every pressure values measured by the semiconductor –type electronic
pressure sensor. These resistance values read from the Platinum Resistance
thermometer are thereafter converted, using suitable charts and relevant formulae
provided in the lab manual and formulae, to give the measured temperature readings.
The series of data obtained from the experimental results are used to plot various
graphs used to determine the thermal lag phenomenon.
INTRODUCTION
At a constant volume, the properties of water represented as a function of both volume
and pressure is as diagrammatically represented below.
The point at which a change in phase of water occurs i.e. from the vapour to the liquid
or from the liquid to the vapour is referred to as the saturation point. Saturation
temperature is the temperatures at which a liquid boils into water phase for a
corresponding saturation pressure. The liquid at this stage is saturated with thermal
energy thus phase transition occurs on any slight addition of thermal energy. For an
isobaric system (a system in which pressure is constant), as the thermal energy is
removed, condensation of vapour at saturation temperatures into liquid occurs.
Additional thermal energy would however boil a liquid at saturation temperature and
pressure into vapour phase.
The pressure at which the liquid boils into vapour phase at a saturation temperature is
referred to as saturation pressure. Saturation temperatures and saturation pressure are
directly proportional to each other i.e. an increase in saturation temperatures would
increase pressure. Vapour at saturation temperatures and pressure begins to condense
into liquid phase of an isothermal system. This happens when the pressure of the
system is increased.
METHODOLOGY
The apparatus used in conducting this experiment consists of semiconductor –type
electronic pressure sensor and platinum resistance thermometers. The latter apparatus
measures temperatures with an electrical output in Ohms. A measurable change in the
resistance of the semiconductor is produced due to the compression and tension in the
gauges.
To set up the experiment, the drain valve and the calorimeter valve were both confirmed
to be closed. A confirmation of the ‘óff’ state of the mains power to the console was
made before the boiler was filled. The filling point was opened and the equipment filled
with de-ionized water to halfway levels of the sight-glass. The console and its mains
power were then both switched off.
After the above described set up, heater was switched on and its control turned to
maximum levels. Intense movement of water at the surface and presence of steam
escaping from the filling point indicated that water had reached its boiling point. In a bid
to allow for the maintenance of non-excessive but steady stream of steam, the power of
the heater was reduced. When the steadiness of resistance Rm1 had been achieved,
the reading of sensor’s pressure (P1) was noted as the pressure inside the vessel. The
corresponding resistance value for this pressure was read from the Platinum Resistance
thermometer. The filler valve was then switched off and the heater returned to maximum
power. Thermometer output was recorded at two-minute intervals and the electronic
pressure sensor readings too. After the maximum working pressure was achieved, the
heater was turned off. The electronic pressure readings were recorded at every 5-
minute interval of the corresponding thermometer output readings. This step was
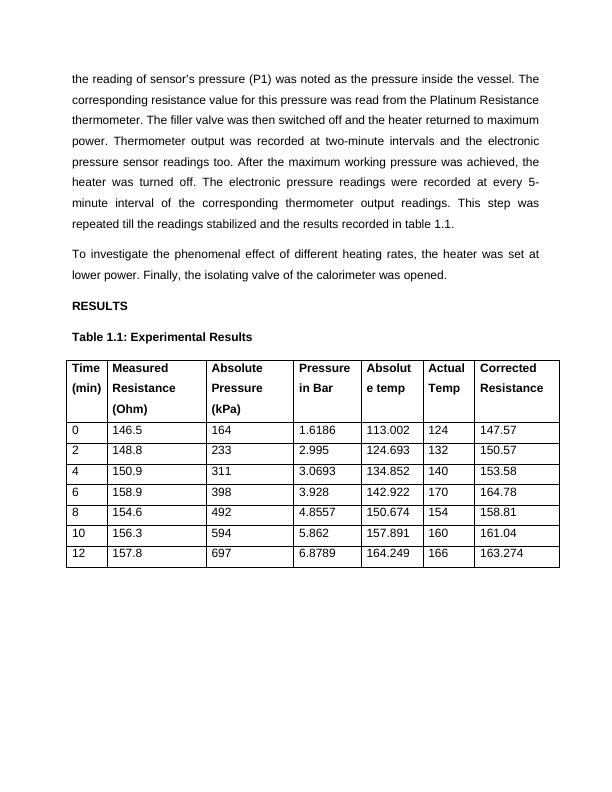
repeated till the readings stabilized and the results recorded in table 1.1.
To investigate the phenomenal effect of different heating rates, the heater was set at
lower power. Finally, the isolating valve of the calorimeter was opened.
RESULTS
Table 1.1: Experimental Results
Time
(min)
Measured
Resistance
(Ohm)
Absolute
Pressure
(kPa)
Pressure
in Bar
Absolut
e temp
Actual
Temp
Corrected
Resistance
0 146.5 164 1.6186 113.002 124 147.57
2 148.8 233 2.995 124.693 132 150.57
4 150.9 311 3.0693 134.852 140 153.58
6 158.9 398 3.928 142.922 170 164.78
8 154.6 492 4.8557 150.674 154 158.81
10 156.3 594 5.862 157.891 160 161.04
12 157.8 697 6.8789 164.249 166 163.274
corresponding resistance value for this pressure was read from the Platinum Resistance
thermometer. The filler valve was then switched off and the heater returned to maximum
power. Thermometer output was recorded at two-minute intervals and the electronic
pressure sensor readings too. After the maximum working pressure was achieved, the
heater was turned off. The electronic pressure readings were recorded at every 5-
minute interval of the corresponding thermometer output readings. This step was
repeated till the readings stabilized and the results recorded in table 1.1.
To investigate the phenomenal effect of different heating rates, the heater was set at
lower power. Finally, the isolating valve of the calorimeter was opened.
RESULTS
Table 1.1: Experimental Results
Time
(min)
Measured
Resistance
(Ohm)
Absolute
Pressure
(kPa)
Pressure
in Bar
Absolut
e temp
Actual
Temp
Corrected
Resistance
0 146.5 164 1.6186 113.002 124 147.57
2 148.8 233 2.995 124.693 132 150.57
4 150.9 311 3.0693 134.852 140 153.58
6 158.9 398 3.928 142.922 170 164.78
8 154.6 492 4.8557 150.674 154 158.81
10 156.3 594 5.862 157.891 160 161.04
12 157.8 697 6.8789 164.249 166 163.274
End of preview
Want to access all the pages? Upload your documents or become a member.
Related Documents
(PDF) Thermofluids Laboratory: Heat Transfer Experimentlg...
|15
|1629
|305