LCBB5002 Management Accounting Report: XLG plc Variance Analysis
VerifiedAdded on 2023/01/07
|15
|3261
|39
Report
AI Summary
This report, prepared for a Management Accounting course, analyzes the financial performance of XLG plc, a chemical production company. The report is divided into two parts: Part A focuses on calculating various variances, including sales price variance, sales volume contribution variance, material price planning variance, and material price operational variance. Part B explores two alternative strategies for the company, considering the impact of increased import costs. The report critically analyzes the merits and demerits of using variances in assessing managers' performance, providing a detailed overview of the financial implications and strategic considerations for XLG plc. The student has contributed this assignment to Desklib, a platform offering AI-powered study tools.

LCBB5002
MANAGEMENT
ACCOUNTING
REPORT
MANAGEMENT
ACCOUNTING
REPORT
Paraphrase This Document
Need a fresh take? Get an instant paraphrase of this document with our AI Paraphraser
Contents
INTRODUCTION.....................................................................................................................................3
MAIN BODY.............................................................................................................................................3
Part A:.....................................................................................................................................................3
Part B:....................................................................................................................................................10
CONCLUSION........................................................................................................................................14
REFERENCES........................................................................................................................................15
INTRODUCTION
In companies of different sectors, accounting is considered as one of the core element
that need to be consider. Accounting can be understood as a way by which financial transactions
are categorized from overall business transactions and recorded in books of accounts (ter Bogt,
and Scapens, 2019). Mainly, there are two types of accounting which are financial and
management accounting (MA). The term MA is known as systematic way of preparing internal
reports that contains information related to quantitative and qualitative aspects. The project is
based on a company that is XLG plc. This company is involved in producing chemicals products.
Main objective of report is to understand about different kinds of variances that can occur due to
change in market conditions. The report is divided in to parts that are A&B. In the part A,
calculation of different variances has been done while in part B, explanation of two alternatives
is done in order to take correct decision.
MAIN BODY
Part A:
Calculation of followings:
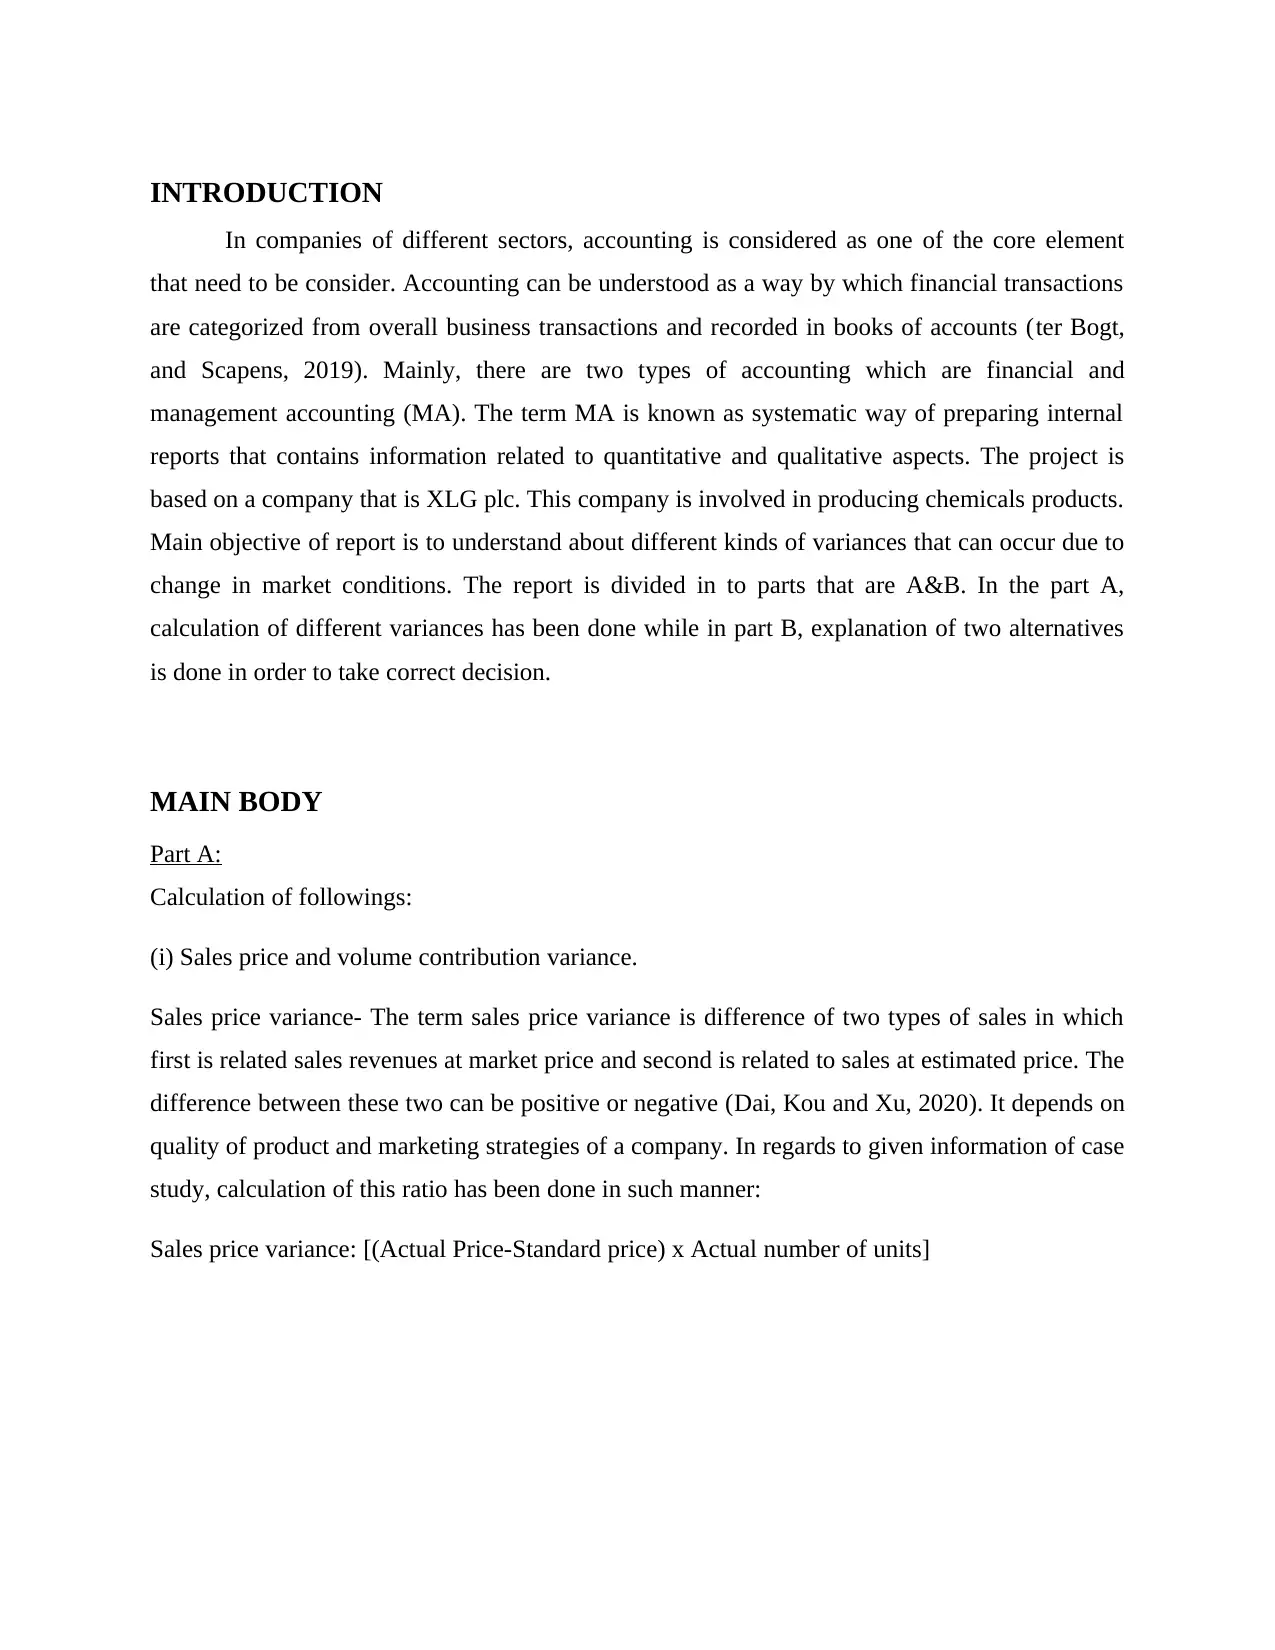
(i) Sales price and volume contribution variance.
Sales price variance- The term sales price variance is difference of two types of sales in which
first is related sales revenues at market price and second is related to sales at estimated price. The
difference between these two can be positive or negative (Dai, Kou and Xu, 2020). It depends on
quality of product and marketing strategies of a company. In regards to given information of case
study, calculation of this ratio has been done in such manner:
Sales price variance: [(Actual Price-Standard price) x Actual number of units]
In companies of different sectors, accounting is considered as one of the core element
that need to be consider. Accounting can be understood as a way by which financial transactions
are categorized from overall business transactions and recorded in books of accounts (ter Bogt,
and Scapens, 2019). Mainly, there are two types of accounting which are financial and
management accounting (MA). The term MA is known as systematic way of preparing internal
reports that contains information related to quantitative and qualitative aspects. The project is
based on a company that is XLG plc. This company is involved in producing chemicals products.
Main objective of report is to understand about different kinds of variances that can occur due to
change in market conditions. The report is divided in to parts that are A&B. In the part A,
calculation of different variances has been done while in part B, explanation of two alternatives
is done in order to take correct decision.
MAIN BODY
Part A:
Calculation of followings:
(i) Sales price and volume contribution variance.
Sales price variance- The term sales price variance is difference of two types of sales in which
first is related sales revenues at market price and second is related to sales at estimated price. The
difference between these two can be positive or negative (Dai, Kou and Xu, 2020). It depends on
quality of product and marketing strategies of a company. In regards to given information of case
study, calculation of this ratio has been done in such manner:
Sales price variance: [(Actual Price-Standard price) x Actual number of units]
⊘ This is a preview!⊘
Do you want full access?
Subscribe today to unlock all pages.
Trusted by 1+ million students worldwide
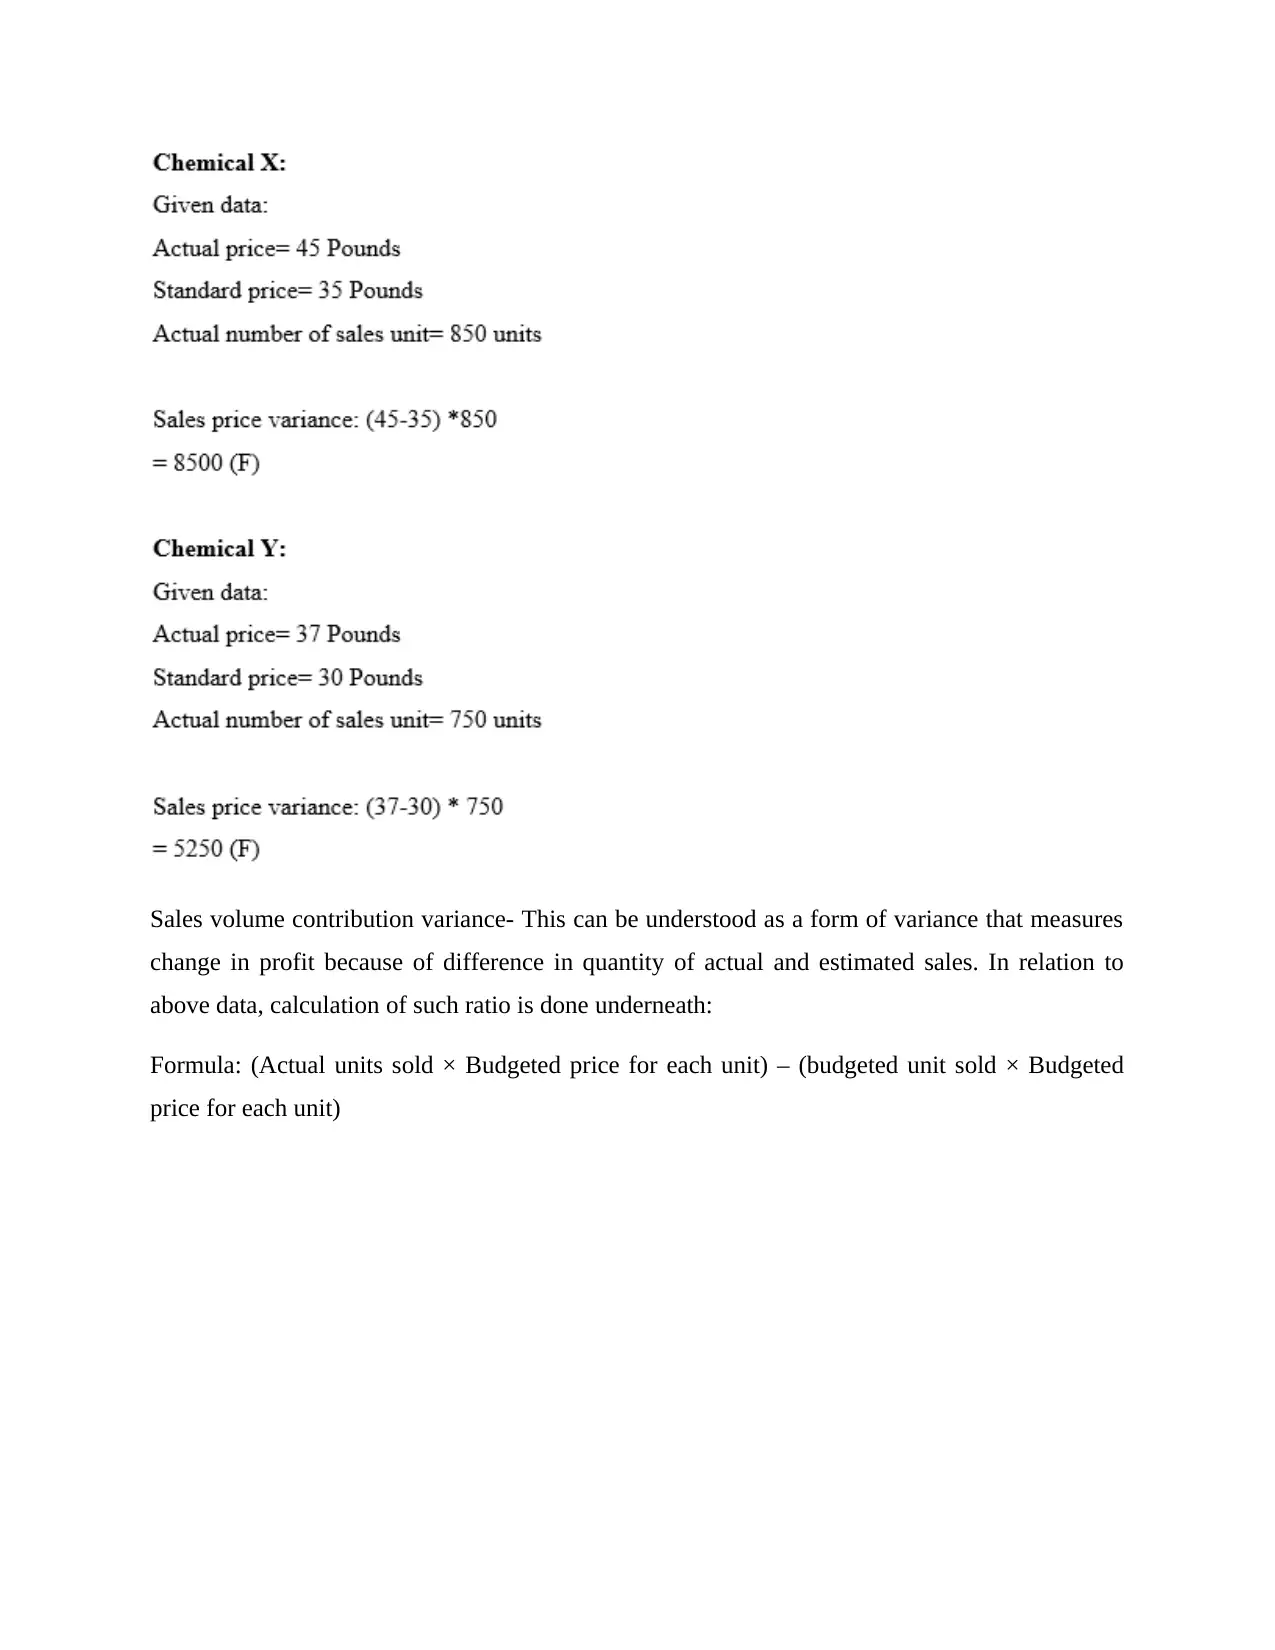
Sales volume contribution variance- This can be understood as a form of variance that measures
change in profit because of difference in quantity of actual and estimated sales. In relation to
above data, calculation of such ratio is done underneath:
Formula: (Actual units sold × Budgeted price for each unit) – (budgeted unit sold × Budgeted
price for each unit)
change in profit because of difference in quantity of actual and estimated sales. In relation to
above data, calculation of such ratio is done underneath:
Formula: (Actual units sold × Budgeted price for each unit) – (budgeted unit sold × Budgeted
price for each unit)
Paraphrase This Document
Need a fresh take? Get an instant paraphrase of this document with our AI Paraphraser
(ii) The material price planning variance and material price operational variance.
Material price planning variance: It is a form of variance that is measured to assess the difference
between prices of actual and estimated material (Xu, Mili and Zhao, 2019). There is a particular
formula to compute this variance that is explained below in such way:
Formula: [(Revised budgeted sales x Standard Margin)- (Actual Sales Quantity X Standard
Margin)]
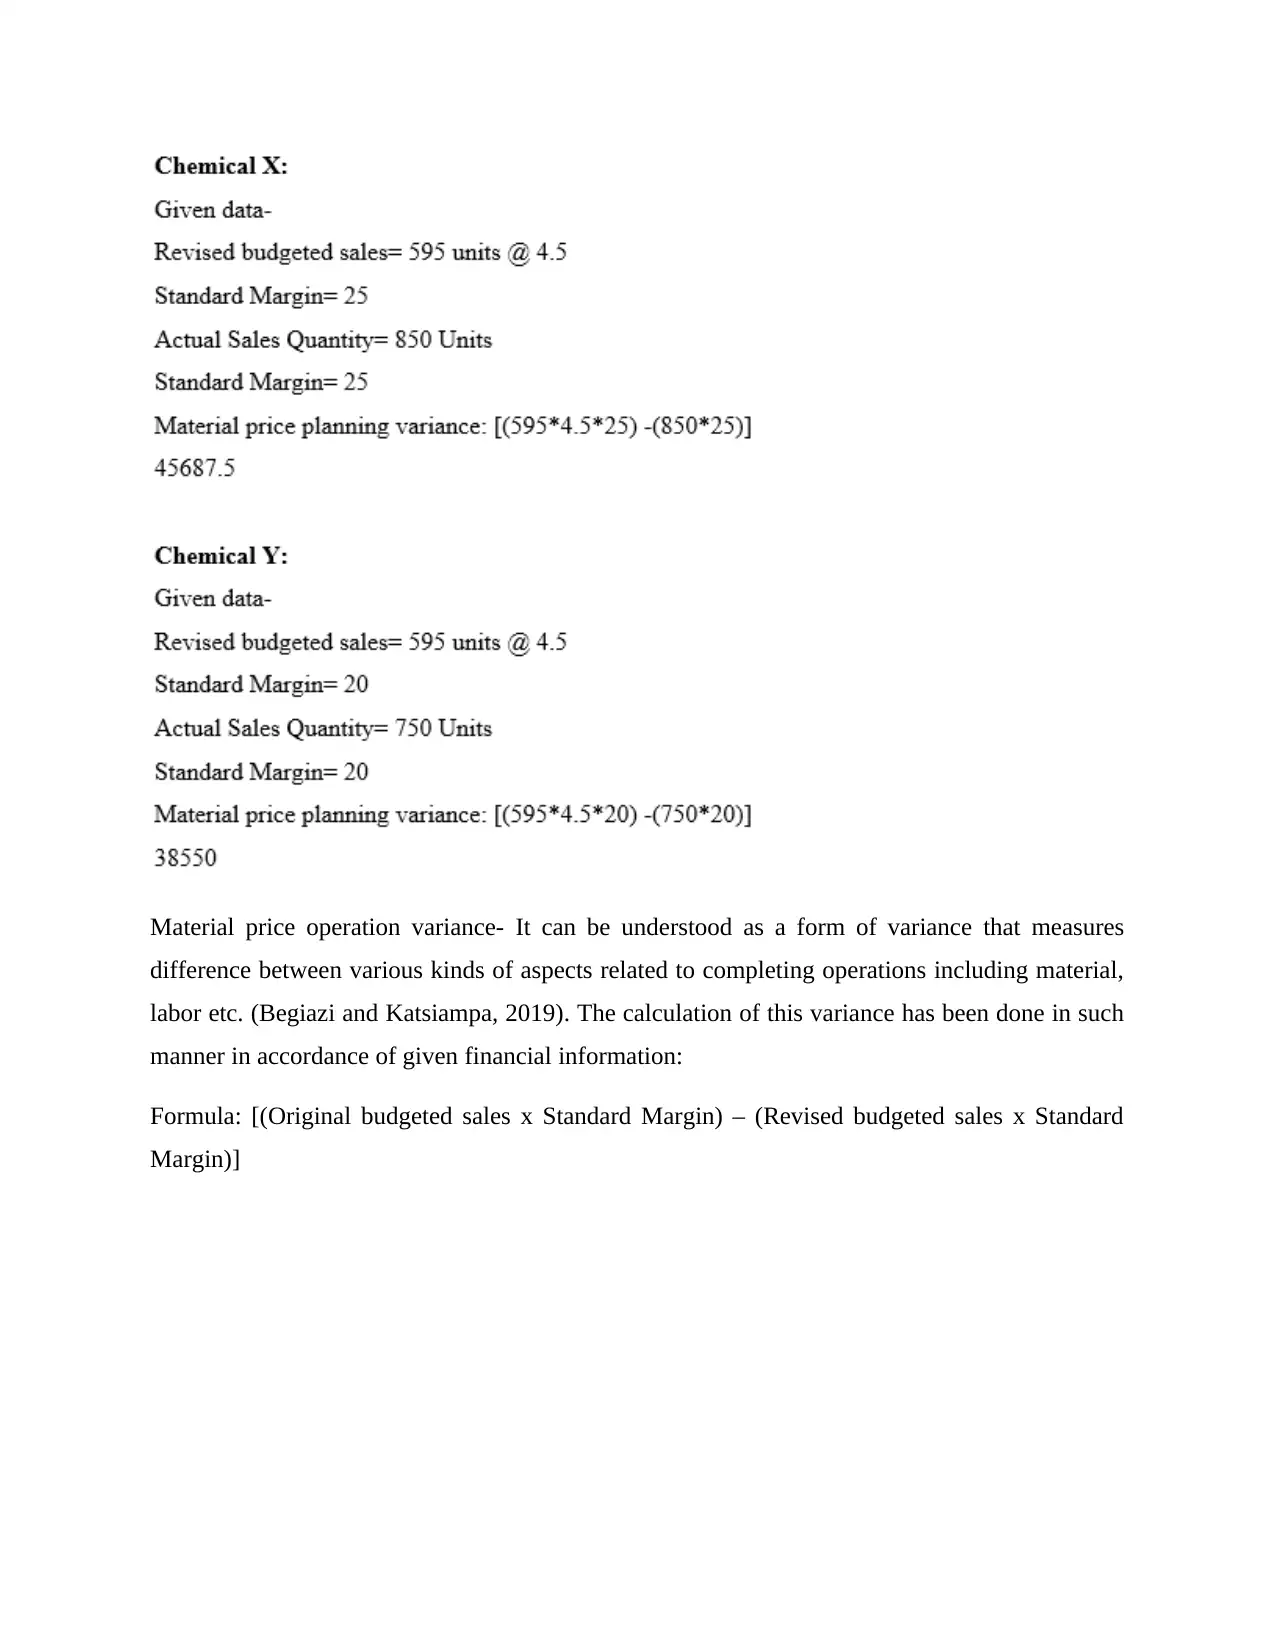
Material price operation variance- It can be understood as a form of variance that measures
difference between various kinds of aspects related to completing operations including material,
labor etc. (Begiazi and Katsiampa, 2019). The calculation of this variance has been done in such
manner in accordance of given financial information:
Formula: [(Original budgeted sales x Standard Margin) – (Revised budgeted sales x Standard
Margin)]
⊘ This is a preview!⊘
Do you want full access?
Subscribe today to unlock all pages.
Trusted by 1+ million students worldwide
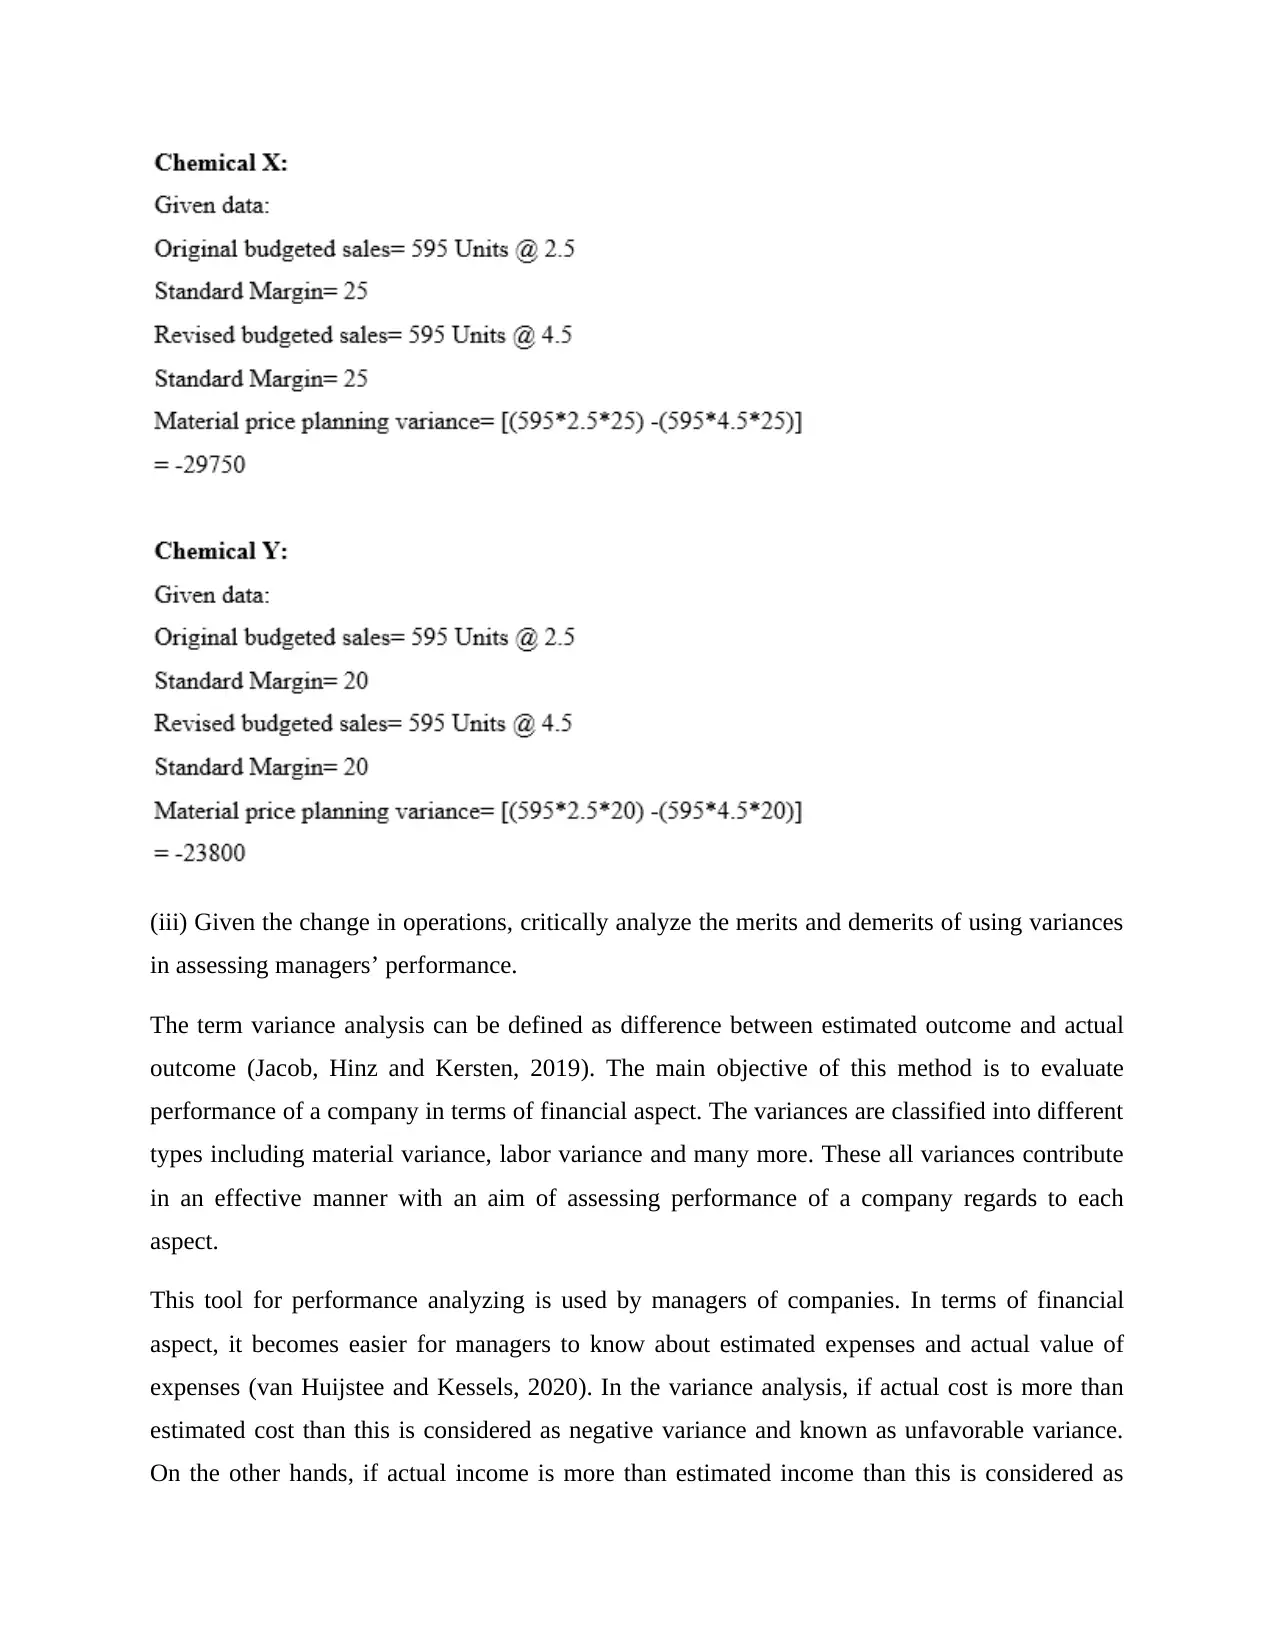
(iii) Given the change in operations, critically analyze the merits and demerits of using variances
in assessing managers’ performance.
The term variance analysis can be defined as difference between estimated outcome and actual
outcome (Jacob, Hinz and Kersten, 2019). The main objective of this method is to evaluate
performance of a company in terms of financial aspect. The variances are classified into different
types including material variance, labor variance and many more. These all variances contribute
in an effective manner with an aim of assessing performance of a company regards to each
aspect.
This tool for performance analyzing is used by managers of companies. In terms of financial
aspect, it becomes easier for managers to know about estimated expenses and actual value of
expenses (van Huijstee and Kessels, 2020). In the variance analysis, if actual cost is more than
estimated cost than this is considered as negative variance and known as unfavorable variance.
On the other hands, if actual income is more than estimated income than this is considered as
Paraphrase This Document
Need a fresh take? Get an instant paraphrase of this document with our AI Paraphraser
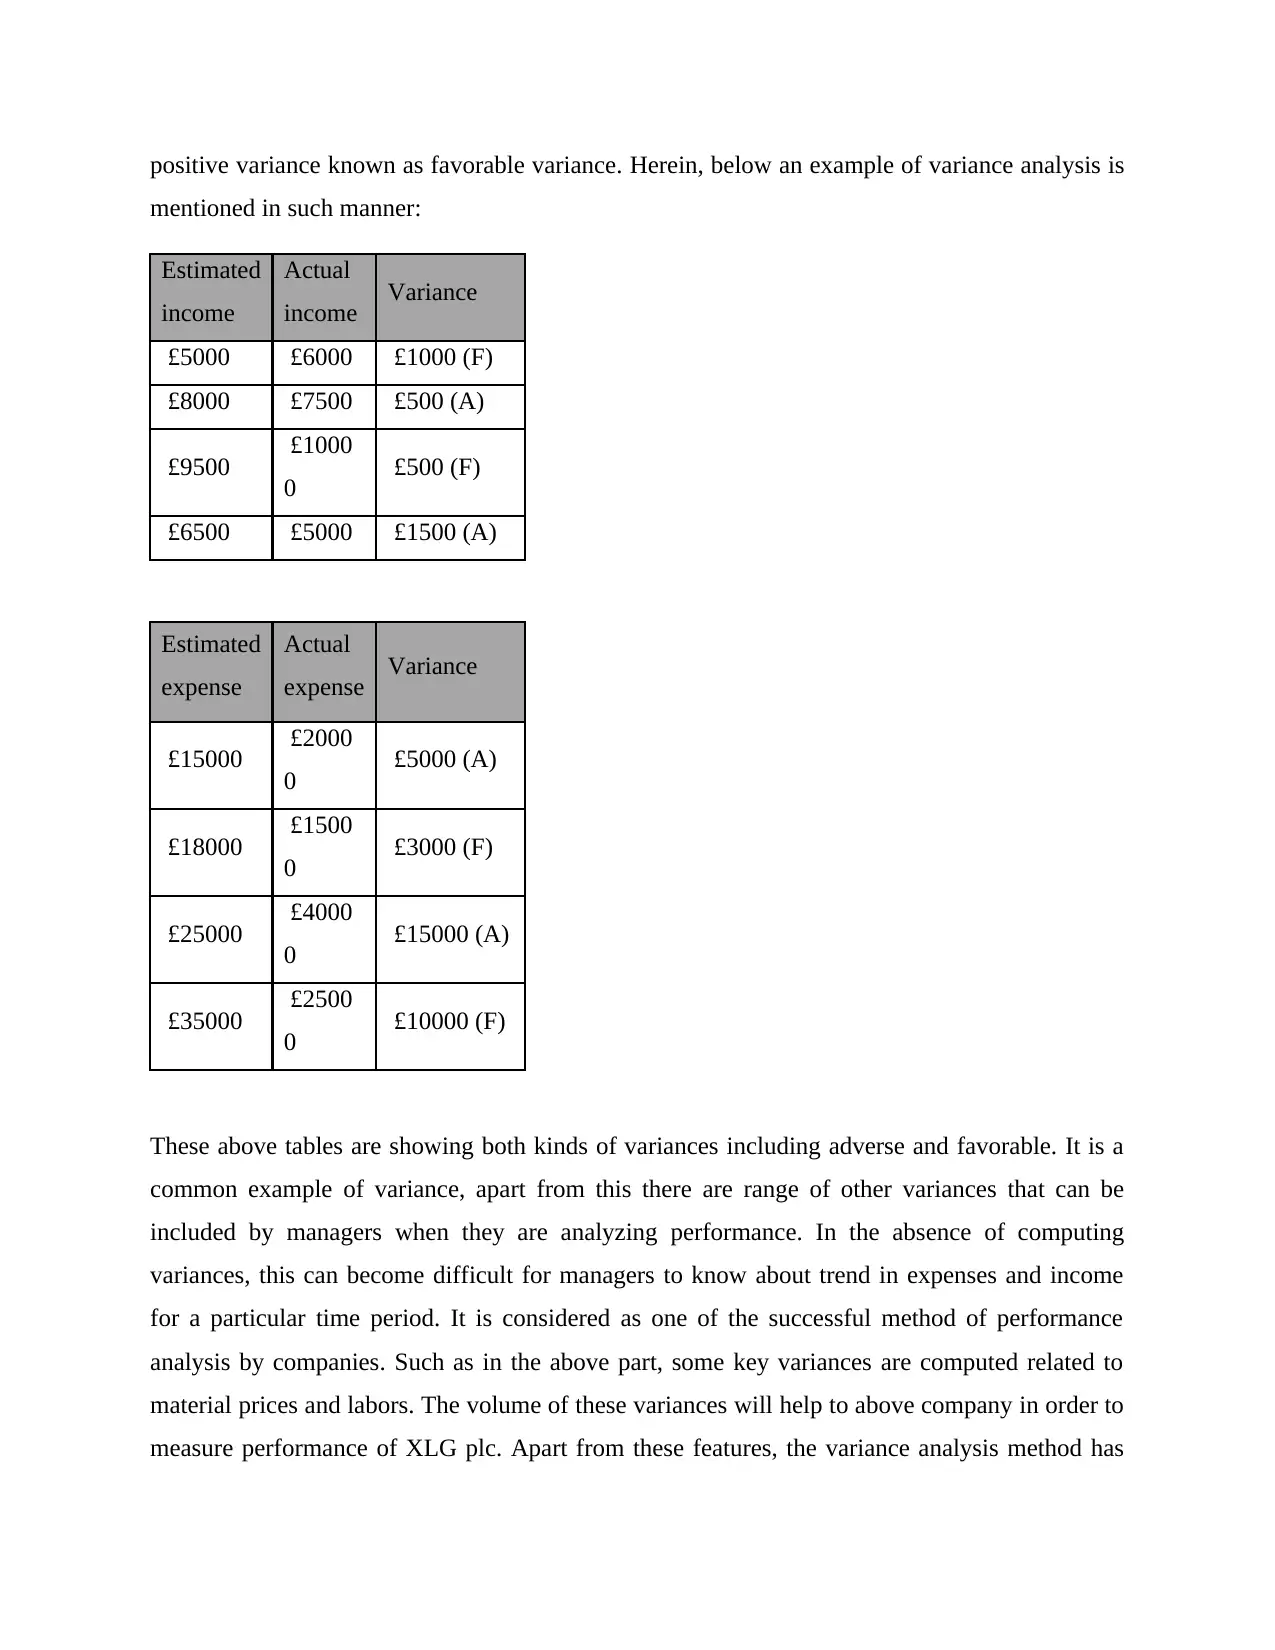
positive variance known as favorable variance. Herein, below an example of variance analysis is
mentioned in such manner:
Estimated
income
Actual
income Variance
£5000 £6000 £1000 (F)
£8000 £7500 £500 (A)
£9500 £1000
0 £500 (F)
£6500 £5000 £1500 (A)
Estimated
expense
Actual
expense Variance
£15000 £2000
0 £5000 (A)
£18000 £1500
0 £3000 (F)
£25000 £4000
0 £15000 (A)
£35000 £2500
0 £10000 (F)
These above tables are showing both kinds of variances including adverse and favorable. It is a
common example of variance, apart from this there are range of other variances that can be
included by managers when they are analyzing performance. In the absence of computing
variances, this can become difficult for managers to know about trend in expenses and income
for a particular time period. It is considered as one of the successful method of performance
analysis by companies. Such as in the above part, some key variances are computed related to
material prices and labors. The volume of these variances will help to above company in order to
measure performance of XLG plc. Apart from these features, the variance analysis method has
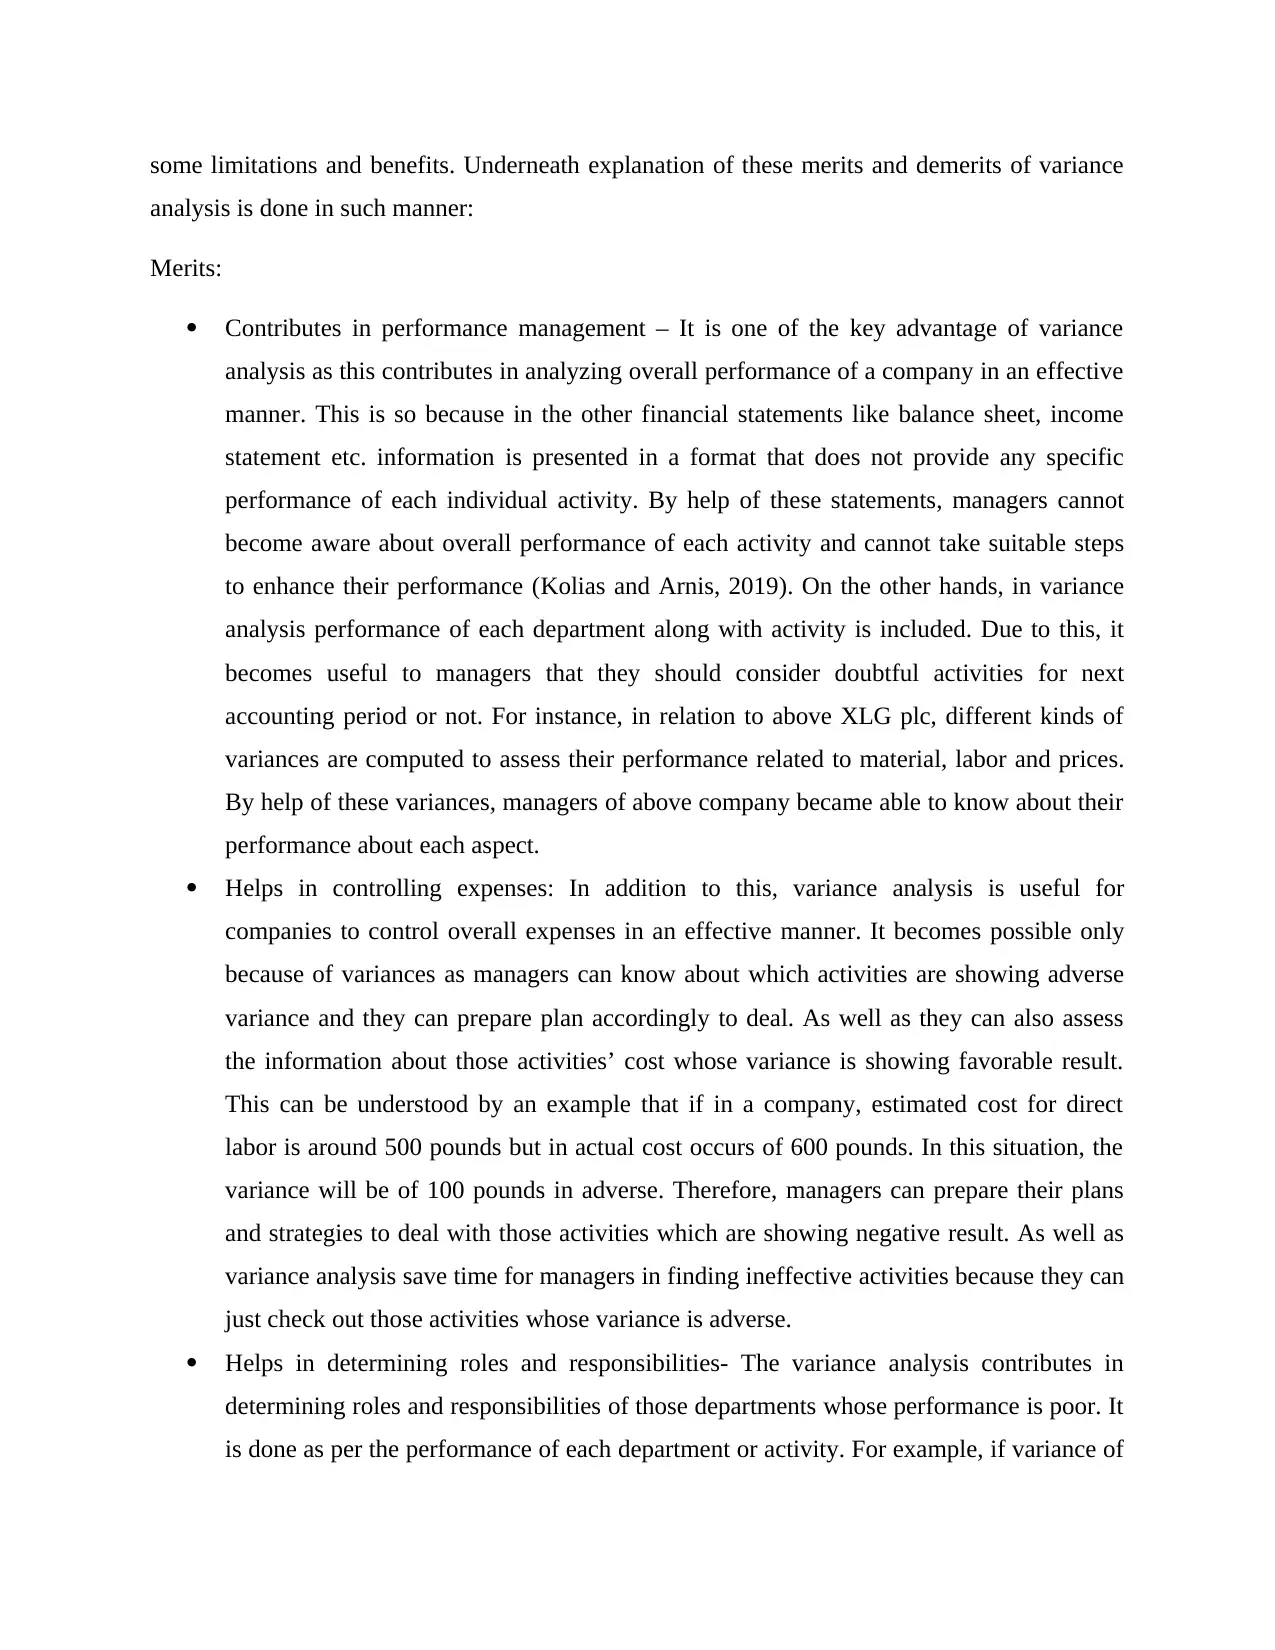
some limitations and benefits. Underneath explanation of these merits and demerits of variance
analysis is done in such manner:
Merits:
Contributes in performance management – It is one of the key advantage of variance
analysis as this contributes in analyzing overall performance of a company in an effective
manner. This is so because in the other financial statements like balance sheet, income
statement etc. information is presented in a format that does not provide any specific
performance of each individual activity. By help of these statements, managers cannot
become aware about overall performance of each activity and cannot take suitable steps
to enhance their performance (Kolias and Arnis, 2019). On the other hands, in variance
analysis performance of each department along with activity is included. Due to this, it
becomes useful to managers that they should consider doubtful activities for next
accounting period or not. For instance, in relation to above XLG plc, different kinds of
variances are computed to assess their performance related to material, labor and prices.
By help of these variances, managers of above company became able to know about their
performance about each aspect.
Helps in controlling expenses: In addition to this, variance analysis is useful for
companies to control overall expenses in an effective manner. It becomes possible only
because of variances as managers can know about which activities are showing adverse
variance and they can prepare plan accordingly to deal. As well as they can also assess
the information about those activities’ cost whose variance is showing favorable result.
This can be understood by an example that if in a company, estimated cost for direct
labor is around 500 pounds but in actual cost occurs of 600 pounds. In this situation, the
variance will be of 100 pounds in adverse. Therefore, managers can prepare their plans
and strategies to deal with those activities which are showing negative result. As well as
variance analysis save time for managers in finding ineffective activities because they can
just check out those activities whose variance is adverse.
Helps in determining roles and responsibilities- The variance analysis contributes in
determining roles and responsibilities of those departments whose performance is poor. It
is done as per the performance of each department or activity. For example, if variance of
⊘ This is a preview!⊘
Do you want full access?
Subscribe today to unlock all pages.
Trusted by 1+ million students worldwide
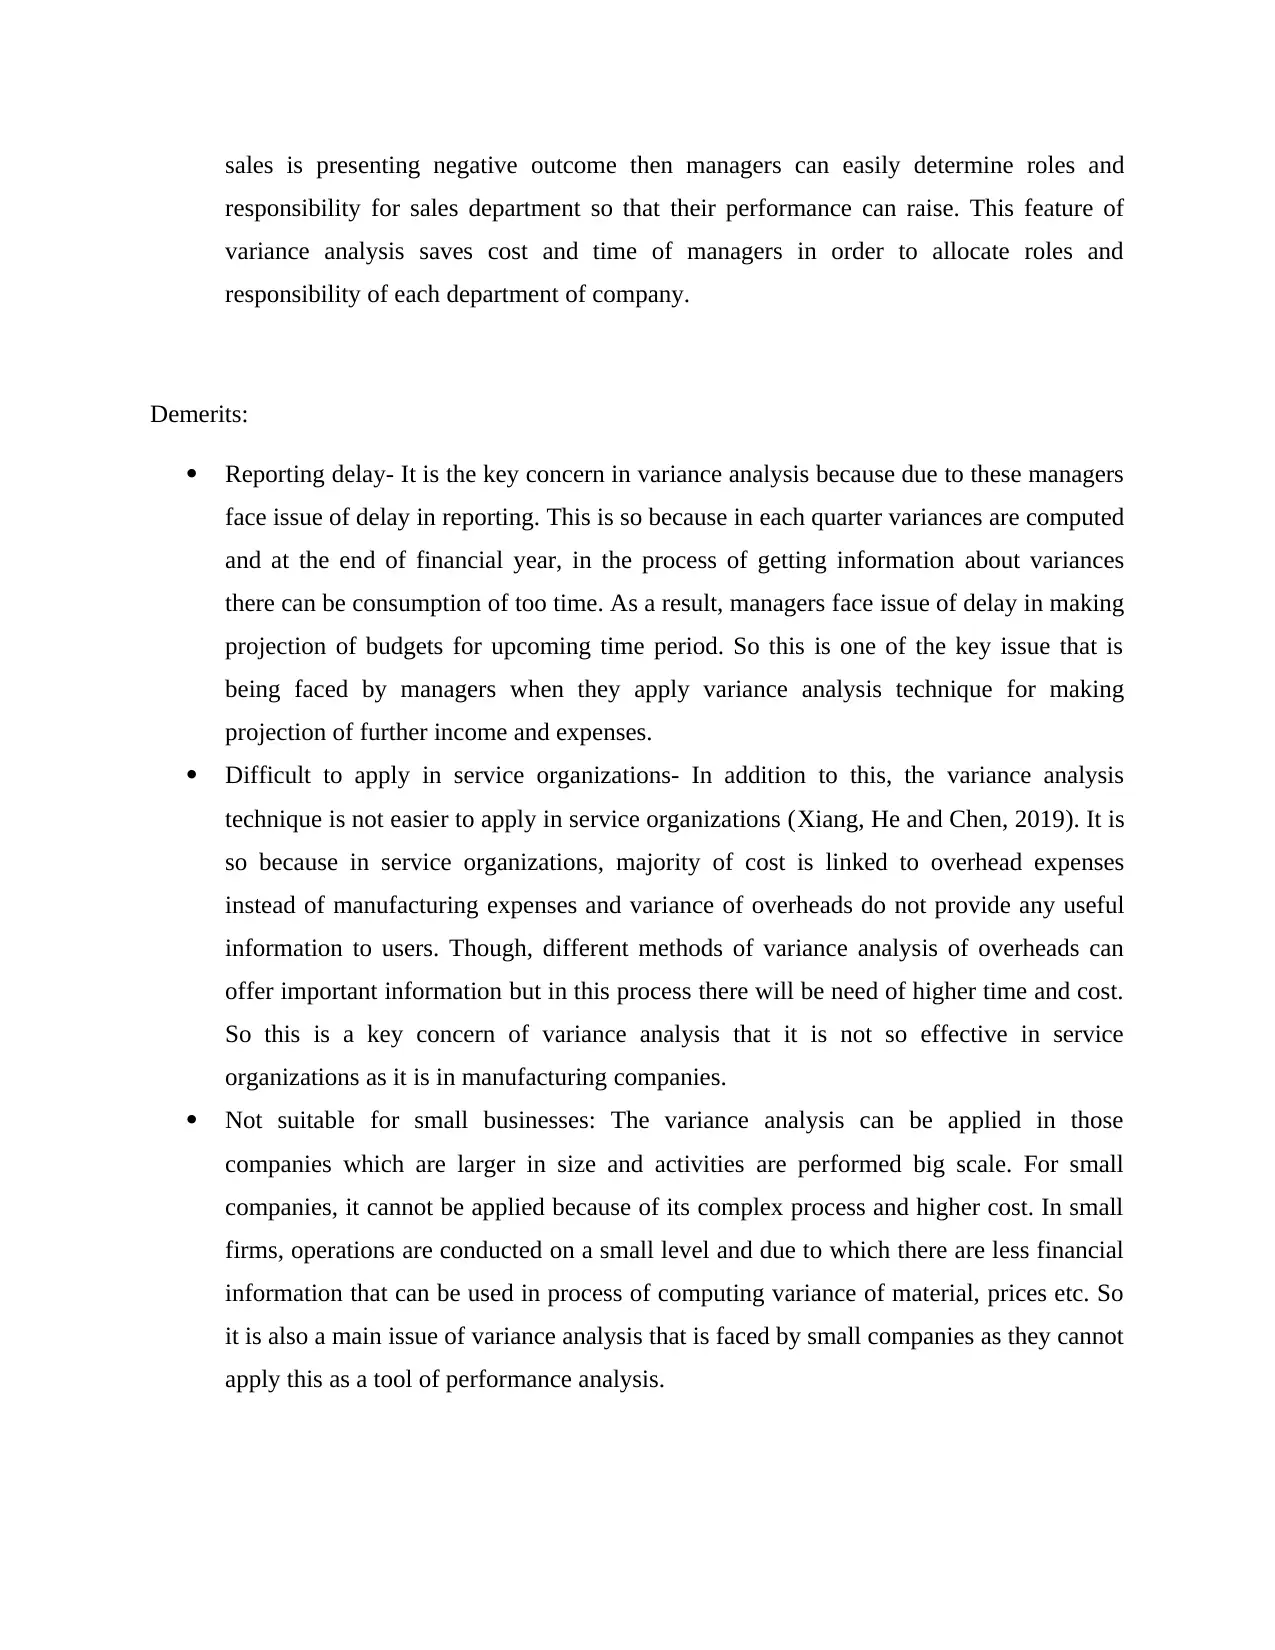
sales is presenting negative outcome then managers can easily determine roles and
responsibility for sales department so that their performance can raise. This feature of
variance analysis saves cost and time of managers in order to allocate roles and
responsibility of each department of company.
Demerits:
Reporting delay- It is the key concern in variance analysis because due to these managers
face issue of delay in reporting. This is so because in each quarter variances are computed
and at the end of financial year, in the process of getting information about variances
there can be consumption of too time. As a result, managers face issue of delay in making
projection of budgets for upcoming time period. So this is one of the key issue that is
being faced by managers when they apply variance analysis technique for making
projection of further income and expenses.
Difficult to apply in service organizations- In addition to this, the variance analysis
technique is not easier to apply in service organizations (Xiang, He and Chen, 2019). It is
so because in service organizations, majority of cost is linked to overhead expenses
instead of manufacturing expenses and variance of overheads do not provide any useful
information to users. Though, different methods of variance analysis of overheads can
offer important information but in this process there will be need of higher time and cost.
So this is a key concern of variance analysis that it is not so effective in service
organizations as it is in manufacturing companies.
Not suitable for small businesses: The variance analysis can be applied in those
companies which are larger in size and activities are performed big scale. For small
companies, it cannot be applied because of its complex process and higher cost. In small
firms, operations are conducted on a small level and due to which there are less financial
information that can be used in process of computing variance of material, prices etc. So
it is also a main issue of variance analysis that is faced by small companies as they cannot
apply this as a tool of performance analysis.
Paraphrase This Document
Need a fresh take? Get an instant paraphrase of this document with our AI Paraphraser
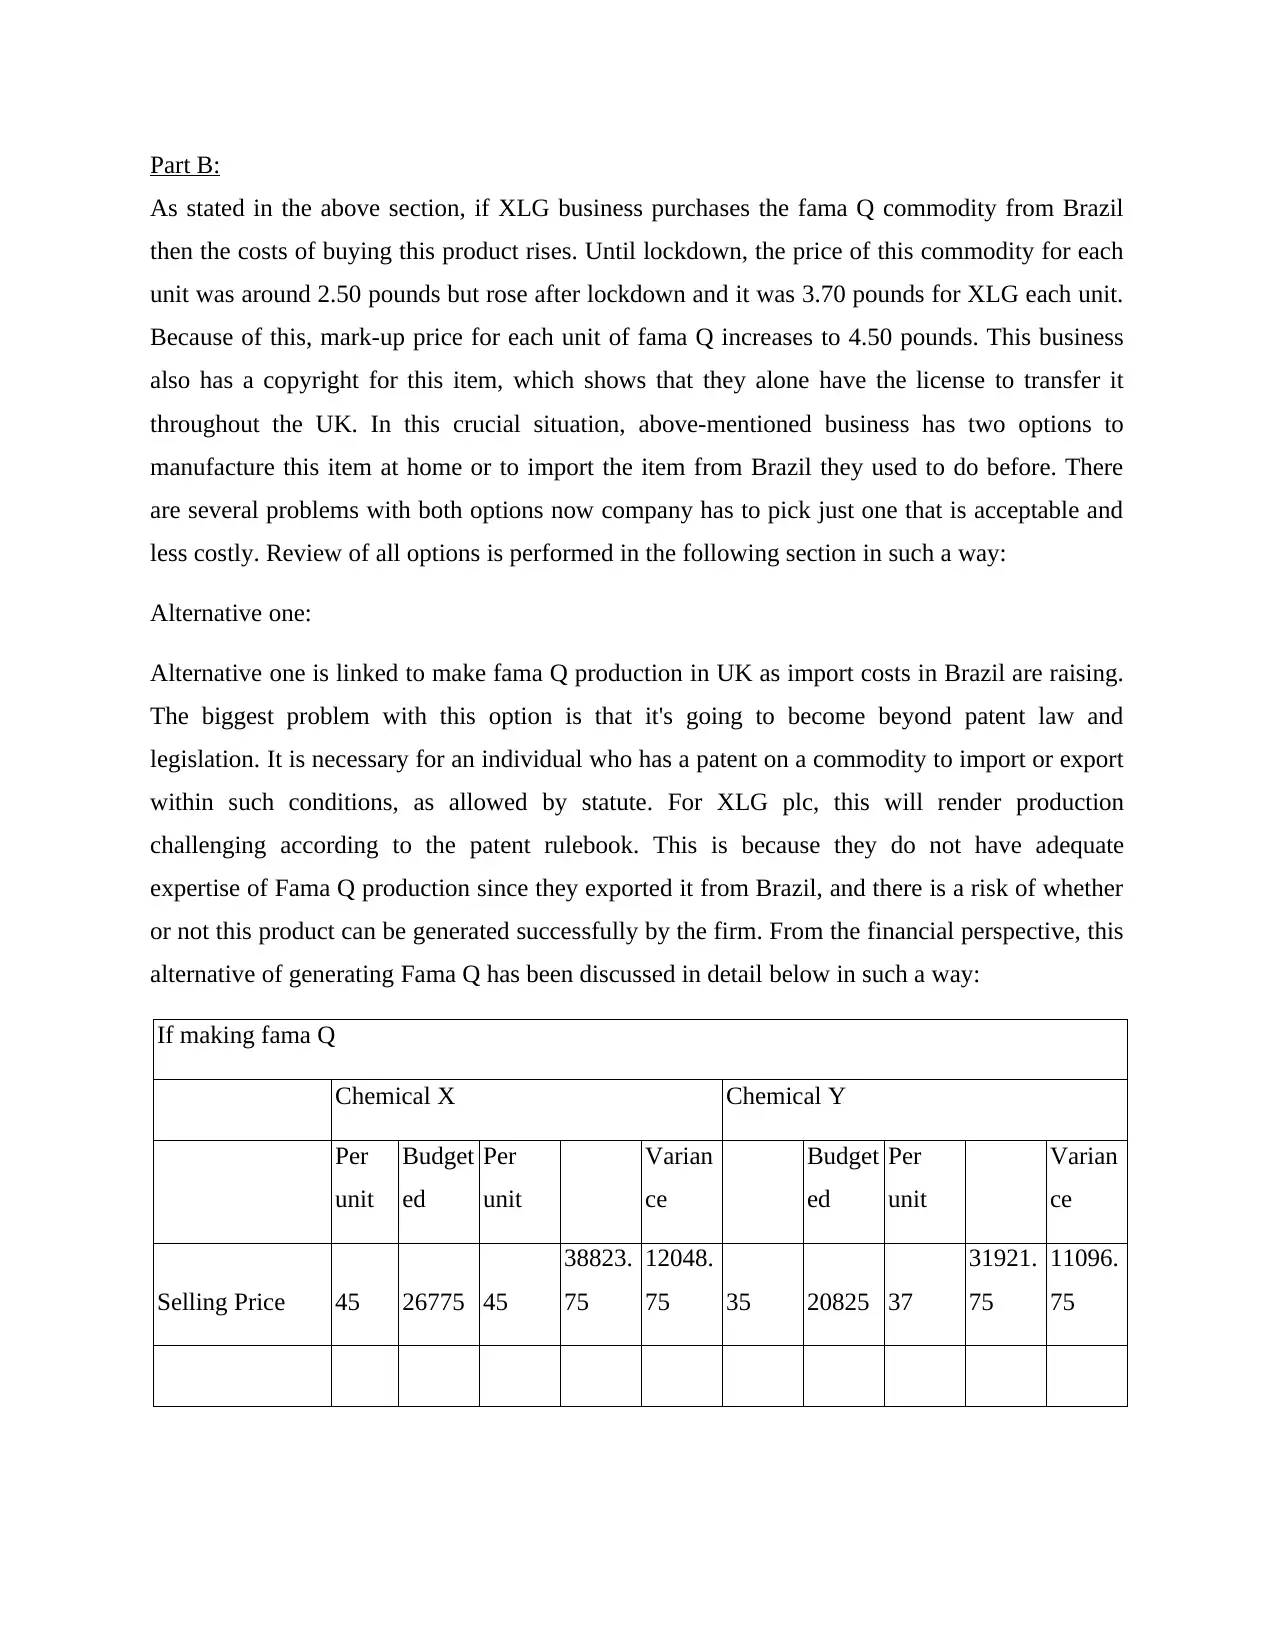
Part B:
As stated in the above section, if XLG business purchases the fama Q commodity from Brazil
then the costs of buying this product rises. Until lockdown, the price of this commodity for each
unit was around 2.50 pounds but rose after lockdown and it was 3.70 pounds for XLG each unit.
Because of this, mark-up price for each unit of fama Q increases to 4.50 pounds. This business
also has a copyright for this item, which shows that they alone have the license to transfer it
throughout the UK. In this crucial situation, above-mentioned business has two options to
manufacture this item at home or to import the item from Brazil they used to do before. There
are several problems with both options now company has to pick just one that is acceptable and
less costly. Review of all options is performed in the following section in such a way:
Alternative one:
Alternative one is linked to make fama Q production in UK as import costs in Brazil are raising.
The biggest problem with this option is that it's going to become beyond patent law and
legislation. It is necessary for an individual who has a patent on a commodity to import or export
within such conditions, as allowed by statute. For XLG plc, this will render production
challenging according to the patent rulebook. This is because they do not have adequate
expertise of Fama Q production since they exported it from Brazil, and there is a risk of whether
or not this product can be generated successfully by the firm. From the financial perspective, this
alternative of generating Fama Q has been discussed in detail below in such a way:
If making fama Q
Chemical X Chemical Y
Per
unit
Budget
ed
Per
unit
Varian
ce
Budget
ed
Per
unit
Varian
ce
Selling Price 45 26775 45
38823.
75
12048.
75 35 20825 37
31921.
75
11096.
75
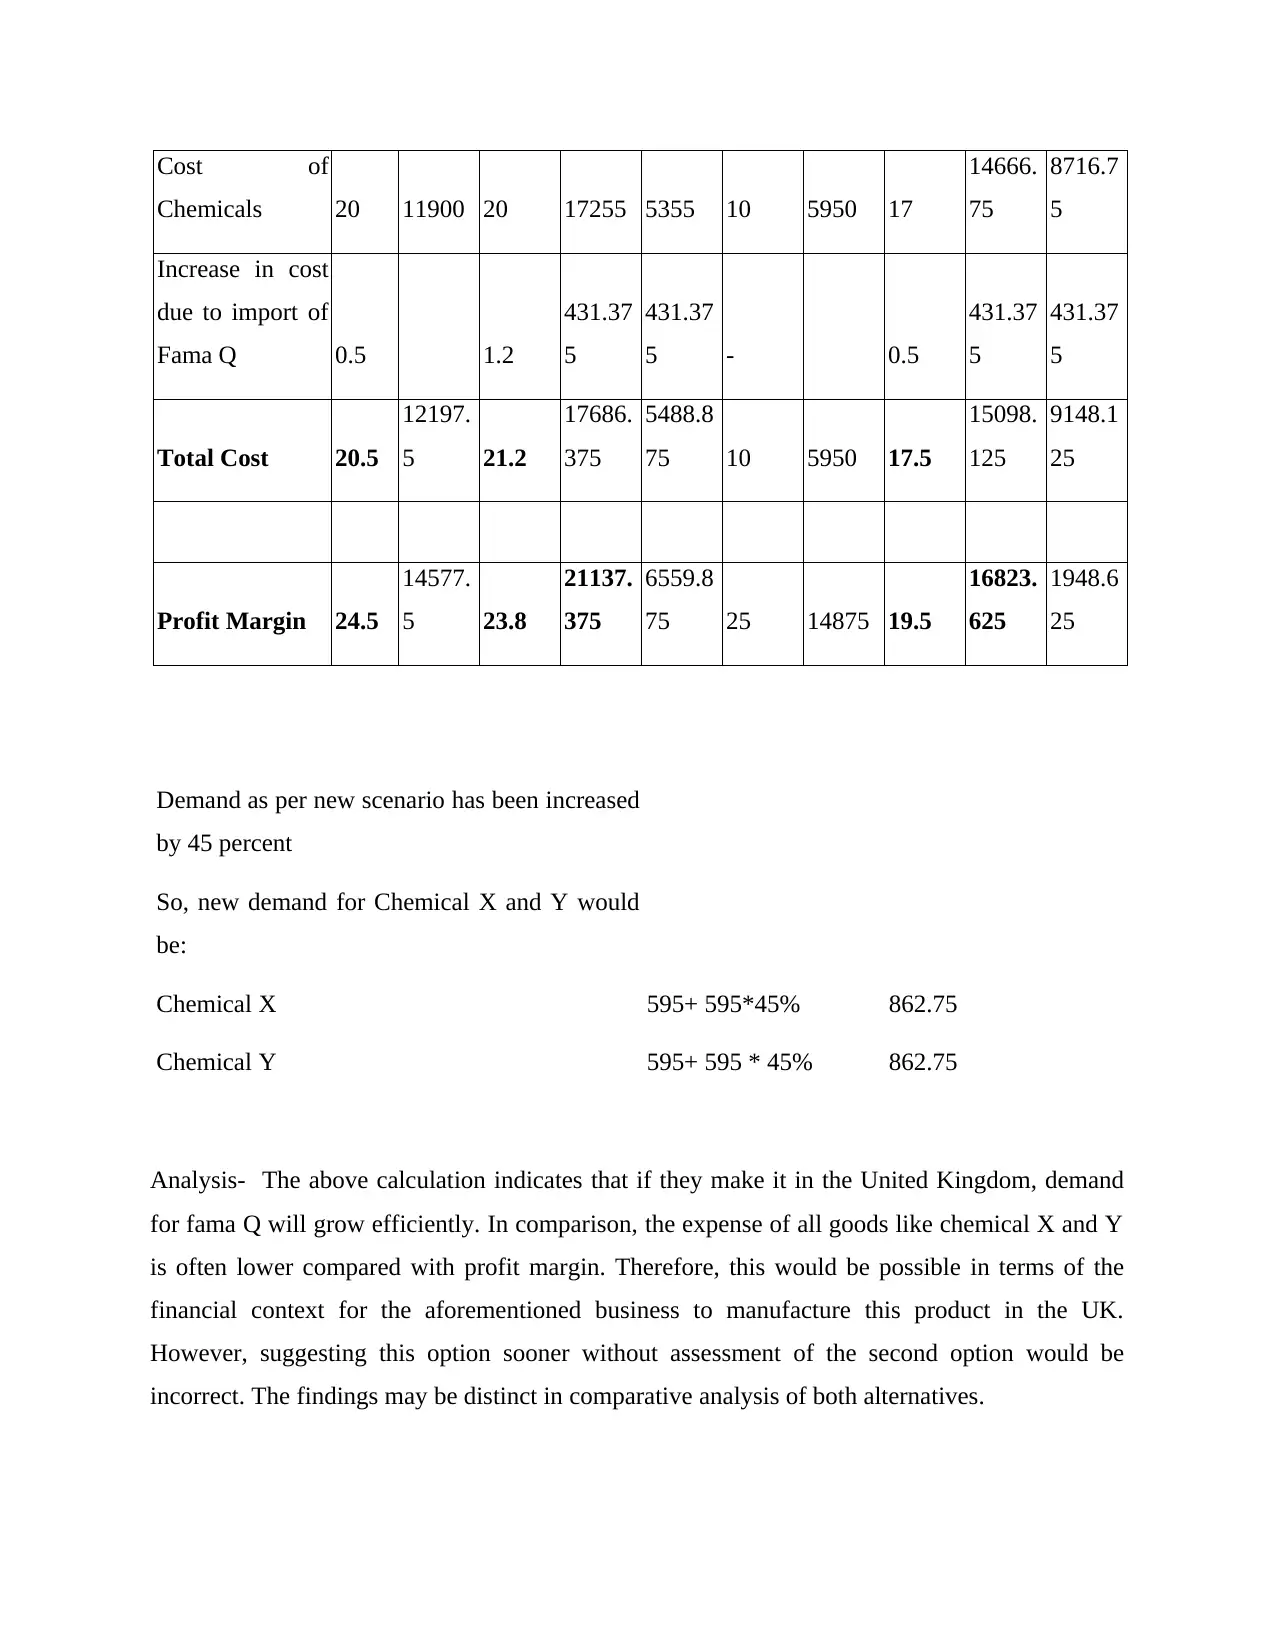
Cost of
Chemicals 20 11900 20 17255 5355 10 5950 17
14666.
75
8716.7
5
Increase in cost
due to import of
Fama Q 0.5 1.2
431.37
5
431.37
5 - 0.5
431.37
5
431.37
5
Total Cost 20.5
12197.
5 21.2
17686.
375
5488.8
75 10 5950 17.5
15098.
125
9148.1
25
Profit Margin 24.5
14577.
5 23.8
21137.
375
6559.8
75 25 14875 19.5
16823.
625
1948.6
25
Demand as per new scenario has been increased
by 45 percent
So, new demand for Chemical X and Y would
be:
Chemical X 595+ 595*45% 862.75
Chemical Y 595+ 595 * 45% 862.75
Analysis- The above calculation indicates that if they make it in the United Kingdom, demand
for fama Q will grow efficiently. In comparison, the expense of all goods like chemical X and Y
is often lower compared with profit margin. Therefore, this would be possible in terms of the
financial context for the aforementioned business to manufacture this product in the UK.
However, suggesting this option sooner without assessment of the second option would be
incorrect. The findings may be distinct in comparative analysis of both alternatives.
⊘ This is a preview!⊘
Do you want full access?
Subscribe today to unlock all pages.
Trusted by 1+ million students worldwide
1 out of 15
Related Documents


Your All-in-One AI-Powered Toolkit for Academic Success.
+13062052269
info@desklib.com
Available 24*7 on WhatsApp / Email
![[object Object]](/_next/static/media/star-bottom.7253800d.svg)
Unlock your academic potential
Copyright © 2020–2025 A2Z Services. All Rights Reserved. Developed and managed by ZUCOL.