Relationship between Low Density Lipoprotein and Biomarkers
Added on 2023-06-11
10 Pages1903 Words350 Views
Body and exam measurement data
TABLE OF CONTENTS
INTRODUCION..............................................................................................................................2
i. Summary statistics....................................................................................................................2
ii. correlation between all continuous variables..........................................................................3
iii. subjects in those AGE brackets have the same mean LDL....................................................5
iv. Test whether DIASTOLIC blood pressure and PULSE rate varied by GENDER.................6
v. Regression................................................................................................................................6
CONCLUSION................................................................................................................................8
REFERENCES................................................................................................................................9
Title: To determine the relationship between low density Lipoprotein and some
biomarkers.
INTRODUCION
In the recent times, individual faces issue due to their cholesterol, high BP and this in turn
affect their performance. That is why, the present study will help to develop a deep
understanding pertaining to the biomarkers that create a direct impact over the health. For that
different test has been applied which in turn assist to create a better outcome and reflect about
the relationship between the variables.
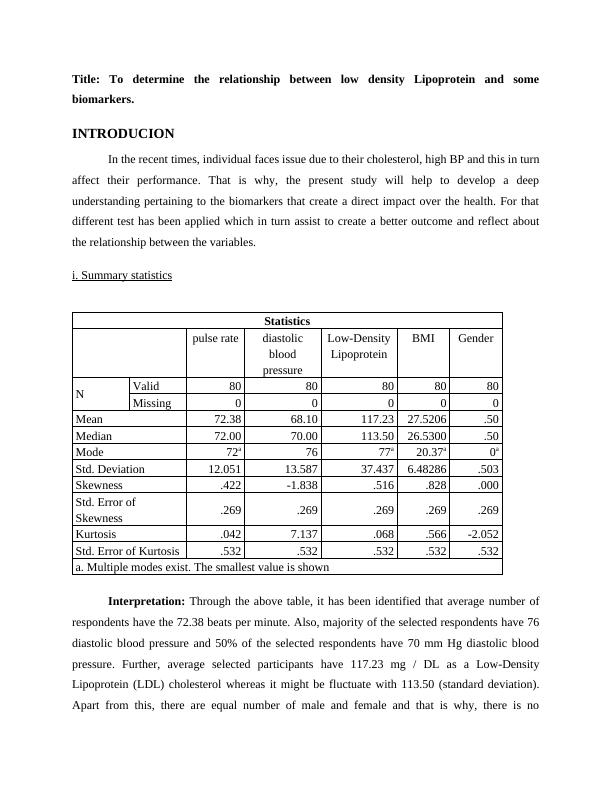
i. Summary statistics
Statistics
pulse rate diastolic
blood
pressure
Low-Density
Lipoprotein
BMI Gender
N Valid 80 80 80 80 80
Missing 0 0 0 0 0
Mean 72.38 68.10 117.23 27.5206 .50
Median 72.00 70.00 113.50 26.5300 .50
Mode 72a 76 77a 20.37a 0a
Std. Deviation 12.051 13.587 37.437 6.48286 .503
Skewness .422 -1.838 .516 .828 .000
Std. Error of
Skewness .269 .269 .269 .269 .269
Kurtosis .042 7.137 .068 .566 -2.052
Std. Error of Kurtosis .532 .532 .532 .532 .532
a. Multiple modes exist. The smallest value is shown
Interpretation: Through the above table, it has been identified that average number of
respondents have the 72.38 beats per minute. Also, majority of the selected respondents have 76
diastolic blood pressure and 50% of the selected respondents have 70 mm Hg diastolic blood
pressure. Further, average selected participants have 117.23 mg / DL as a Low-Density
Lipoprotein (LDL) cholesterol whereas it might be fluctuate with 113.50 (standard deviation).
Apart from this, there are equal number of male and female and that is why, there is no
biomarkers.
INTRODUCION
In the recent times, individual faces issue due to their cholesterol, high BP and this in turn
affect their performance. That is why, the present study will help to develop a deep
understanding pertaining to the biomarkers that create a direct impact over the health. For that
different test has been applied which in turn assist to create a better outcome and reflect about
the relationship between the variables.
i. Summary statistics
Statistics
pulse rate diastolic
blood
pressure
Low-Density
Lipoprotein
BMI Gender
N Valid 80 80 80 80 80
Missing 0 0 0 0 0
Mean 72.38 68.10 117.23 27.5206 .50
Median 72.00 70.00 113.50 26.5300 .50
Mode 72a 76 77a 20.37a 0a
Std. Deviation 12.051 13.587 37.437 6.48286 .503
Skewness .422 -1.838 .516 .828 .000
Std. Error of
Skewness .269 .269 .269 .269 .269
Kurtosis .042 7.137 .068 .566 -2.052
Std. Error of Kurtosis .532 .532 .532 .532 .532
a. Multiple modes exist. The smallest value is shown
Interpretation: Through the above table, it has been identified that average number of
respondents have the 72.38 beats per minute. Also, majority of the selected respondents have 76
diastolic blood pressure and 50% of the selected respondents have 70 mm Hg diastolic blood
pressure. Further, average selected participants have 117.23 mg / DL as a Low-Density
Lipoprotein (LDL) cholesterol whereas it might be fluctuate with 113.50 (standard deviation).
Apart from this, there are equal number of male and female and that is why, there is no
End of preview
Want to access all the pages? Upload your documents or become a member.