Lean Six Sigma Analysis: Riverside Mint Sweets Factory
VerifiedAdded on 2023/04/24
|21
|4136
|272
AI Summary
This article provides a Lean Six Sigma analysis of Riverside Mint Sweets Factory, including identifying sources of defects, analyzing possible solutions to production errors, and investigating possible changes to the production process for better value addition.
Contribute Materials
Your contribution can guide someone’s learning journey. Share your
documents today.
Lean Six Sigma Analysis: Riverside Mint Sweets Factory 1
Lean Six Sigma Analysis: Riverside Mint Sweets Factory
Your Name
Date
Lean Six Sigma Analysis: Riverside Mint Sweets Factory
Your Name
Date
Secure Best Marks with AI Grader
Need help grading? Try our AI Grader for instant feedback on your assignments.
Lean Six Sigma Analysis: Riverside Mint Sweets Factory 2
Introduction
Lean six sigma analysis tends to analyze the supply chain as well as the processes that the
company undertakes to achieve production and profits. The objective of the analysis is to
identify the potential phases where the company is incurring the greatest losses. A second key
aspect that lean six sigma seeks to identify in a process is the source of defects on the final
project (Albliwi et al., 2015, pp. 667). Defects reduce the overall market and competitive
viability of a given product. Based on the viability analysis, the six levels of six sigma are
designed to differentiate between a competitive company and a non-competitive company.
Therefore, the context of the lean six sigma analysis carries high significance to a company
(Arnheiterand Maleyeff, 2005, pp. 6).
Business Case
Riverside Mint Sweets Factory specializes in the production of bagged confectionaries.
The main selling point of the sweets is the nostalgic concept they bring to the consumers. The
demand that the company is handling is at one thousand boxes of the confectionaries per day.
However, the company is undertaking huge losses totaling to ten thousand euros a year. The
losses come from the issues in production stemming from the composition, design and packaging
of the sweets prior to reaching the final consumer. The numerous sources of waste as defects in
the manufacturing process means that the company is not able to maintain a healthy competition
in the industry. In addition, the company has lost two of its most important consumers because of
the continued defects in production. Business-wise, the company is failing at an alarming rate
especially because it is starting to accrue a negative reputation in the industry. A poor reputation
would be a difficult aspect to handle considering that the company is already losing substantial
market share.
Lean Six Sigma Analysis: Riverside Mint Sweets Factory 3
The main defined problems that Riverside is experiencing are; the inability to meet its
production schedules, a high rework rates and the machine downtime. These are manifestations
of the errors in the production process as well as the product defects (Khan et al., 2011). For
example, one of the company’s chief consumers returned an entire consignment because a few of
the sampled sweets were defective. Returned consignments require rework or scrapping which
cause the company to lose more time and incur extra costs on the production process. Machine
down times are caused mainly why the packaging process results in breakage of the sweets and
the debris ends up in the machine gears and crevices. The result is that the company will need to
slow down production in order to clean out the machines.
Problem Statement
Riverside Mint Sweet Factory is incurring high losses through its production process that
is leading to errors in production. The errors in production lead to defects of the packaged sweets
which is affecting consumer confidence in the company. The company is also losing £10,000
every year based on the propagated errors and loss of consumers. Therefore, there is need to
address the problem that Riverside Mint Sweet Factory is facing for the sake of the company. It
is unwise to precede the continued decline of the company especially now that the company is
losing out on its market share.
Objective Statements
The objectives are;
To identify the sources of defects in the sweets.
To analyze possible solution to the production errors and leading to the defects.
To analyze possible solutions to the sources of losses that the company is
undertaking.
Lean Six Sigma Analysis: Riverside Mint Sweets Factory 4
To investigate possible changes to the production process for better value
addition.
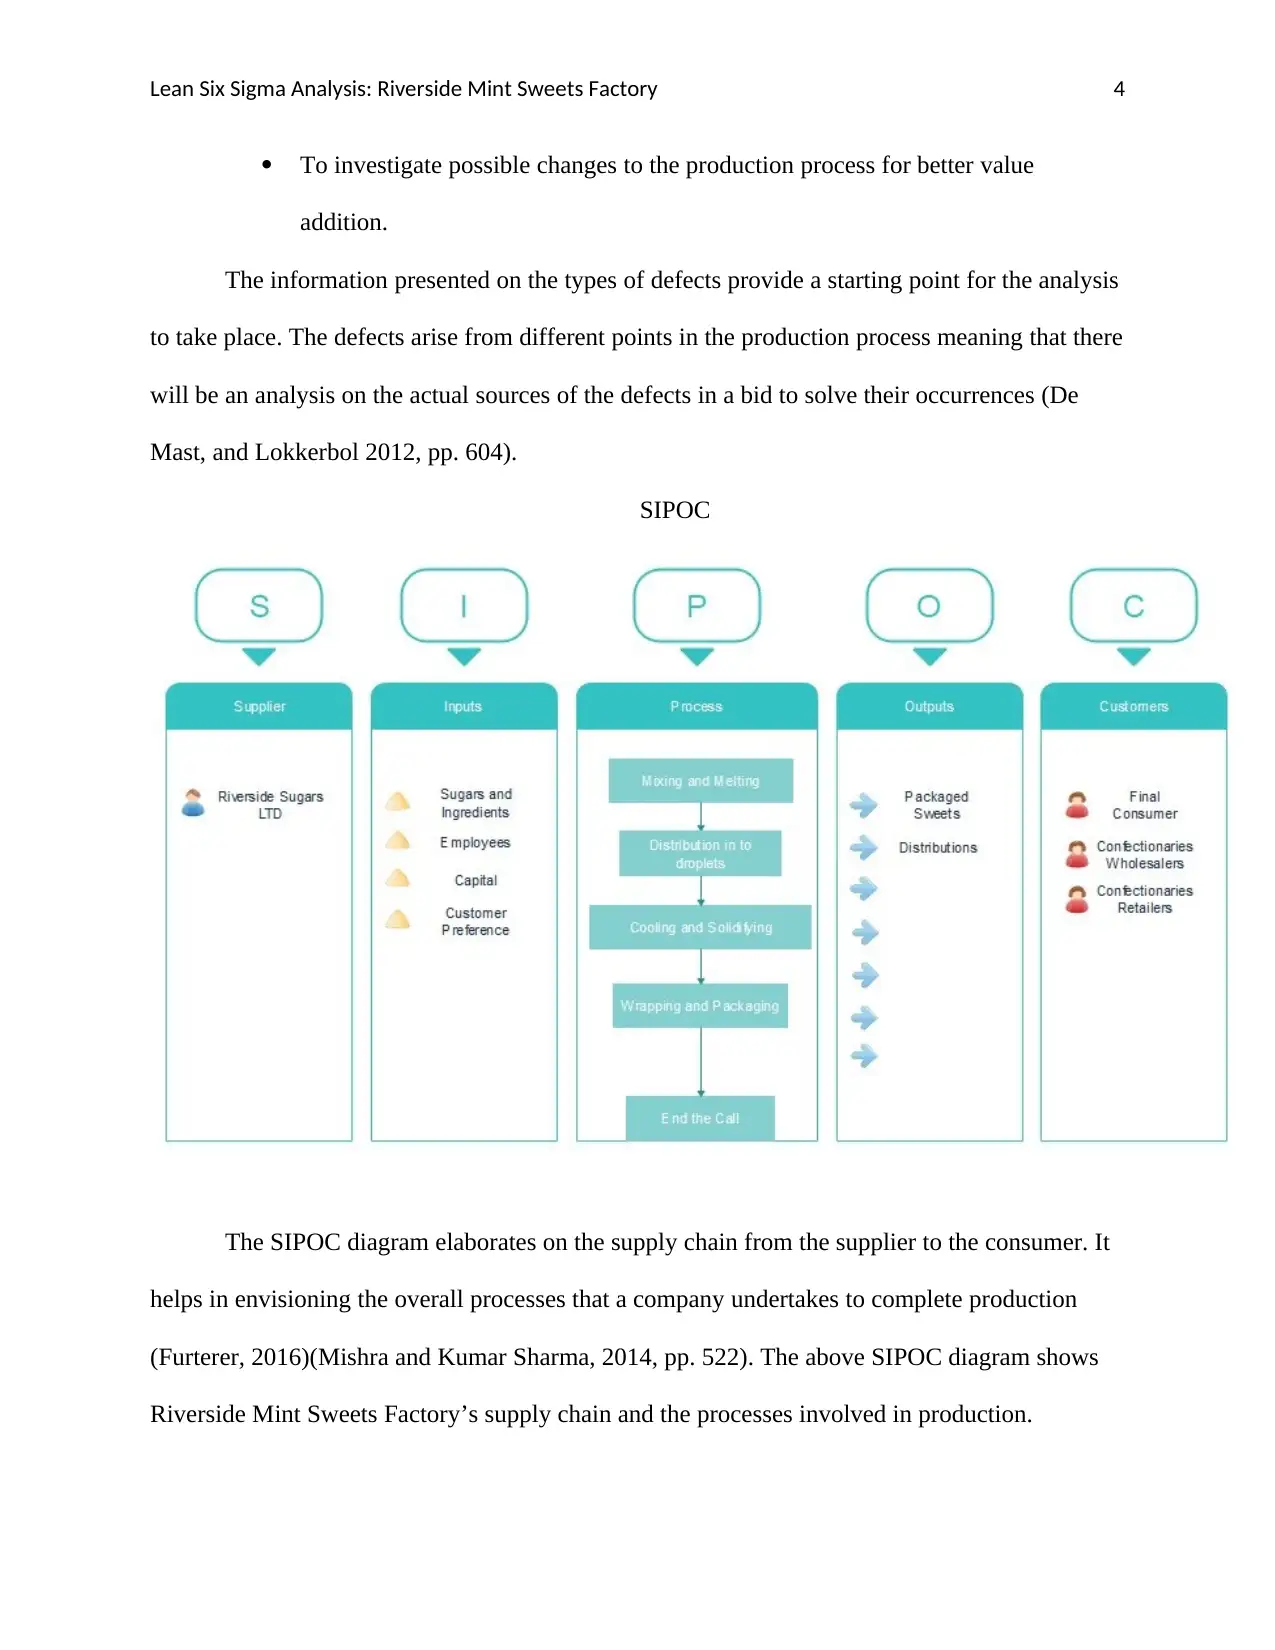
The information presented on the types of defects provide a starting point for the analysis
to take place. The defects arise from different points in the production process meaning that there
will be an analysis on the actual sources of the defects in a bid to solve their occurrences (De
Mast, and Lokkerbol 2012, pp. 604).
SIPOC
The SIPOC diagram elaborates on the supply chain from the supplier to the consumer. It
helps in envisioning the overall processes that a company undertakes to complete production
(Furterer, 2016)(Mishra and Kumar Sharma, 2014, pp. 522). The above SIPOC diagram shows
Riverside Mint Sweets Factory’s supply chain and the processes involved in production.
To investigate possible changes to the production process for better value
addition.
The information presented on the types of defects provide a starting point for the analysis
to take place. The defects arise from different points in the production process meaning that there
will be an analysis on the actual sources of the defects in a bid to solve their occurrences (De
Mast, and Lokkerbol 2012, pp. 604).
SIPOC
The SIPOC diagram elaborates on the supply chain from the supplier to the consumer. It
helps in envisioning the overall processes that a company undertakes to complete production
(Furterer, 2016)(Mishra and Kumar Sharma, 2014, pp. 522). The above SIPOC diagram shows
Riverside Mint Sweets Factory’s supply chain and the processes involved in production.
Paraphrase This Document
Need a fresh take? Get an instant paraphrase of this document with our AI Paraphraser
Lean Six Sigma Analysis: Riverside Mint Sweets Factory 5
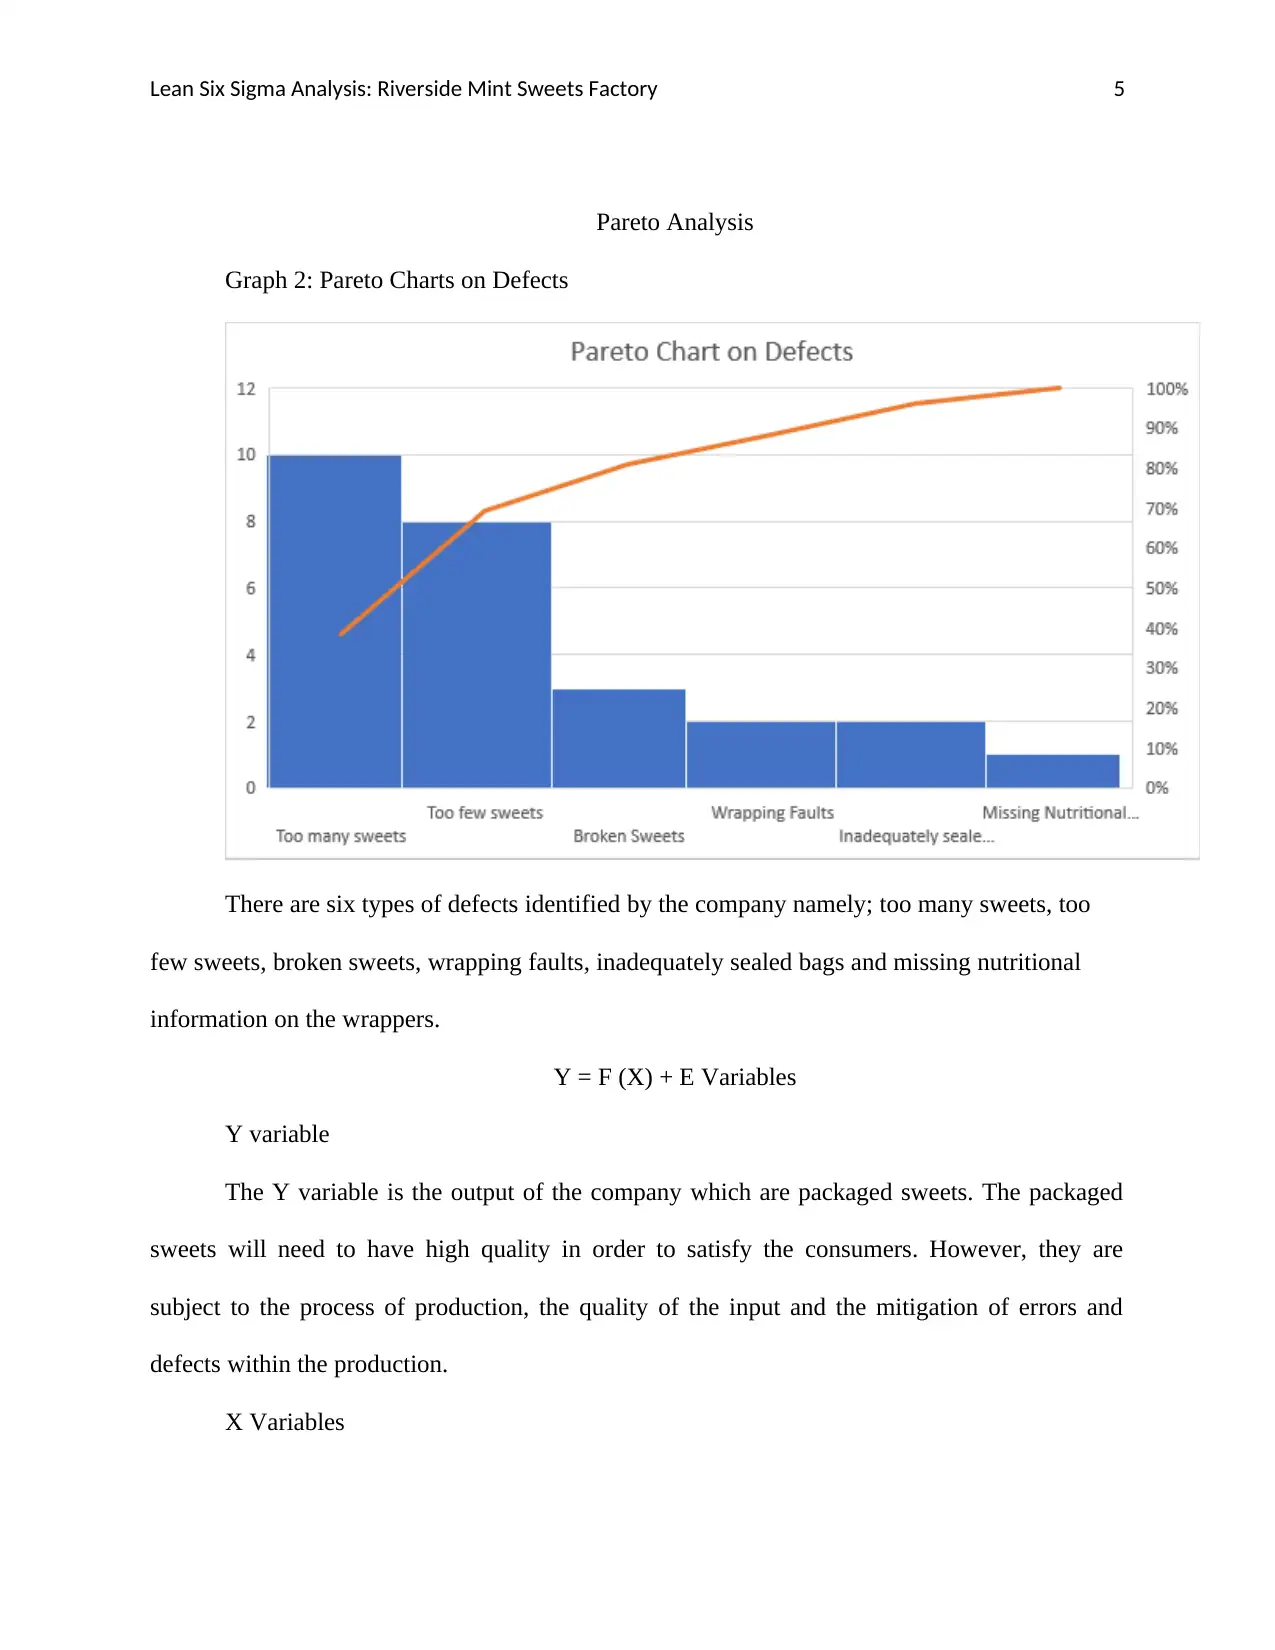
Pareto Analysis
Graph 2: Pareto Charts on Defects
There are six types of defects identified by the company namely; too many sweets, too
few sweets, broken sweets, wrapping faults, inadequately sealed bags and missing nutritional
information on the wrappers.
Y = F (X) + E Variables
Y variable
The Y variable is the output of the company which are packaged sweets. The packaged
sweets will need to have high quality in order to satisfy the consumers. However, they are
subject to the process of production, the quality of the input and the mitigation of errors and
defects within the production.
X Variables
Lean Six Sigma Analysis: Riverside Mint Sweets Factory 6
The X variables represent the input for the entire production to be possible. The input for
Riverside Mint Sweet Factory therefore is the sugar and ingredients. Secondly, there are
employees working at the company totaling to 200 whom also form an essential part of the input.
The third input in the system is the capital used to run the company so that all machines and
employees are working in unison.
F Process
F in the equation translates to the process of production through which the resources of
production are manipulated to produce the product (Evans, and Lindsay, 2014). In this case, the
process of production is the stirring of ingredients, then the melting process, distribution of
droplets of the mixture on the conveyor belt, cooling and solidifying of the mixture in to pellets
of sweets. The next process is usually the wrapping of the sweets in plastic film followed by
packaging in to packets and finally in to boxes ready for shipment.
E Variables
E variables refer to the errors in the process of factors influencing errors in the production
process. In Riverside’s process, the E variables are; machine downtime, defects, human error,
time wastage, reworking cost. Errors in prior processes are propagated in to the next process
hence, the final product will have defects thus reducing the company’s overall yield. The six-
sigma analysis attempts to address the errors and the reason for their occurrences. The aim of the
analysis is to have the company move to a better level of efficiency.
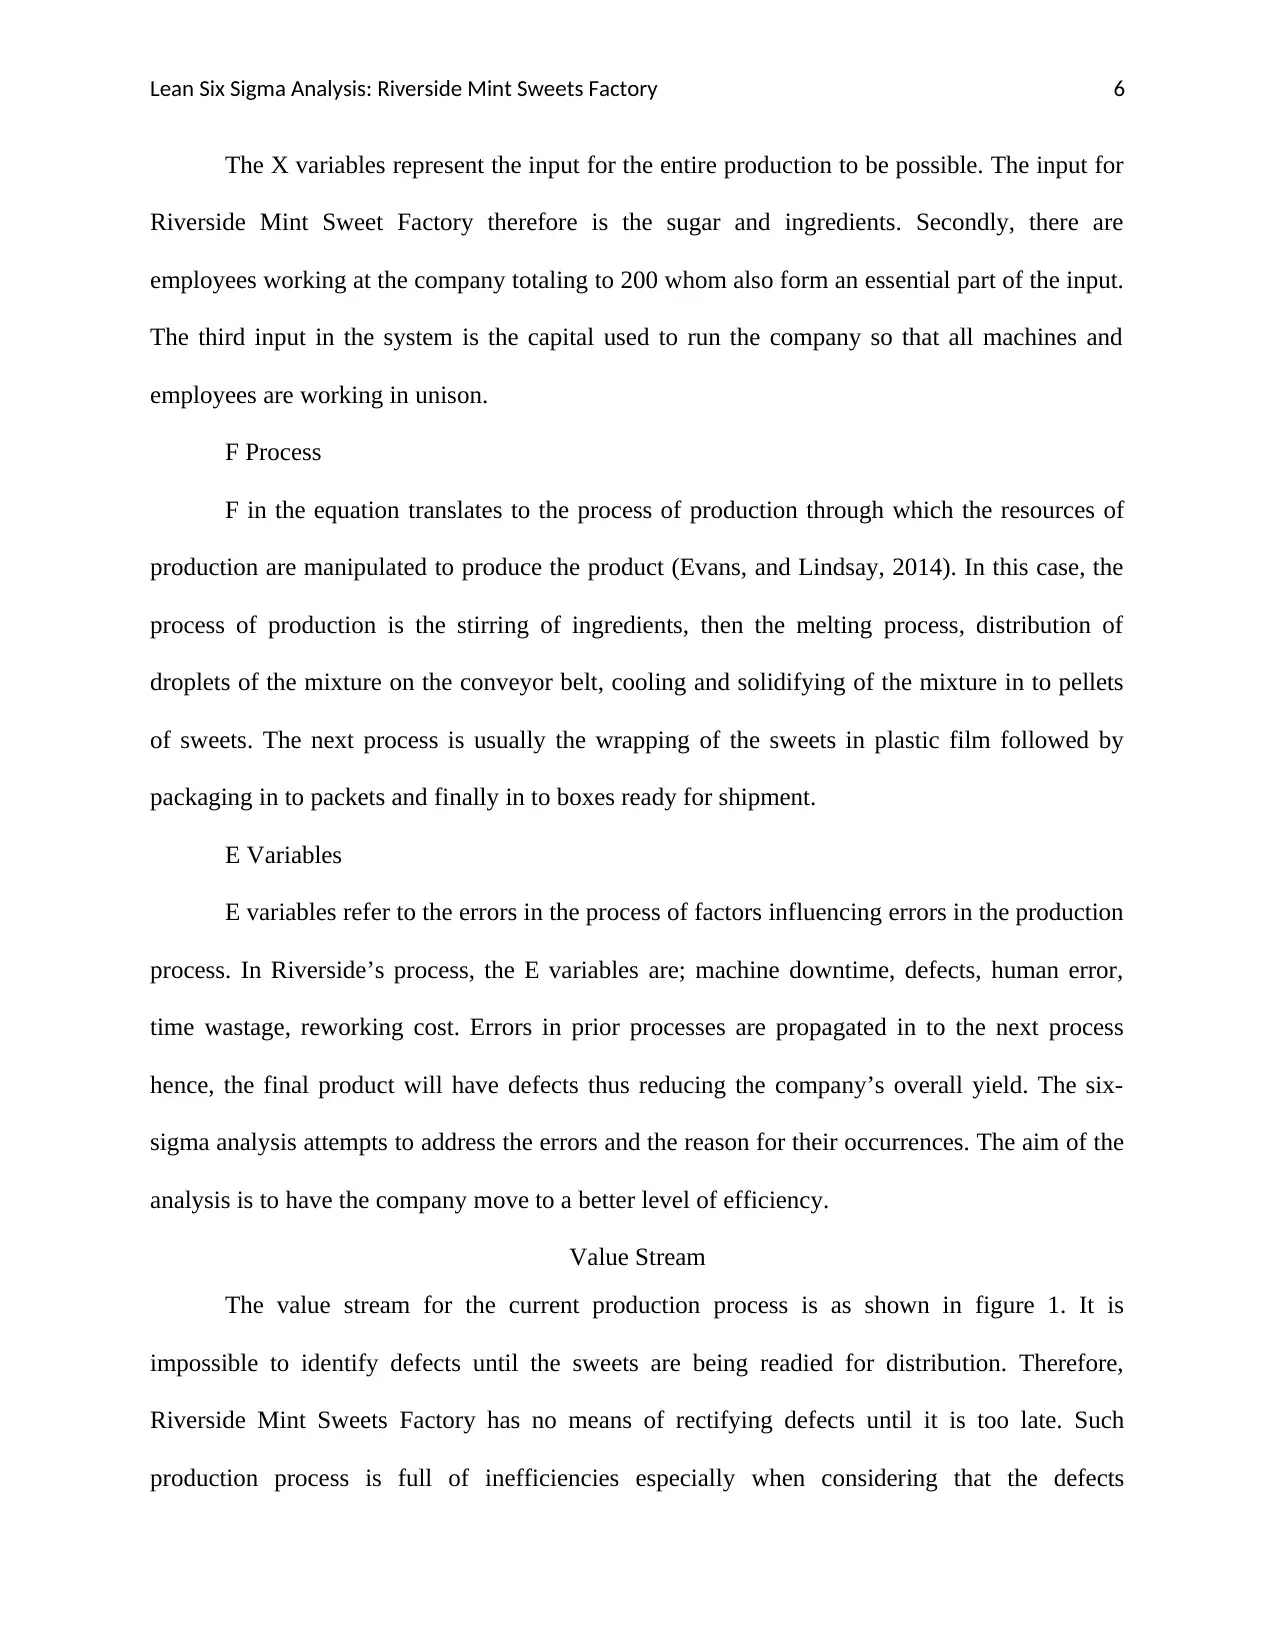
Value Stream
The value stream for the current production process is as shown in figure 1. It is
impossible to identify defects until the sweets are being readied for distribution. Therefore,
Riverside Mint Sweets Factory has no means of rectifying defects until it is too late. Such
production process is full of inefficiencies especially when considering that the defects
The X variables represent the input for the entire production to be possible. The input for
Riverside Mint Sweet Factory therefore is the sugar and ingredients. Secondly, there are
employees working at the company totaling to 200 whom also form an essential part of the input.
The third input in the system is the capital used to run the company so that all machines and
employees are working in unison.
F Process
F in the equation translates to the process of production through which the resources of
production are manipulated to produce the product (Evans, and Lindsay, 2014). In this case, the
process of production is the stirring of ingredients, then the melting process, distribution of
droplets of the mixture on the conveyor belt, cooling and solidifying of the mixture in to pellets
of sweets. The next process is usually the wrapping of the sweets in plastic film followed by
packaging in to packets and finally in to boxes ready for shipment.
E Variables
E variables refer to the errors in the process of factors influencing errors in the production
process. In Riverside’s process, the E variables are; machine downtime, defects, human error,
time wastage, reworking cost. Errors in prior processes are propagated in to the next process
hence, the final product will have defects thus reducing the company’s overall yield. The six-
sigma analysis attempts to address the errors and the reason for their occurrences. The aim of the
analysis is to have the company move to a better level of efficiency.
Value Stream
The value stream for the current production process is as shown in figure 1. It is
impossible to identify defects until the sweets are being readied for distribution. Therefore,
Riverside Mint Sweets Factory has no means of rectifying defects until it is too late. Such
production process is full of inefficiencies especially when considering that the defects
Lean Six Sigma Analysis: Riverside Mint Sweets Factory 7
consumers are more worried about are those that cannot be detected by simple human vision
(Munro et al., 2015).
Sample Analysis
Sample analysis differentiated the two production lines with the aim of identifying the
production line with the greatest flaws. It allows the company to identify the machine that is
having a poor productivity and producing the high number of defects in the overall system.
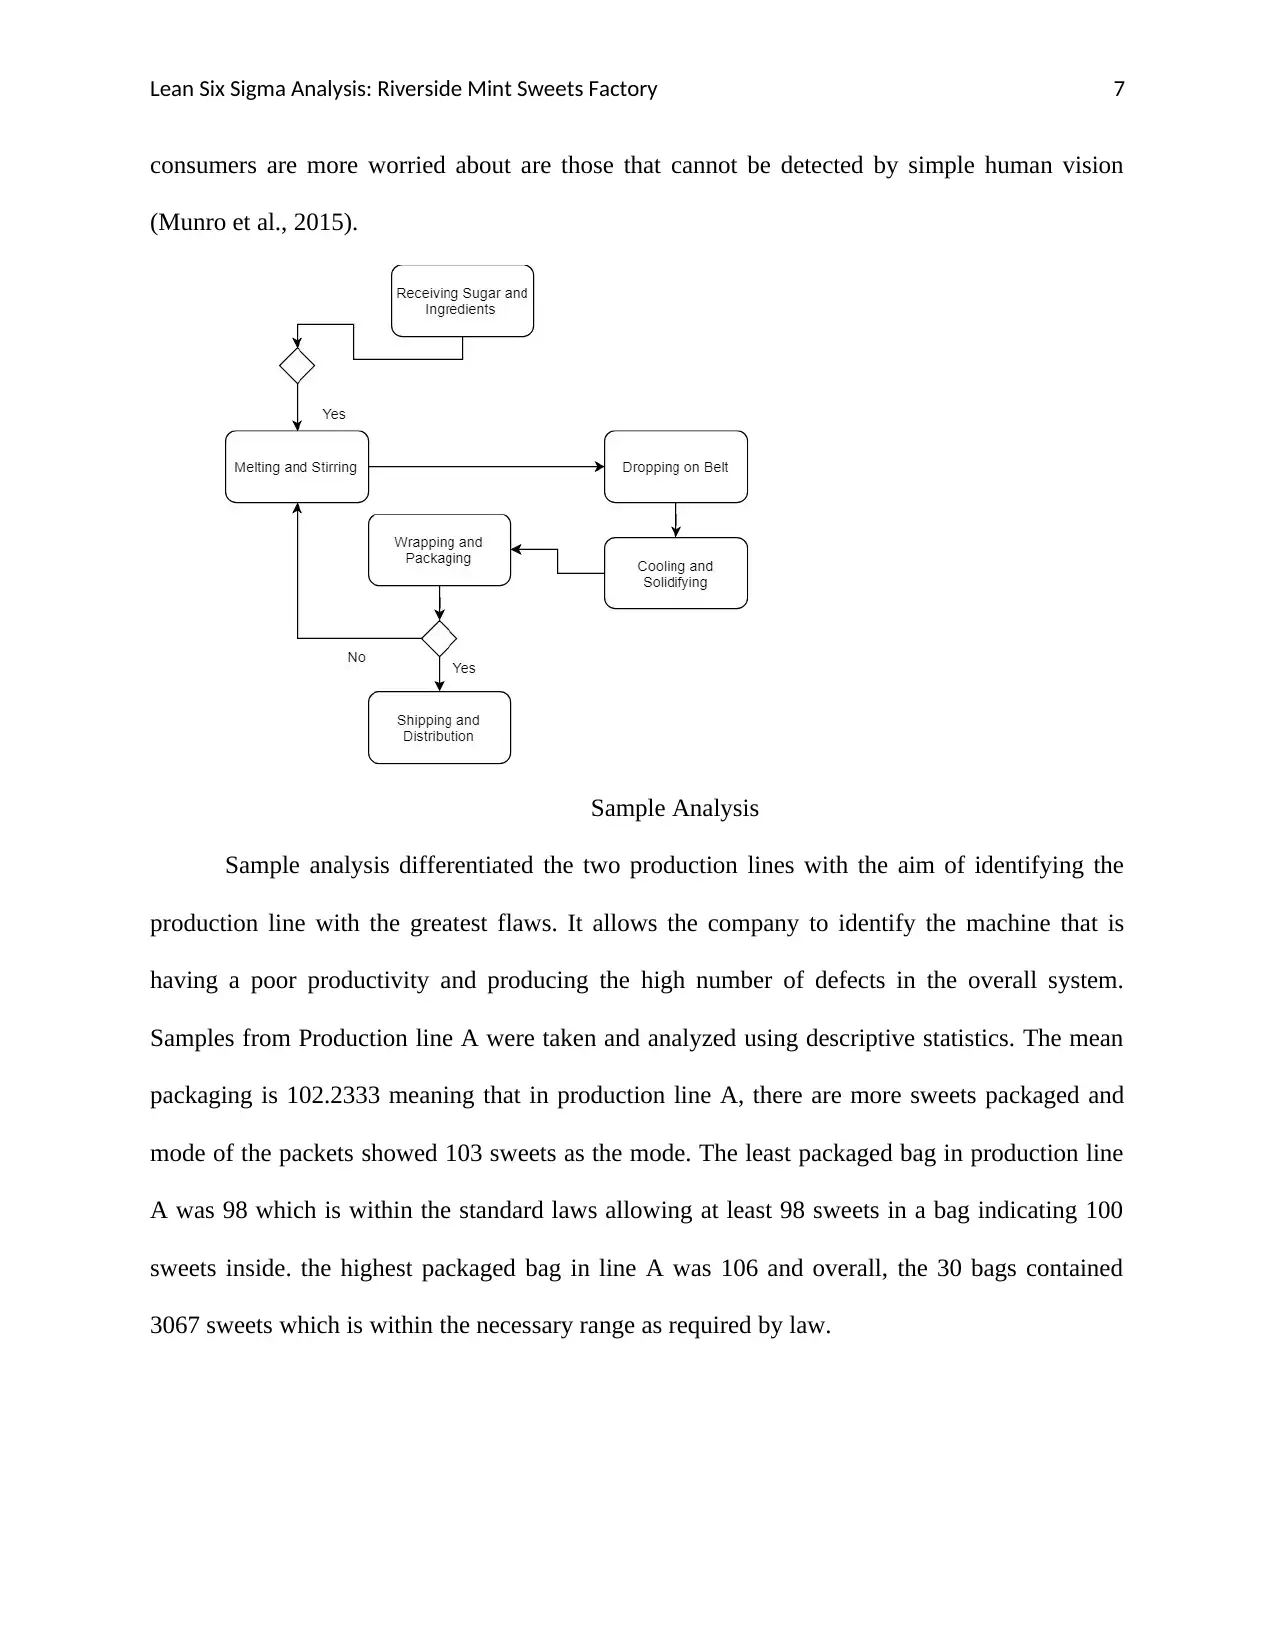
Samples from Production line A were taken and analyzed using descriptive statistics. The mean
packaging is 102.2333 meaning that in production line A, there are more sweets packaged and
mode of the packets showed 103 sweets as the mode. The least packaged bag in production line
A was 98 which is within the standard laws allowing at least 98 sweets in a bag indicating 100
sweets inside. the highest packaged bag in line A was 106 and overall, the 30 bags contained
3067 sweets which is within the necessary range as required by law.
consumers are more worried about are those that cannot be detected by simple human vision
(Munro et al., 2015).
Sample Analysis
Sample analysis differentiated the two production lines with the aim of identifying the
production line with the greatest flaws. It allows the company to identify the machine that is
having a poor productivity and producing the high number of defects in the overall system.
Samples from Production line A were taken and analyzed using descriptive statistics. The mean
packaging is 102.2333 meaning that in production line A, there are more sweets packaged and
mode of the packets showed 103 sweets as the mode. The least packaged bag in production line
A was 98 which is within the standard laws allowing at least 98 sweets in a bag indicating 100
sweets inside. the highest packaged bag in line A was 106 and overall, the 30 bags contained
3067 sweets which is within the necessary range as required by law.
Secure Best Marks with AI Grader
Need help grading? Try our AI Grader for instant feedback on your assignments.
Lean Six Sigma Analysis: Riverside Mint Sweets Factory 8
Table 1: Production Line A Analysis
Production Line A
Mean 102.2333
Standard Error 0.3735
Median 103
Mode 103
Standard Deviation 2.045741
Sample Variance 4.185057
Kurtosis -0.64902
Skewness -0.36394
Range 8
Minimum 98
Maximum 106
Sum 3067
Count 30
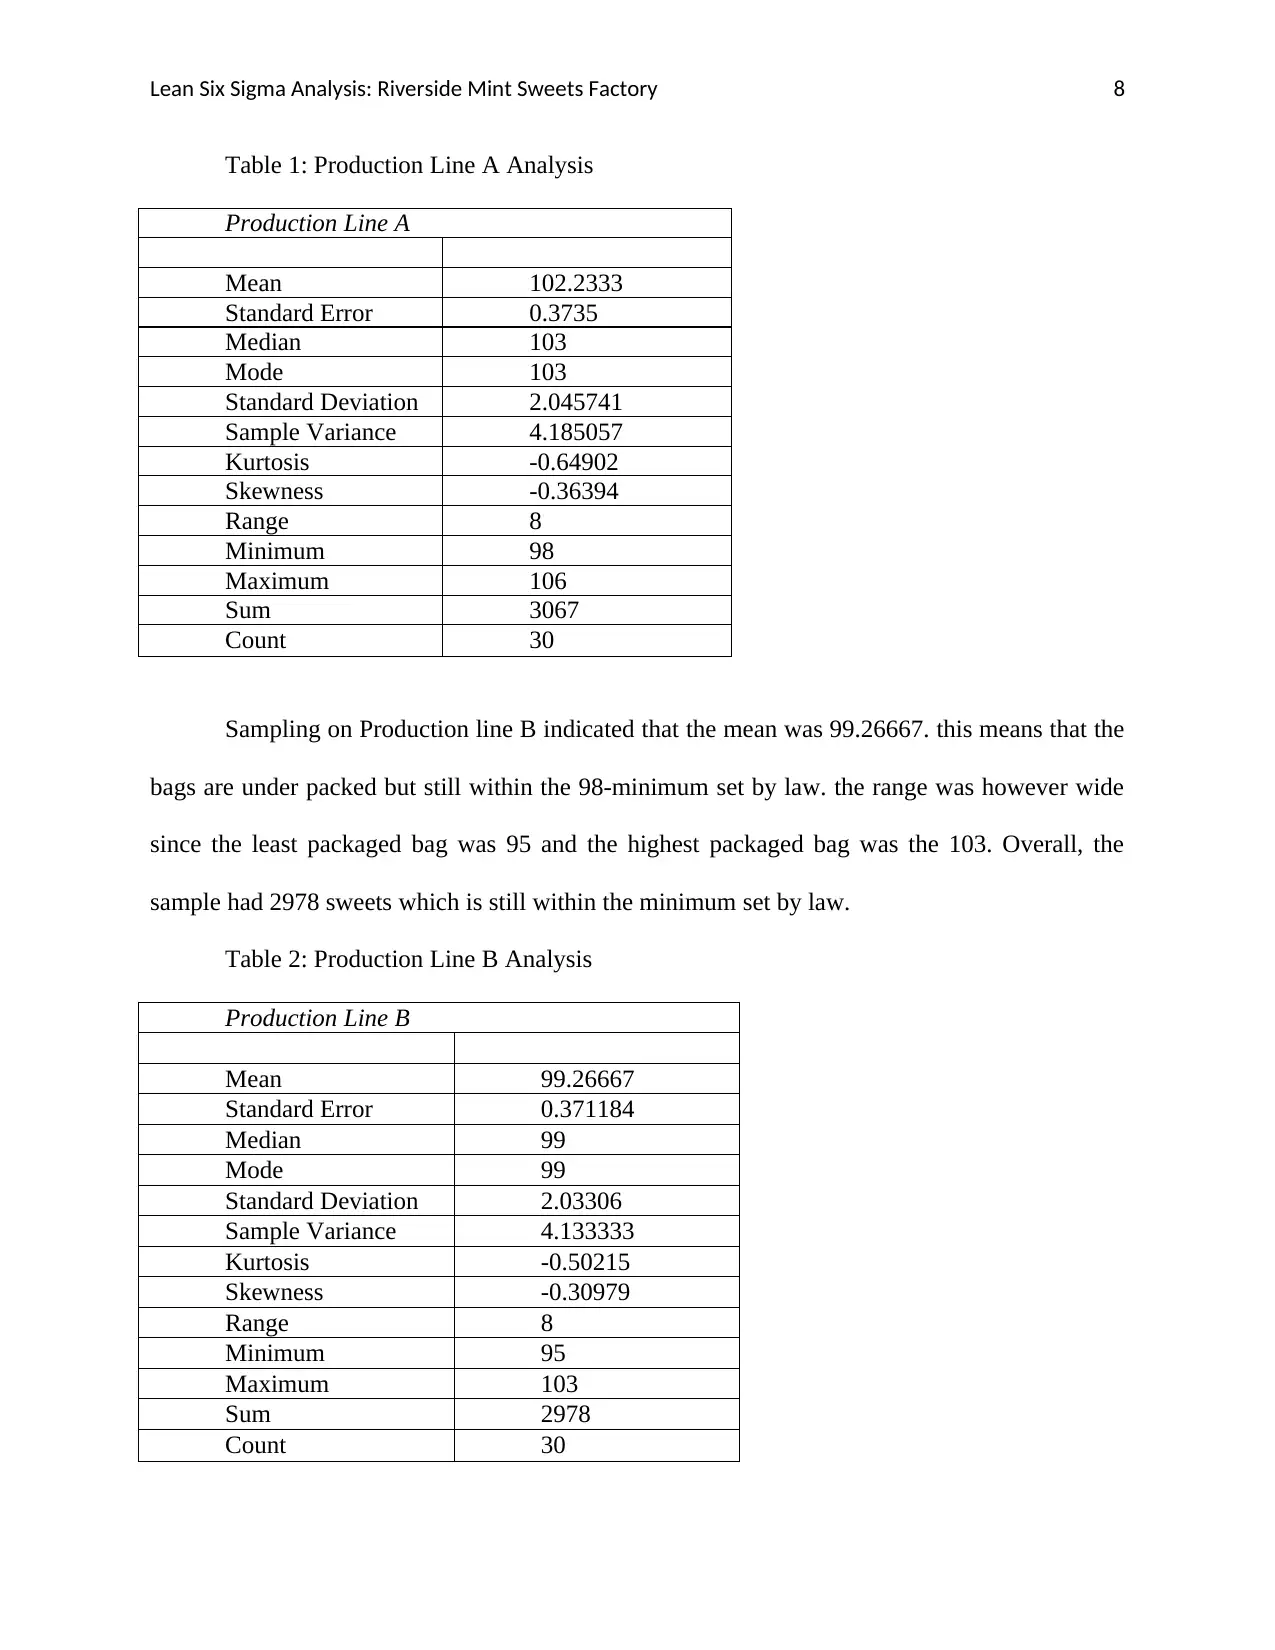
Sampling on Production line B indicated that the mean was 99.26667. this means that the
bags are under packed but still within the 98-minimum set by law. the range was however wide
since the least packaged bag was 95 and the highest packaged bag was the 103. Overall, the
sample had 2978 sweets which is still within the minimum set by law.
Table 2: Production Line B Analysis
Production Line B
Mean 99.26667
Standard Error 0.371184
Median 99
Mode 99
Standard Deviation 2.03306
Sample Variance 4.133333
Kurtosis -0.50215
Skewness -0.30979
Range 8
Minimum 95
Maximum 103
Sum 2978
Count 30
Table 1: Production Line A Analysis
Production Line A
Mean 102.2333
Standard Error 0.3735
Median 103
Mode 103
Standard Deviation 2.045741
Sample Variance 4.185057
Kurtosis -0.64902
Skewness -0.36394
Range 8
Minimum 98
Maximum 106
Sum 3067
Count 30
Sampling on Production line B indicated that the mean was 99.26667. this means that the
bags are under packed but still within the 98-minimum set by law. the range was however wide
since the least packaged bag was 95 and the highest packaged bag was the 103. Overall, the
sample had 2978 sweets which is still within the minimum set by law.
Table 2: Production Line B Analysis
Production Line B
Mean 99.26667
Standard Error 0.371184
Median 99
Mode 99
Standard Deviation 2.03306
Sample Variance 4.133333
Kurtosis -0.50215
Skewness -0.30979
Range 8
Minimum 95
Maximum 103
Sum 2978
Count 30
Lean Six Sigma Analysis: Riverside Mint Sweets Factory 9
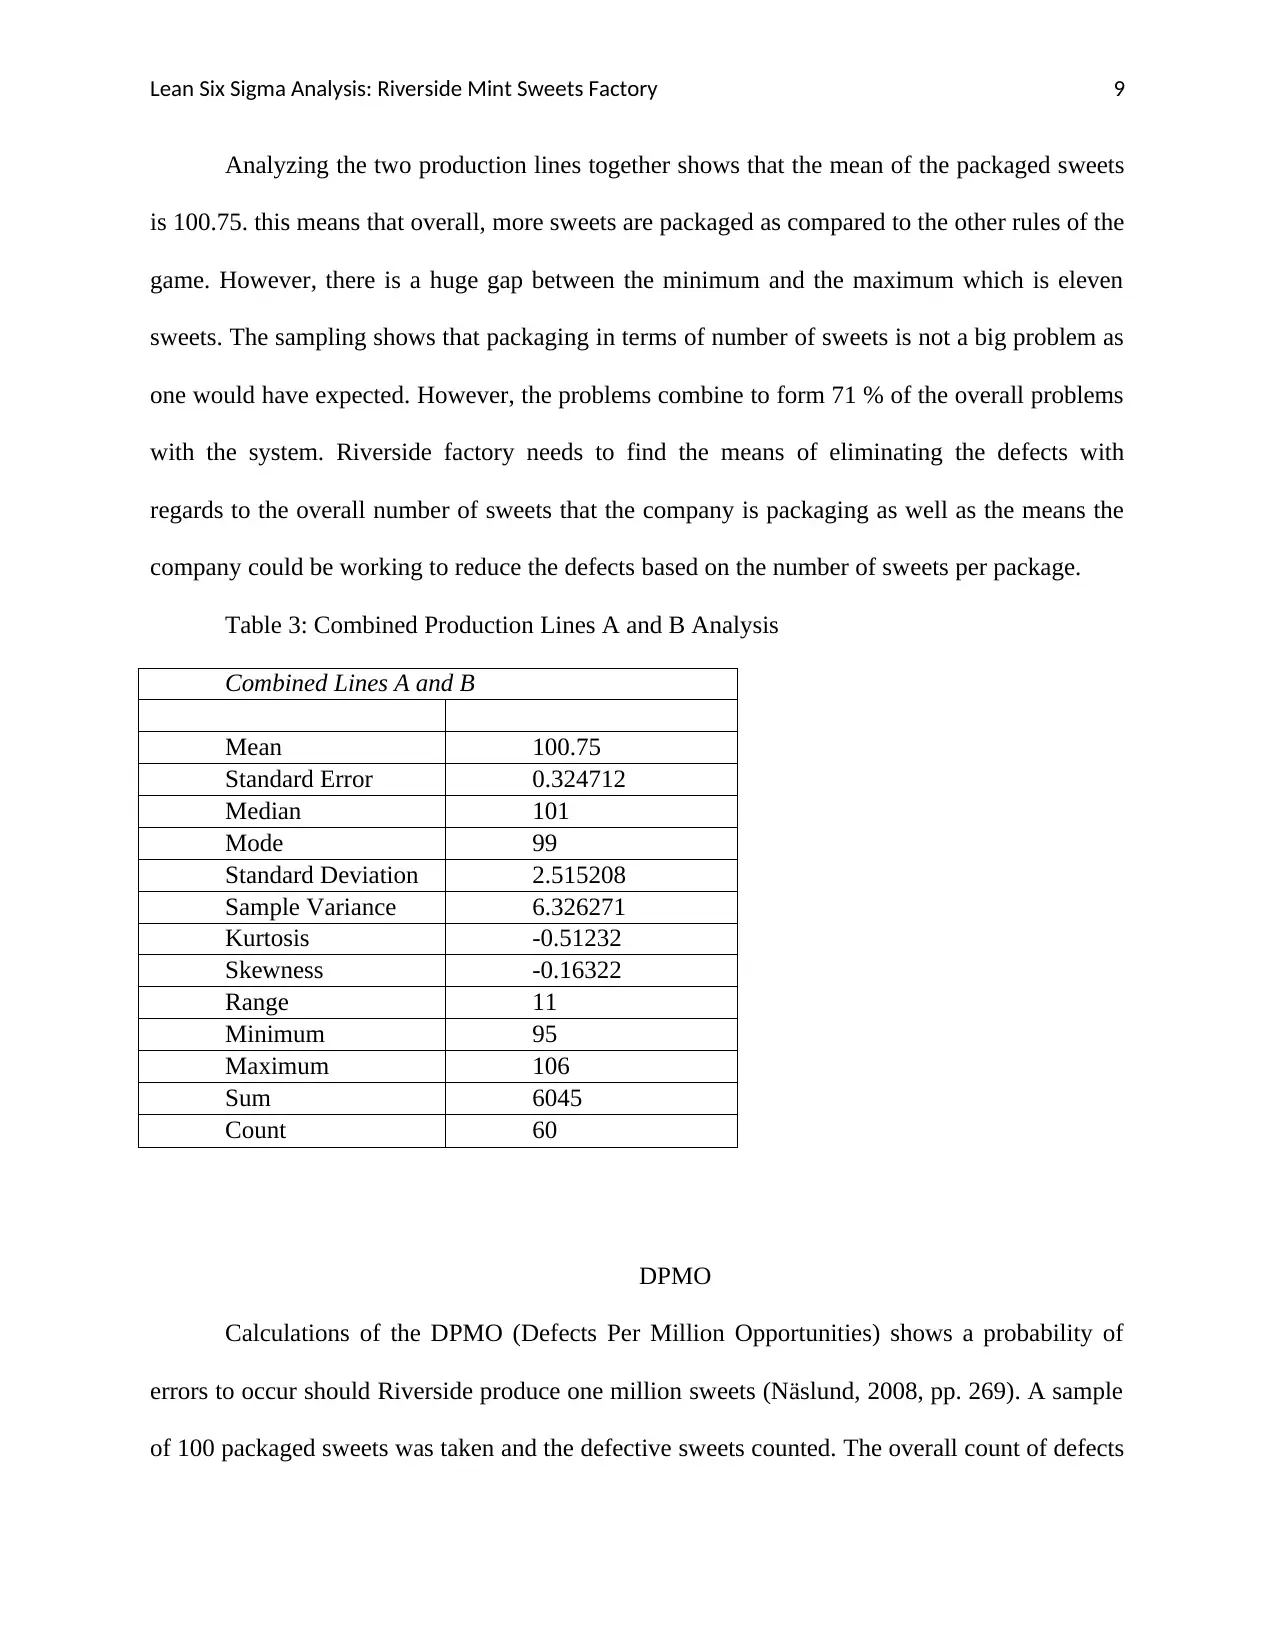
Analyzing the two production lines together shows that the mean of the packaged sweets
is 100.75. this means that overall, more sweets are packaged as compared to the other rules of the
game. However, there is a huge gap between the minimum and the maximum which is eleven
sweets. The sampling shows that packaging in terms of number of sweets is not a big problem as
one would have expected. However, the problems combine to form 71 % of the overall problems
with the system. Riverside factory needs to find the means of eliminating the defects with
regards to the overall number of sweets that the company is packaging as well as the means the
company could be working to reduce the defects based on the number of sweets per package.
Table 3: Combined Production Lines A and B Analysis
Combined Lines A and B
Mean 100.75
Standard Error 0.324712
Median 101
Mode 99
Standard Deviation 2.515208
Sample Variance 6.326271
Kurtosis -0.51232
Skewness -0.16322
Range 11
Minimum 95
Maximum 106
Sum 6045
Count 60
DPMO
Calculations of the DPMO (Defects Per Million Opportunities) shows a probability of
errors to occur should Riverside produce one million sweets (Näslund, 2008, pp. 269). A sample
of 100 packaged sweets was taken and the defective sweets counted. The overall count of defects
Lean Six Sigma Analysis: Riverside Mint Sweets Factory 10
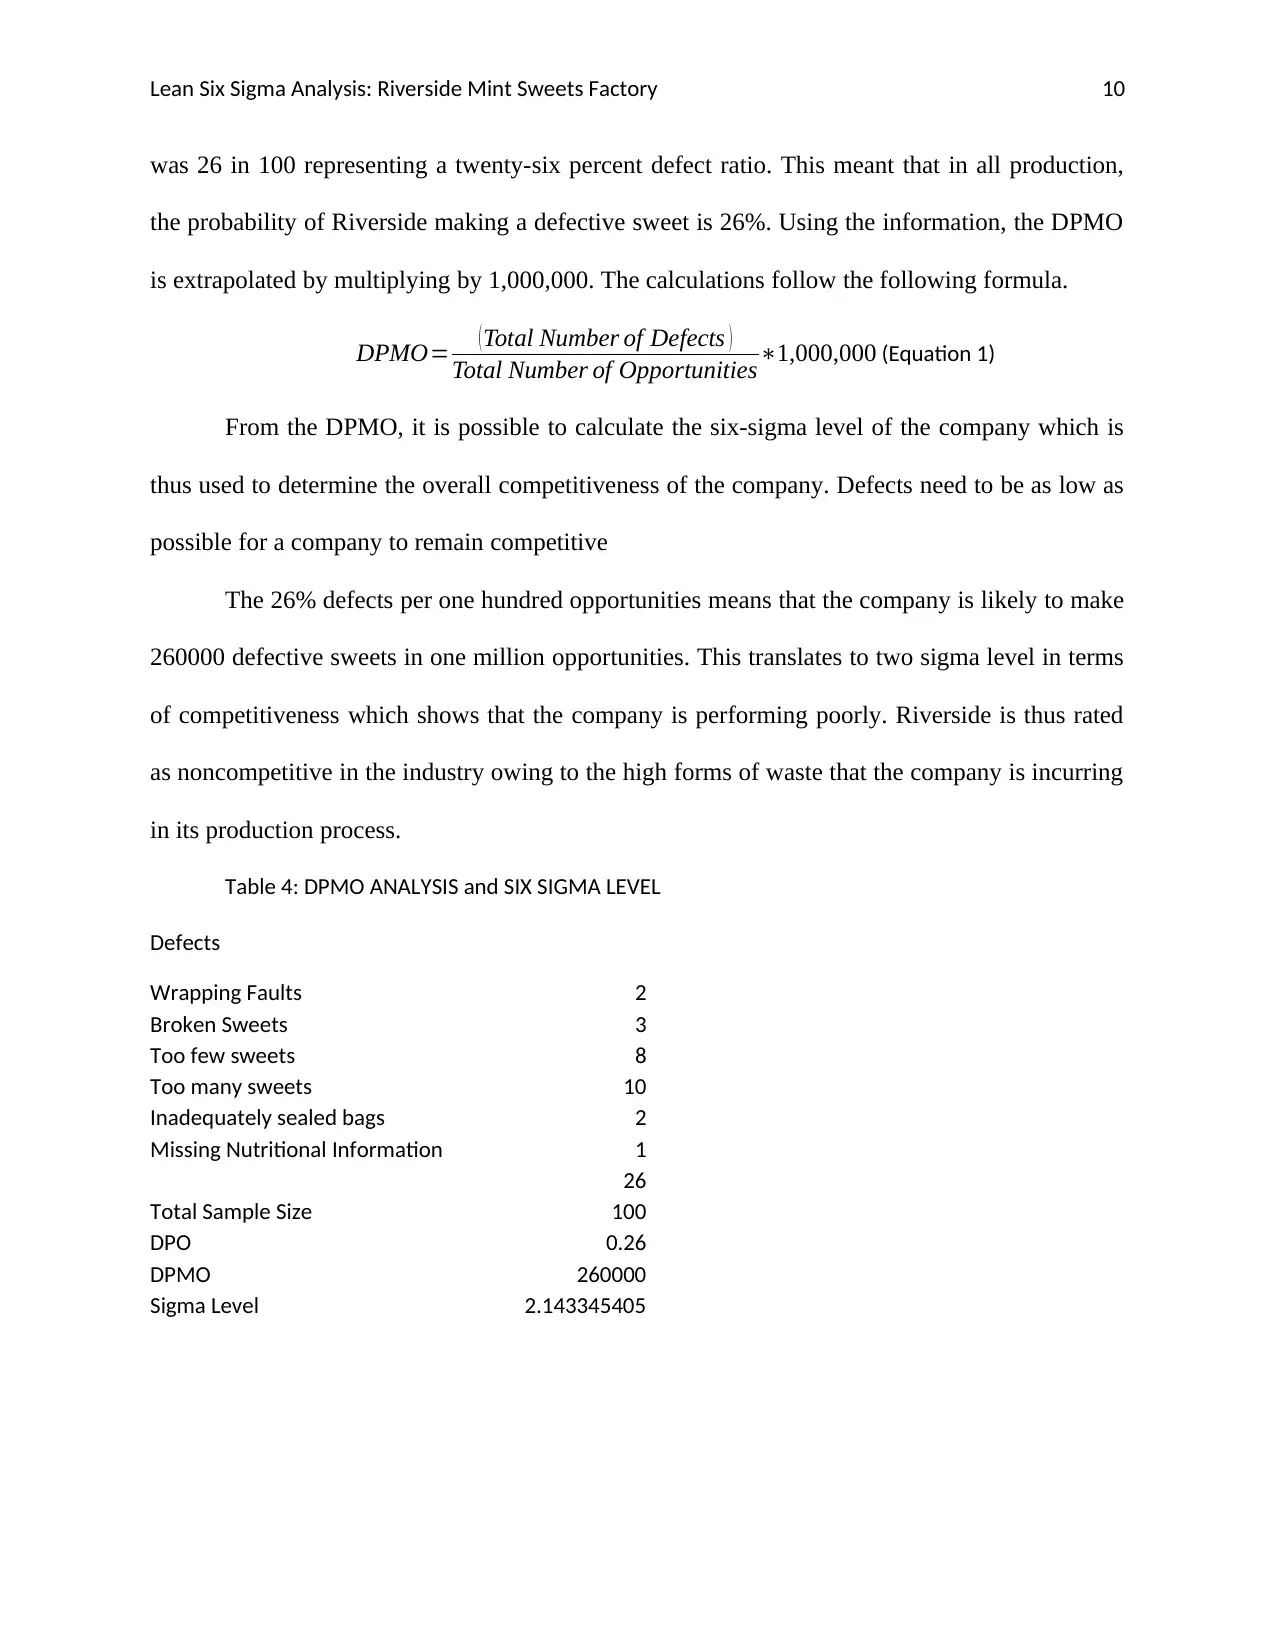
was 26 in 100 representing a twenty-six percent defect ratio. This meant that in all production,
the probability of Riverside making a defective sweet is 26%. Using the information, the DPMO
is extrapolated by multiplying by 1,000,000. The calculations follow the following formula.
DPMO= ( Total Number of Defects )
Total Number of Opportunities∗1,000,000 (Equation 1)
From the DPMO, it is possible to calculate the six-sigma level of the company which is
thus used to determine the overall competitiveness of the company. Defects need to be as low as
possible for a company to remain competitive
The 26% defects per one hundred opportunities means that the company is likely to make
260000 defective sweets in one million opportunities. This translates to two sigma level in terms
of competitiveness which shows that the company is performing poorly. Riverside is thus rated
as noncompetitive in the industry owing to the high forms of waste that the company is incurring
in its production process.
Table 4: DPMO ANALYSIS and SIX SIGMA LEVEL
Defects
Wrapping Faults 2
Broken Sweets 3
Too few sweets 8
Too many sweets 10
Inadequately sealed bags 2
Missing Nutritional Information 1
26
Total Sample Size 100
DPO 0.26
DPMO 260000
Sigma Level 2.143345405
Paraphrase This Document
Need a fresh take? Get an instant paraphrase of this document with our AI Paraphraser
Lean Six Sigma Analysis: Riverside Mint Sweets Factory 11
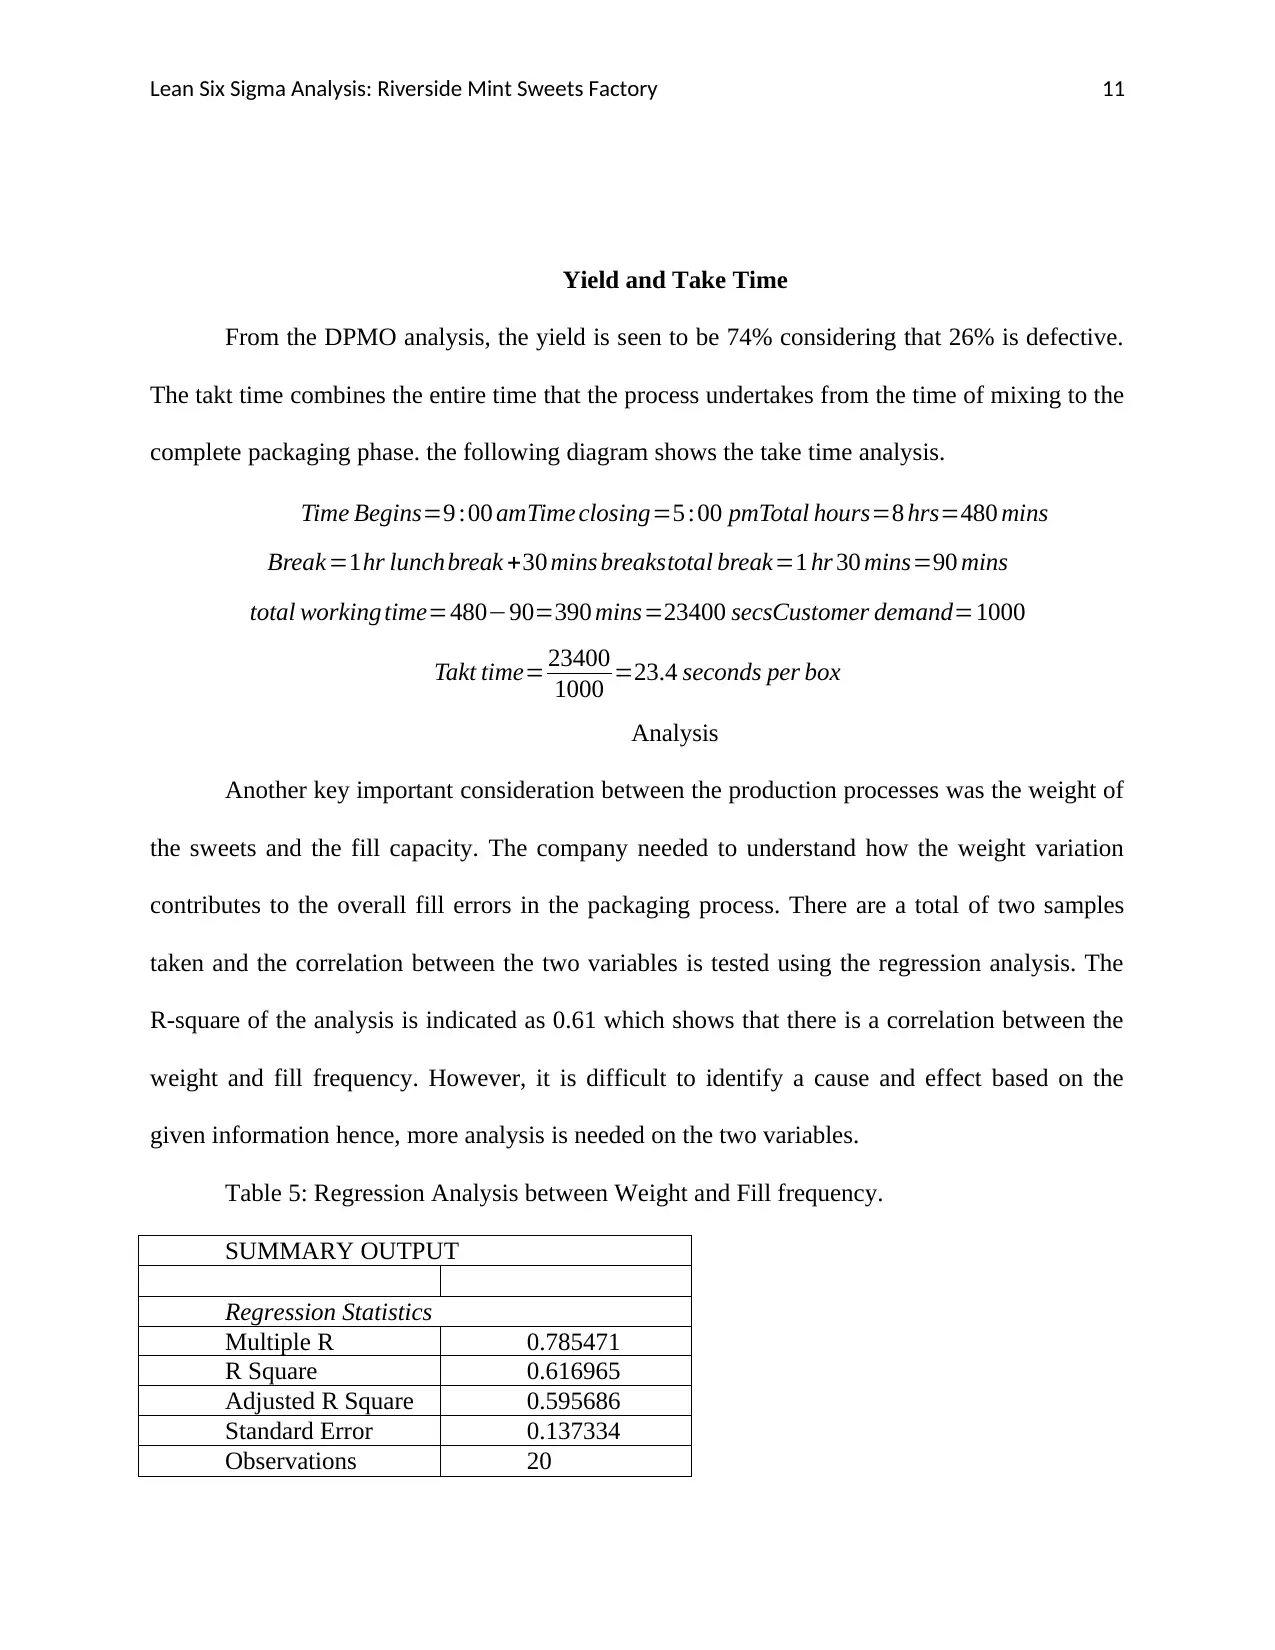
Yield and Take Time
From the DPMO analysis, the yield is seen to be 74% considering that 26% is defective.
The takt time combines the entire time that the process undertakes from the time of mixing to the
complete packaging phase. the following diagram shows the take time analysis.
Time Begins=9 :00 amTime closing=5 :00 pmTotal hours=8 hrs=480 mins
Break=1hr lunchbreak +30 mins breaks total break=1 hr 30 mins=90 mins
total working time=480−90=390 mins=23400 secsCustomer demand=1000
Takt time= 23400
1000 =23.4 seconds per box
Analysis
Another key important consideration between the production processes was the weight of
the sweets and the fill capacity. The company needed to understand how the weight variation
contributes to the overall fill errors in the packaging process. There are a total of two samples
taken and the correlation between the two variables is tested using the regression analysis. The
R-square of the analysis is indicated as 0.61 which shows that there is a correlation between the
weight and fill frequency. However, it is difficult to identify a cause and effect based on the
given information hence, more analysis is needed on the two variables.
Table 5: Regression Analysis between Weight and Fill frequency.
SUMMARY OUTPUT
Regression Statistics
Multiple R 0.785471
R Square 0.616965
Adjusted R Square 0.595686
Standard Error 0.137334
Observations 20
Lean Six Sigma Analysis: Riverside Mint Sweets Factory 12
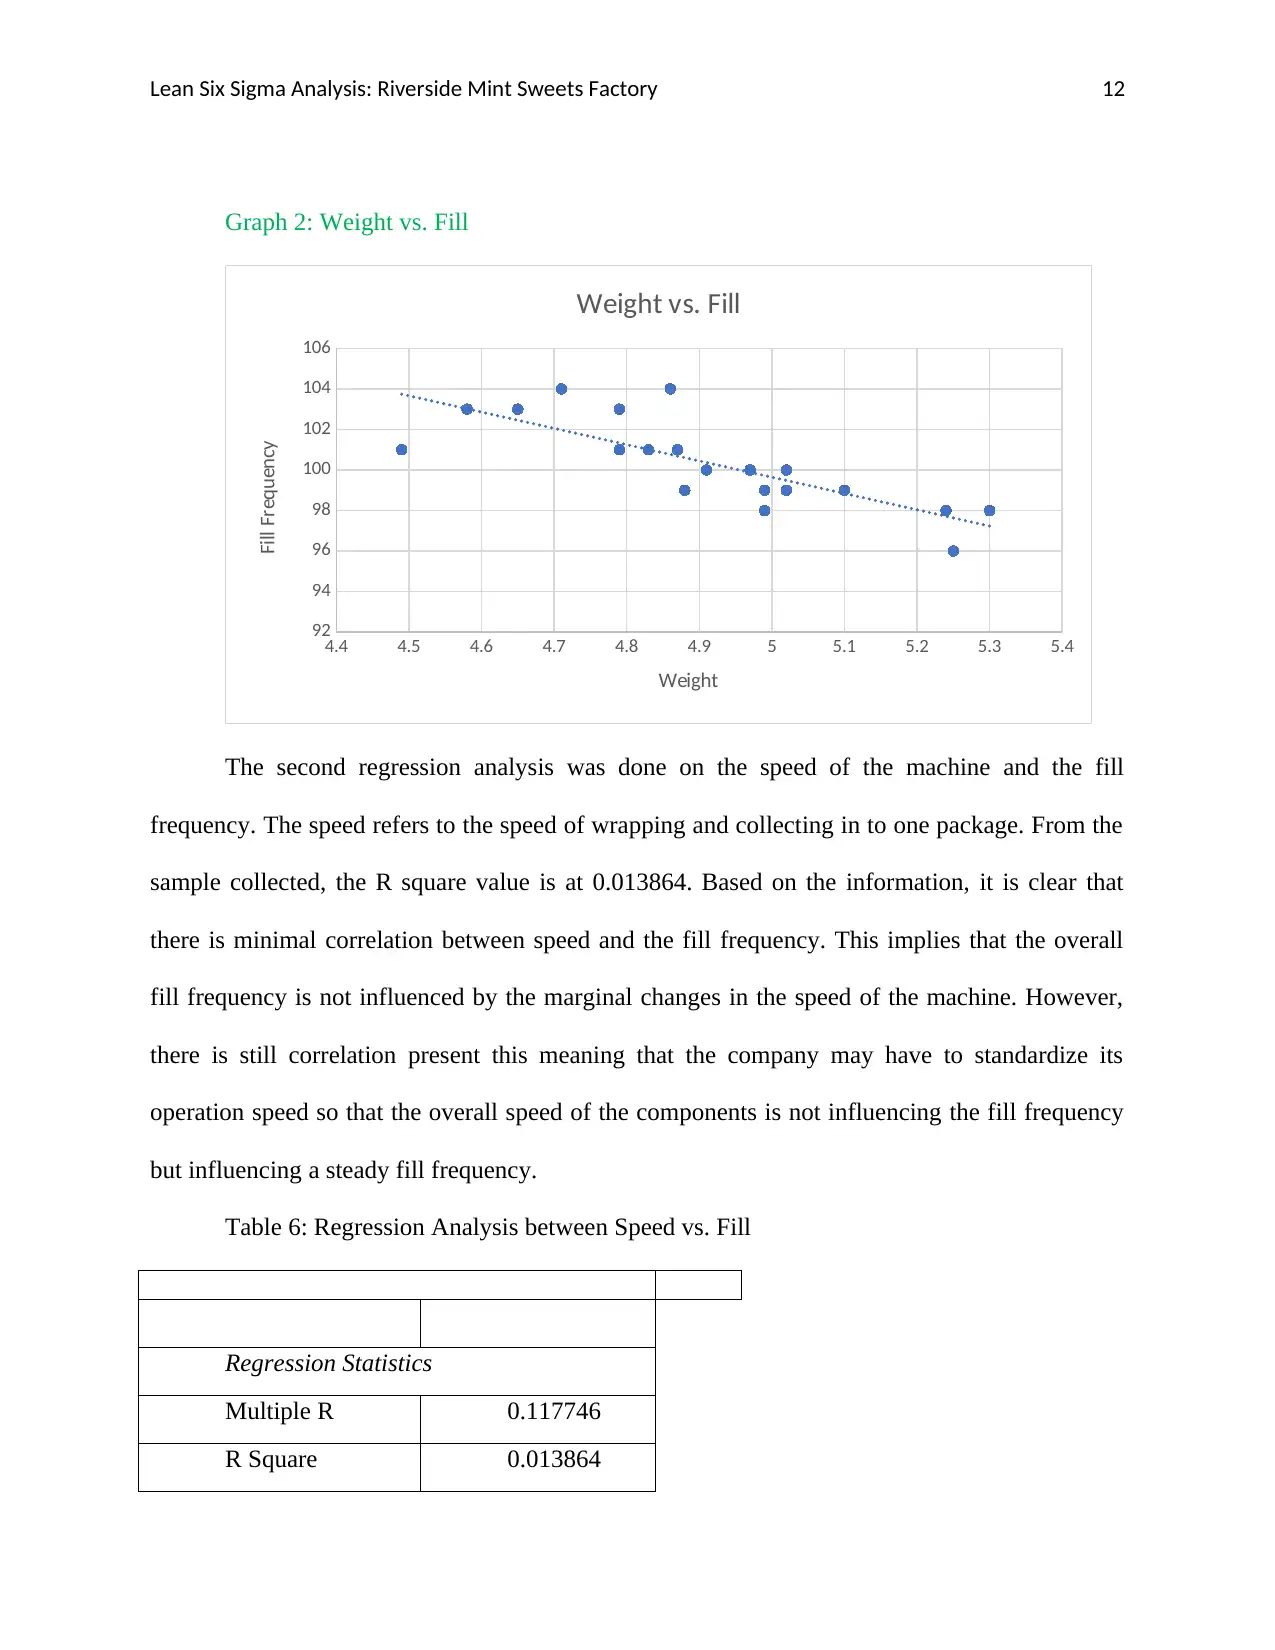
Graph 2: Weight vs. Fill
4.4 4.5 4.6 4.7 4.8 4.9 5 5.1 5.2 5.3 5.4
92
94
96
98
100
102
104
106
Weight vs. Fill
Weight
Fill Frequency
The second regression analysis was done on the speed of the machine and the fill
frequency. The speed refers to the speed of wrapping and collecting in to one package. From the
sample collected, the R square value is at 0.013864. Based on the information, it is clear that
there is minimal correlation between speed and the fill frequency. This implies that the overall
fill frequency is not influenced by the marginal changes in the speed of the machine. However,
there is still correlation present this meaning that the company may have to standardize its
operation speed so that the overall speed of the components is not influencing the fill frequency
but influencing a steady fill frequency.
Table 6: Regression Analysis between Speed vs. Fill
Regression Statistics
Multiple R 0.117746
R Square 0.013864
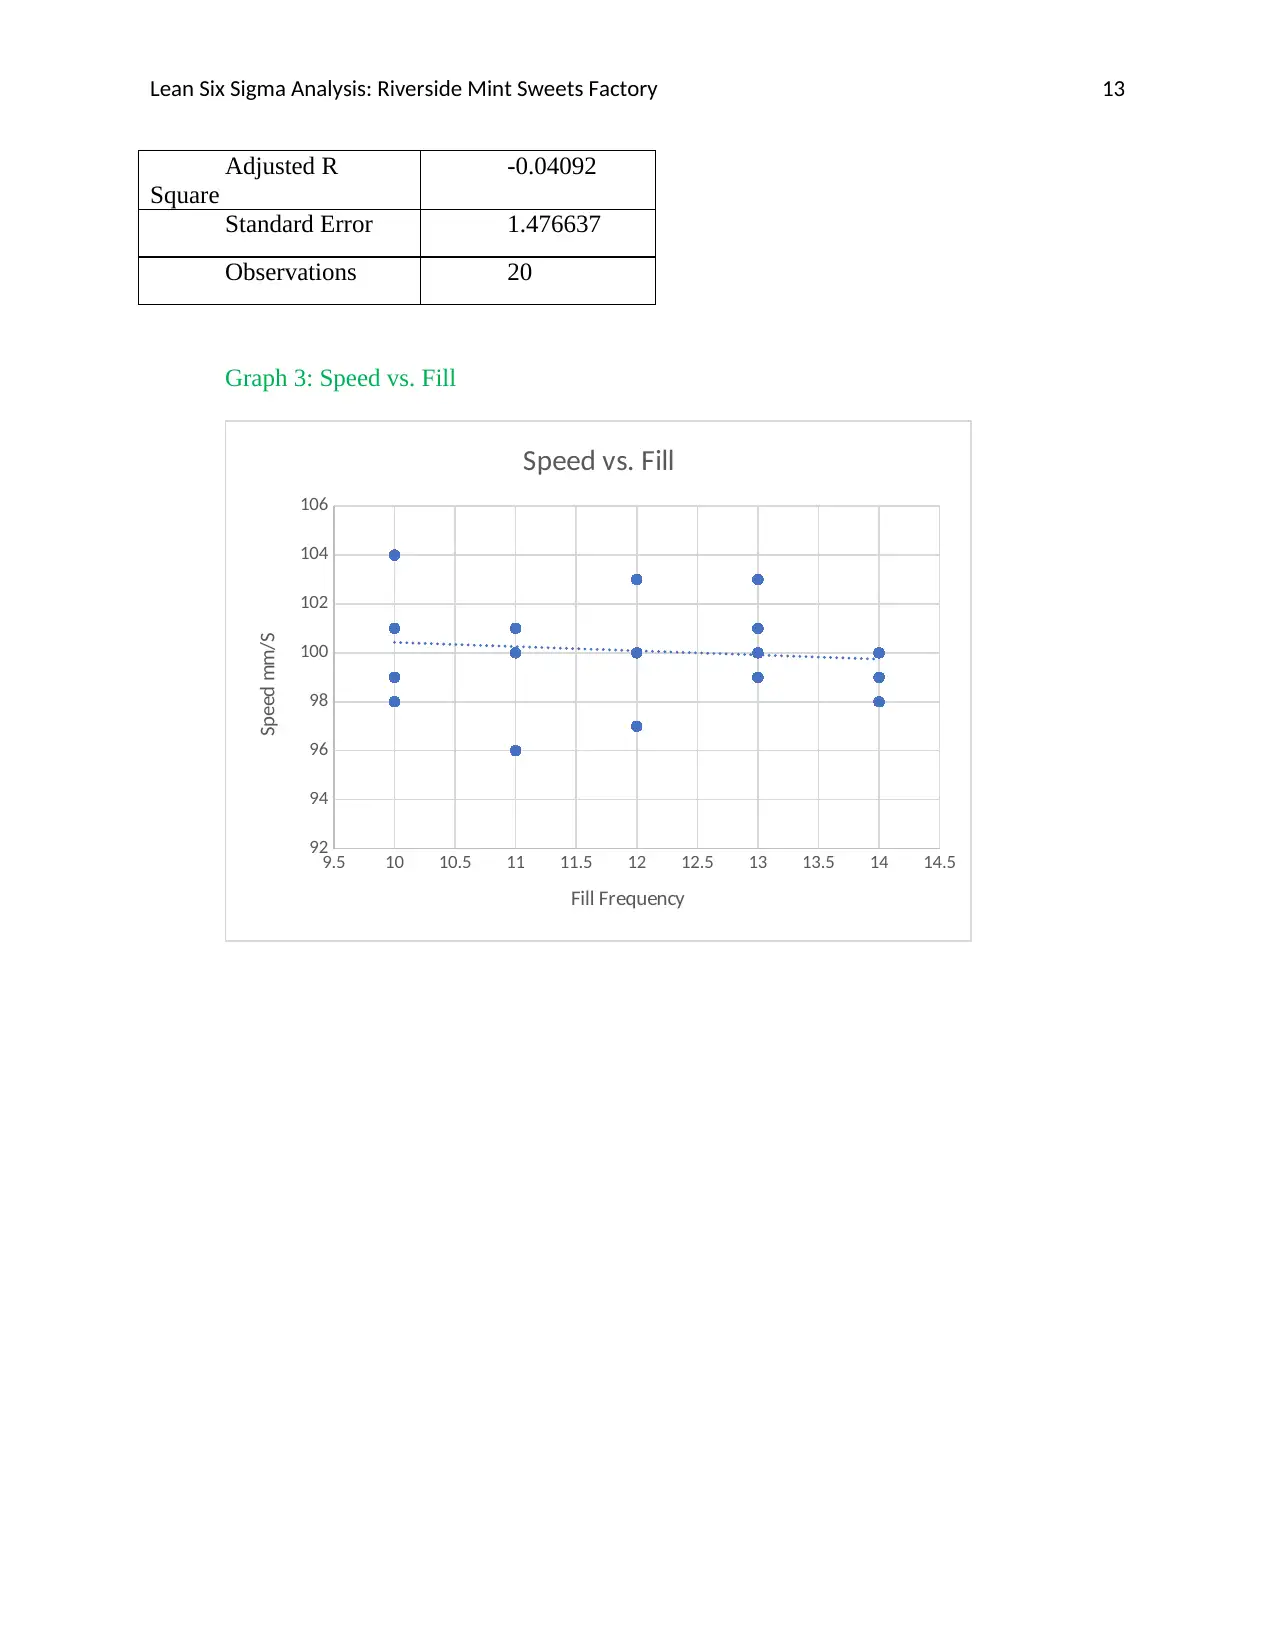
Lean Six Sigma Analysis: Riverside Mint Sweets Factory 13
Adjusted R
Square
-0.04092
Standard Error 1.476637
Observations 20
Graph 3: Speed vs. Fill
9.5 10 10.5 11 11.5 12 12.5 13 13.5 14 14.5
92
94
96
98
100
102
104
106
Speed vs. Fill
Fill Frequency
Speed mm/S
Adjusted R
Square
-0.04092
Standard Error 1.476637
Observations 20
Graph 3: Speed vs. Fill
9.5 10 10.5 11 11.5 12 12.5 13 13.5 14 14.5
92
94
96
98
100
102
104
106
Speed vs. Fill
Fill Frequency
Speed mm/S
Secure Best Marks with AI Grader
Need help grading? Try our AI Grader for instant feedback on your assignments.
Lean Six Sigma Analysis: Riverside Mint Sweets Factory 14
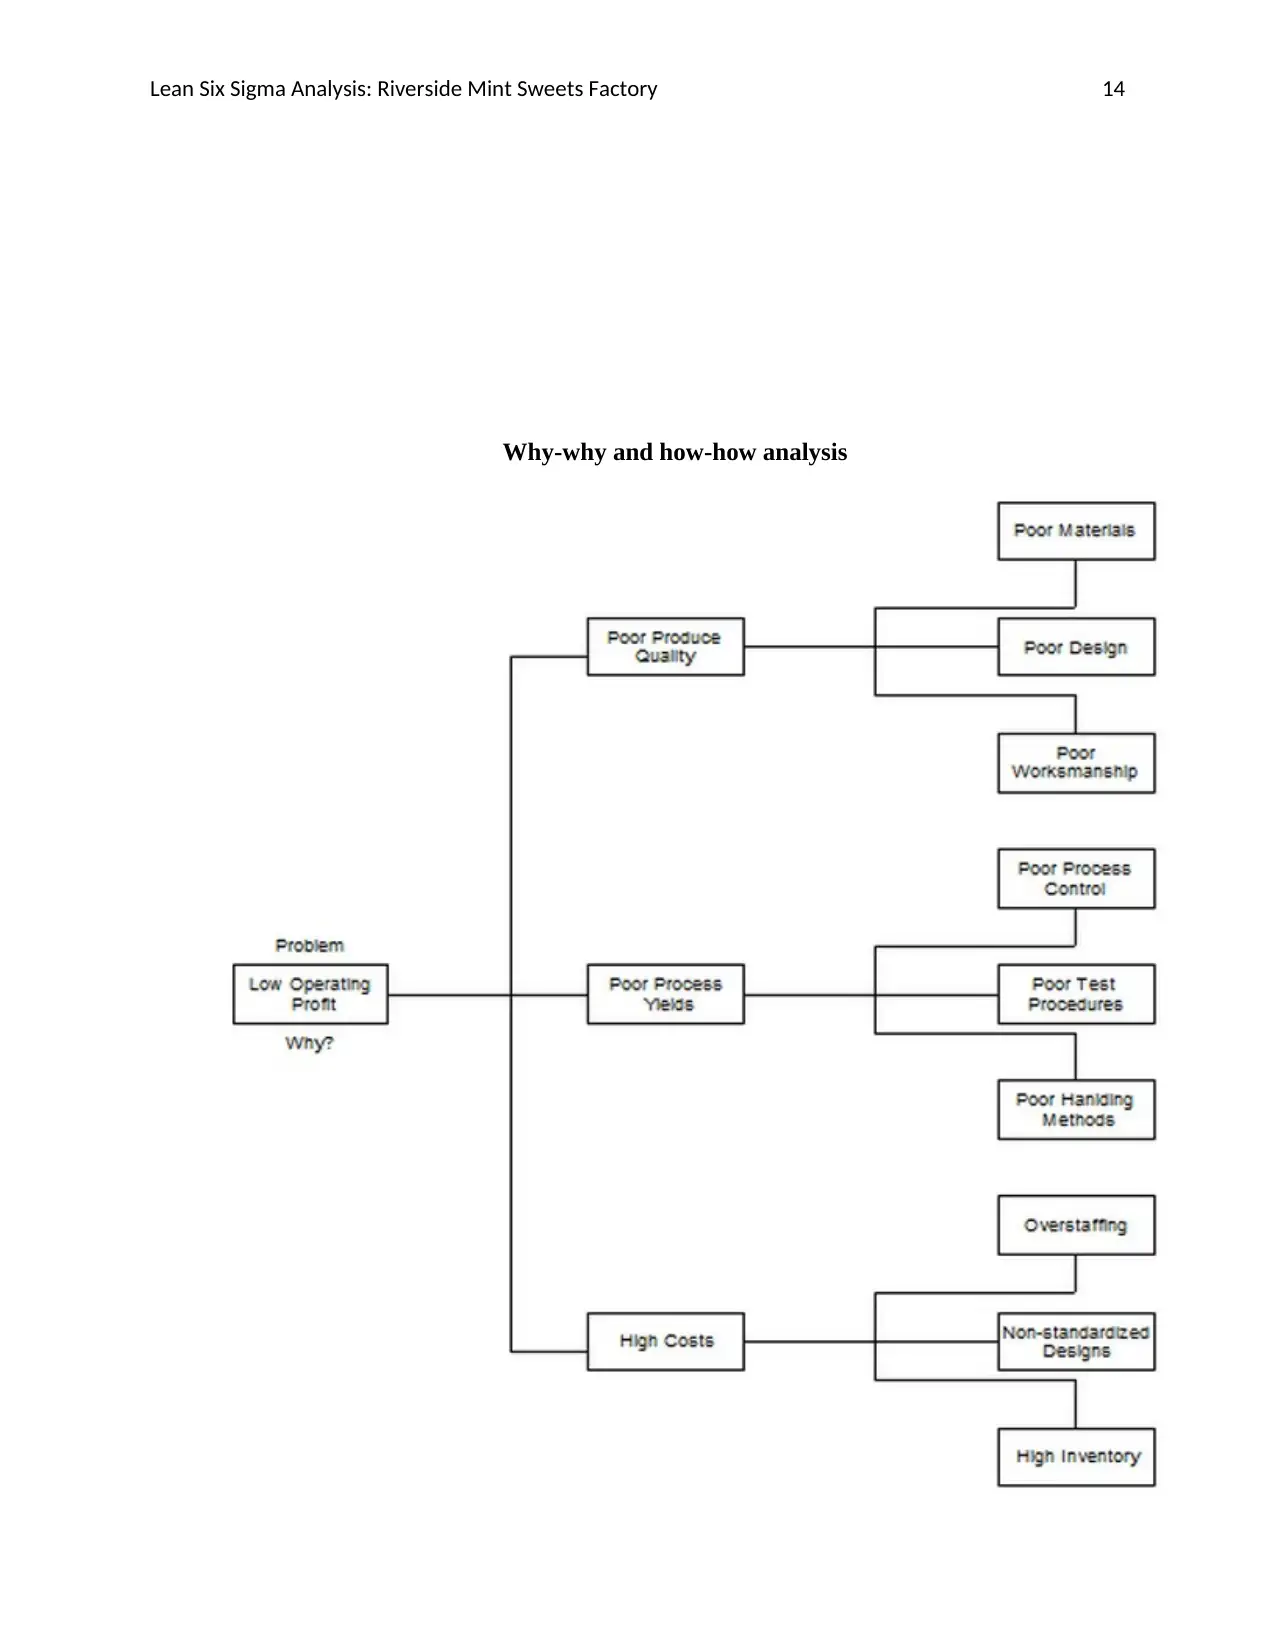
Why-why and how-how analysis
Why-why and how-how analysis
Lean Six Sigma Analysis: Riverside Mint Sweets Factory 15
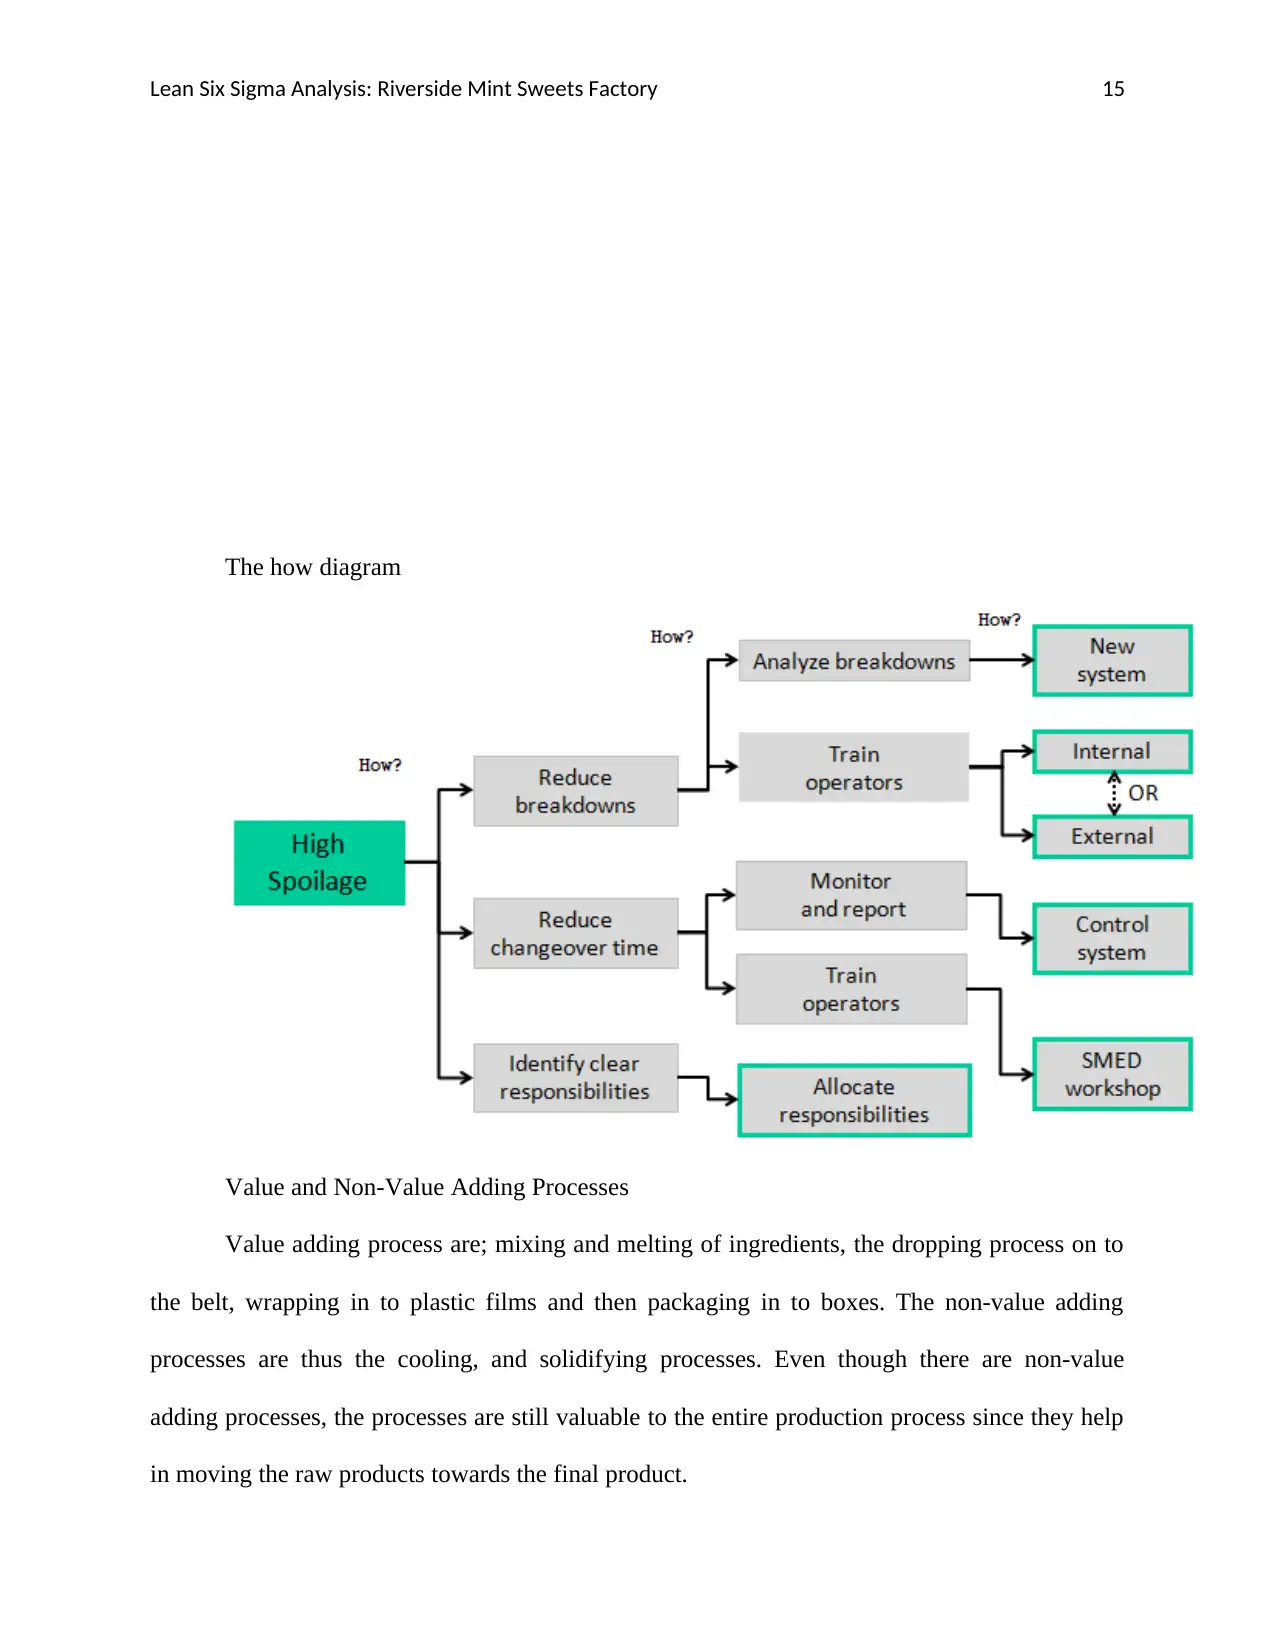
The how diagram
Value and Non-Value Adding Processes
Value adding process are; mixing and melting of ingredients, the dropping process on to
the belt, wrapping in to plastic films and then packaging in to boxes. The non-value adding
processes are thus the cooling, and solidifying processes. Even though there are non-value
adding processes, the processes are still valuable to the entire production process since they help
in moving the raw products towards the final product.
Lean Six Sigma Analysis: Riverside Mint Sweets Factory 16
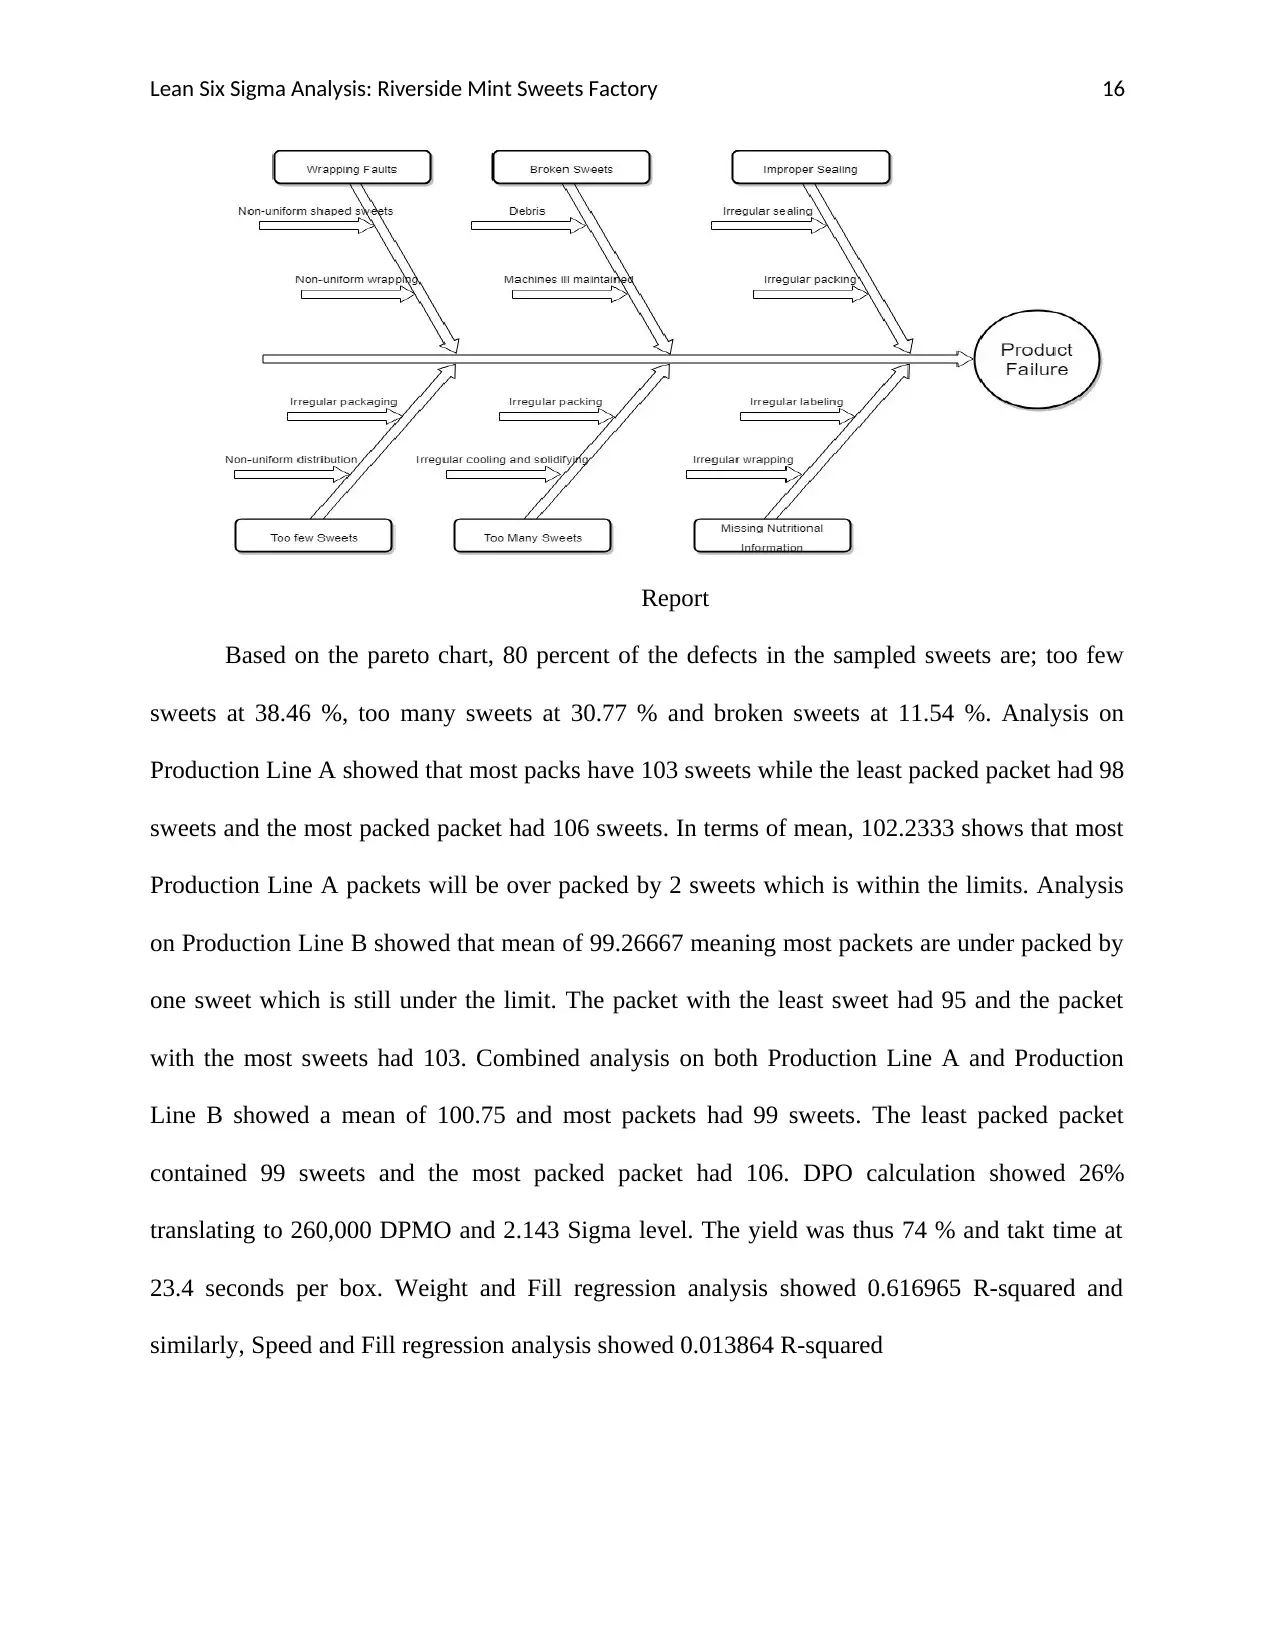
Report
Based on the pareto chart, 80 percent of the defects in the sampled sweets are; too few
sweets at 38.46 %, too many sweets at 30.77 % and broken sweets at 11.54 %. Analysis on
Production Line A showed that most packs have 103 sweets while the least packed packet had 98
sweets and the most packed packet had 106 sweets. In terms of mean, 102.2333 shows that most
Production Line A packets will be over packed by 2 sweets which is within the limits. Analysis
on Production Line B showed that mean of 99.26667 meaning most packets are under packed by
one sweet which is still under the limit. The packet with the least sweet had 95 and the packet
with the most sweets had 103. Combined analysis on both Production Line A and Production
Line B showed a mean of 100.75 and most packets had 99 sweets. The least packed packet
contained 99 sweets and the most packed packet had 106. DPO calculation showed 26%
translating to 260,000 DPMO and 2.143 Sigma level. The yield was thus 74 % and takt time at
23.4 seconds per box. Weight and Fill regression analysis showed 0.616965 R-squared and
similarly, Speed and Fill regression analysis showed 0.013864 R-squared
Paraphrase This Document
Need a fresh take? Get an instant paraphrase of this document with our AI Paraphraser
Lean Six Sigma Analysis: Riverside Mint Sweets Factory 17
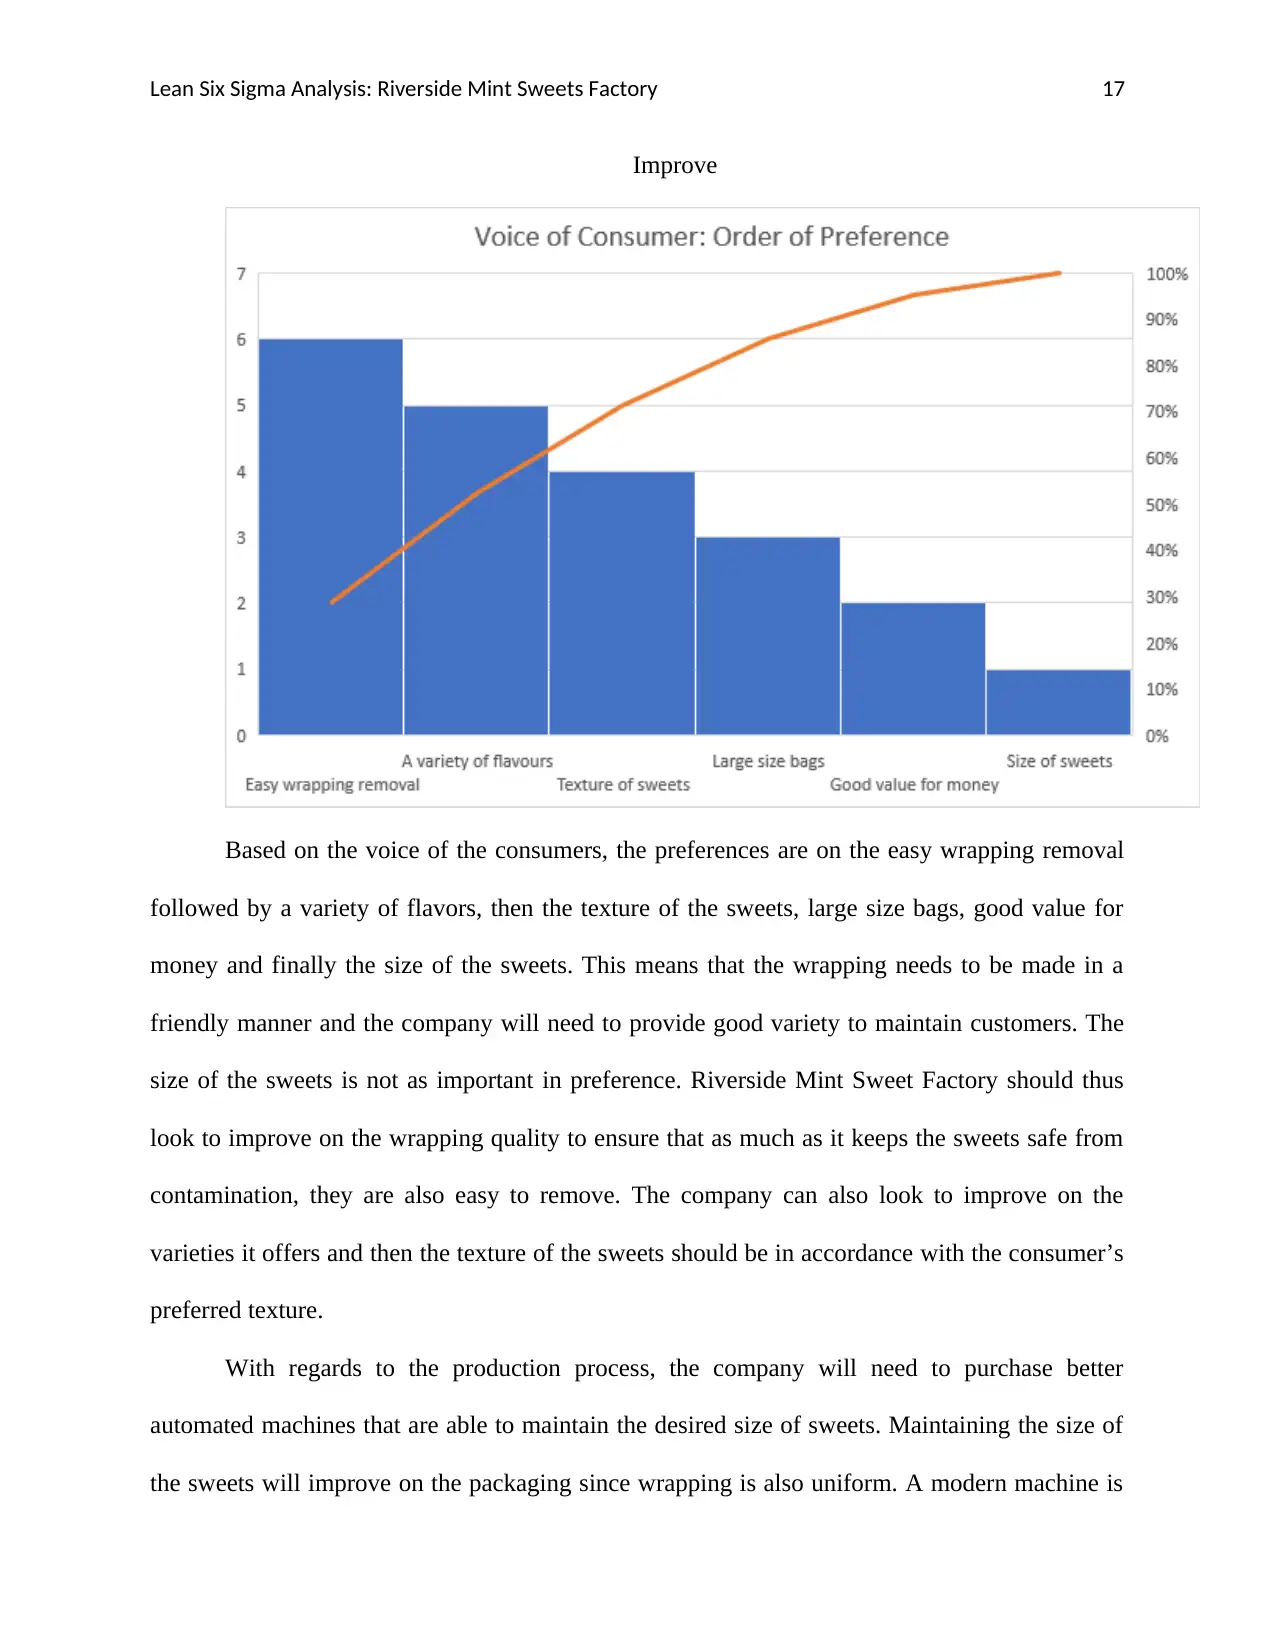
Improve
Based on the voice of the consumers, the preferences are on the easy wrapping removal
followed by a variety of flavors, then the texture of the sweets, large size bags, good value for
money and finally the size of the sweets. This means that the wrapping needs to be made in a
friendly manner and the company will need to provide good variety to maintain customers. The
size of the sweets is not as important in preference. Riverside Mint Sweet Factory should thus
look to improve on the wrapping quality to ensure that as much as it keeps the sweets safe from
contamination, they are also easy to remove. The company can also look to improve on the
varieties it offers and then the texture of the sweets should be in accordance with the consumer’s
preferred texture.
With regards to the production process, the company will need to purchase better
automated machines that are able to maintain the desired size of sweets. Maintaining the size of
the sweets will improve on the packaging since wrapping is also uniform. A modern machine is
Lean Six Sigma Analysis: Riverside Mint Sweets Factory 18
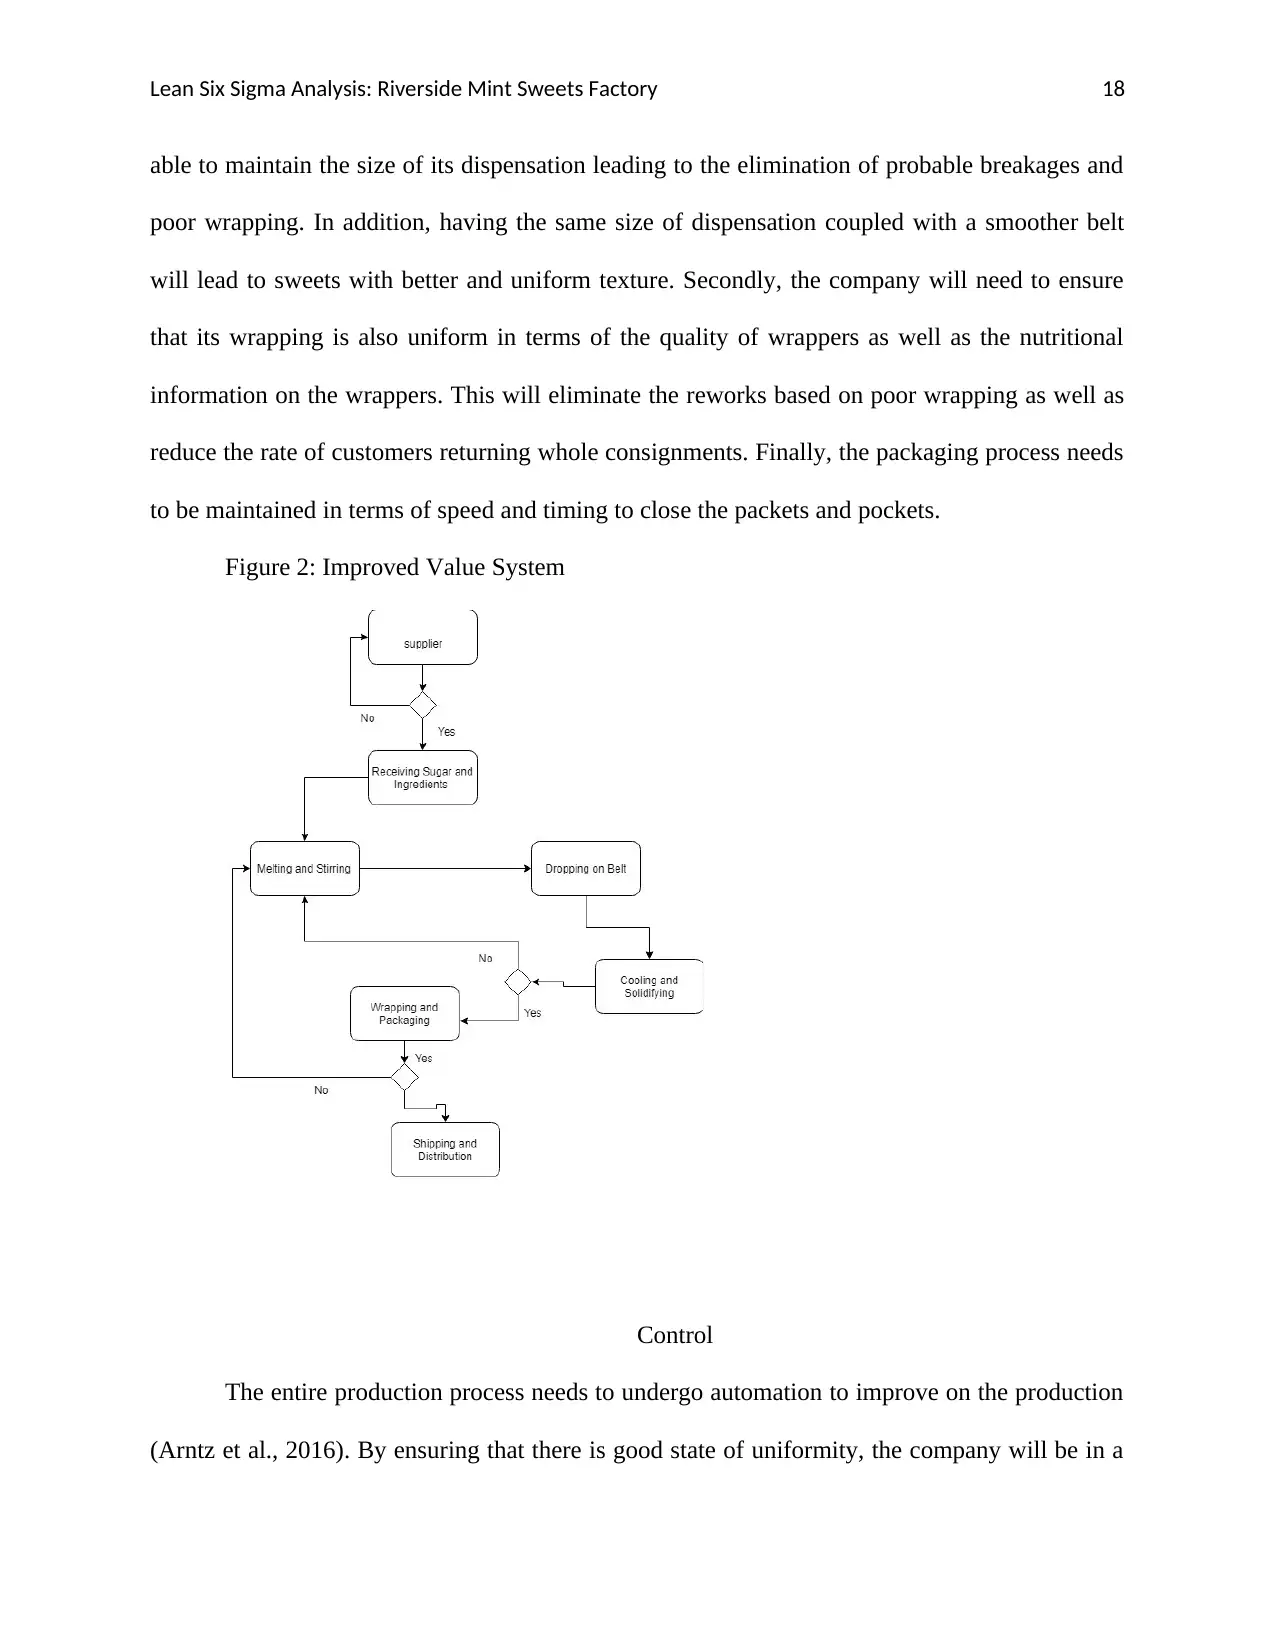
able to maintain the size of its dispensation leading to the elimination of probable breakages and
poor wrapping. In addition, having the same size of dispensation coupled with a smoother belt
will lead to sweets with better and uniform texture. Secondly, the company will need to ensure
that its wrapping is also uniform in terms of the quality of wrappers as well as the nutritional
information on the wrappers. This will eliminate the reworks based on poor wrapping as well as
reduce the rate of customers returning whole consignments. Finally, the packaging process needs
to be maintained in terms of speed and timing to close the packets and pockets.
Figure 2: Improved Value System
Control
The entire production process needs to undergo automation to improve on the production
(Arntz et al., 2016). By ensuring that there is good state of uniformity, the company will be in a
Lean Six Sigma Analysis: Riverside Mint Sweets Factory 19
position to maintain the positive changes for a long time. For example, as much as supervisors
are inspecting the quality of the production, they are still not able to detect issues regarding the
fill frequency per packet, the small defects on sweet texture and even the possibility of wrappers
having inadequate information or twisted poorly. Through automation, one can read the
information in real time hence maintain quality checks faster than currently being done (Groover,
2016). The company will also be in a position to reduce the total number of workers thus
reducing on the salaries and wages that it has to pay (David, 2015, pp. 4). Another key factor is
that human error is reduced through automation leading to better quality of production (Chui et
al., 2015, pp. 2)hence better-quality sweets.
Secure Best Marks with AI Grader
Need help grading? Try our AI Grader for instant feedback on your assignments.
Lean Six Sigma Analysis: Riverside Mint Sweets Factory 20
References
Albliwi, S.A., Antony, J. and Lim, S.A.H., 2015. A systematic review of Lean Six Sigma for the
manufacturing industry. Business Process Management Journal, 21(3), pp.665-691.
Arnheiter, E.D. and Maleyeff, J., 2005. The integration of lean management and Six Sigma. The
TQM magazine, 17(1), pp.5-18.
Arntz, M., Gregory, T. and Zierahn, U., 2016. The risk of automation for jobs in OECD
countries.
Chui, M., Manyika, J. and Miremadi, M., 2015. Four fundamentals of workplace
automation. McKinsey Quarterly, 29(3), pp.1-9.
David, H., 2015. Why are there still so many jobs? The history and future of workplace
automation. Journal of economic perspectives, 29(3), pp.3-30.
De Mast, J. and Lokkerbol, J., 2012. An analysis of the Six Sigma DMAIC method from the
perspective of problem solving. International Journal of Production Economics, 139(2),
pp.604-614.
Evans, J.R. and Lindsay, W.M., 2014. An introduction to Six Sigma and process improvement.
Cengage Learning.
Furterer, S.L., 2016. Lean Six Sigma in service: applications and case studies. CRC press.
Groover, M.P., 2016. Automation, production systems, and computer-integrated manufacturing.
Pearson Education India.
Khan, M., Jaber, M.Y. and Bonney, M., 2011. An economic order quantity (EOQ) for items with
imperfect quality and inspection errors. International Journal of Production
Economics, 133(1), pp.113-118.
Lean Six Sigma Analysis: Riverside Mint Sweets Factory 21
Mishra, P. and Kumar Sharma, R., 2014. A hybrid framework based on SIPOC and Six Sigma
DMAIC for improving process dimensions in supply chain network. International
Journal of Quality & Reliability Management, 31(5), pp.522-546.
Munro, R.A., Ramu, G. and Zrymiak, D.J., 2015. The certified Six Sigma green belt handbook.
ASQ Quality Press.
Näslund, D., 2008. Lean, six sigma and lean sigma: fads or real process improvement
methods?. Business Process Management Journal, 14(3), pp.269-287.
Pepper, M.P. and Spedding, T.A., 2010. The evolution of lean Six Sigma. International Journal
of Quality & Reliability Management, 27(2), pp.138-155.
Snee, R.D., 2010. Lean Six Sigma–getting better all the time. International Journal of Lean Six
Sigma, 1(1), pp.9-29.
Summers, D.C., 2007. Six sigma: Basic tools and techniques. Upper Saddle River, NJ:
Pearson/Prentice Hall.
Voehl, F., Mignosa, C., Harrington, H.J. and Charron, R., 2016. The lean six sigma black belt
handbook: tools and methods for process acceleration. Productivity Press.
Westgard, S., 2013. Prioritizing risk analysis quality control plans based on Sigma-
metrics. Clinics in laboratory medicine, 33(1), pp.41-53.
Woods, D.D., Dekker, S., Cook, R., Johannesen, L. and Sarter, N., 2017. Behind human error.
CRC Press.
Zhang, M., Wang, W., Goh, T.N. and He, Z., 2015. Comprehensive Six Sigma application: a
case study. Production Planning & Control, 26(3), pp.219-234.
1 out of 21

Your All-in-One AI-Powered Toolkit for Academic Success.
+13062052269
info@desklib.com
Available 24*7 on WhatsApp / Email
![[object Object]](/_next/static/media/star-bottom.7253800d.svg)
Unlock your academic potential
© 2024 | Zucol Services PVT LTD | All rights reserved.