Teesside University: CIS4035-N Machine Learning Application Report
VerifiedAdded on 2023/02/01
|13
|3415
|24
Report
AI Summary
This report presents a machine learning analysis of a Universal Bank dataset using Python. The assignment focuses on applying supervised learning algorithms, specifically logistic regression and decision trees, to answer questions about customer behavior. The report begins with an abstract explaining the importance of machine learning and its applications. It then describes the dataset, including variables such as age, income, and loan information. Descriptive statistics are provided to understand the data, followed by the implementation of logistic regression to analyze how experience and income affect a customer's likelihood of obtaining a personal loan. The report also explores how experience, education, and income influence a customer's decision to invest in securities, using a decision tree classification model. The models are evaluated and the results are discussed, including the use of plots and statistical measures to assess the relationships between variables and the performance of the algorithms.
Learning 1
Machine Learning With Python
Name of Student
Name of Class
Name of Professor
Name of School
State and City
Date
Machine Learning With Python
Name of Student
Name of Class
Name of Professor
Name of School
State and City
Date
Paraphrase This Document
Need a fresh take? Get an instant paraphrase of this document with our AI Paraphraser
Learning 2
Abstract
The aim of the assignment is to actually analyze a suitable dataset via machine learning
in python. Thinking of it, you will realize that we have moved from an era where computers used
to be large frames and now they are just clouds (Kuppusamy, Gopal and Prabhu, 2015). This
though is not the most interesting part; the world of data science has introduced most amazing
works that computers have, enabling individuals with data science specialists; data scientists and
data analysts to have jobs to do in different ways when data is involved and end up making a few
dollars. The modification of the data science world has brought into play several algorithms
which are run in different data software to help in understanding what datasets actually are and
what they portray. The analysis of datasets using algorithms is called machine learning. Machine
learning is seen as a subset or an application of artificial intelligence (Steels and Brooks, 2018).
Machine learning is the con of algorithms and statistical models by computers, which computer
later use to perfectly execute definite computational works. Here there are no explicit
instructions needed (Parmar, Grossmann, Bussink, Lambin and Aerts, 2015). Artificial
intelligence on the other is the ability of computers to perform tasks with the intelligence
matched to that of humans (Russell and Norvig, 2016).
Machine learning; on the other hand, has different categories. The categories or types are
actually three in total. There is the supervised learning where a machine learning algorithm is
actually fit with a dependent (return or response variable) to be determined by a set of the
predictor (independent variables) to see the outcome. Then there is the unsupervised learning
where there is no target variable to be determined. Only variables are clustered in different
groups. Then there is the reinforcement learning where the computer is trained to work in a
specific way while in an environment. They are forced to think and identify activities found in
that environment. Unsupervised learning is used mostly by most tech firms like Google to help
bring people what they search for with ease. Meaning the machine has been trained and knows
what your device needs (Baydin, Pearlmutter, Radul and Siskind, 2018).
As per our assignment; the machine learning algorithms that I will use is one supervised
learning; logistic regression and one classification machine learning algorithm; decision tree.
Introduction
This area we will do a thorough description of the dataset that we are supposed to use.
The requirement of the assignment was that we use a movies dataset that was provided or choose
any publicly available dataset that is reliable. In this case, I chose the dataset from a bank; the
Universal Bank. The dataset had 5000 observations; this is 5000 customer details of the bank's
customers were to be studied. Of the actual variables, there were; the customers' ID, representing
the number of the customer given by the bank. Age of each customer, from the dataset all of
them, were adults. The next variable is Experience; this illustrates the number of years a
Learning 3
customer has been a customer to the bank. The younger the customer the lesser the number of
years as younger customers experience is lower in number. The next variables are Income and
ZIP Code. The family variable represents the number of people in each and every house where a
customer comes from. The CCAvg is actually the rate at which a customer's risks are going to
be covered by a bank. Education is the number of institution-level that a customer has attended
up to the ladder since elementary school. The Mortgage variable is the existence of a customer
with a mortgage loan. This then is illustrated by actually the number of mortgage taken by
hundreds of dollars. A personal loan is an actual loan taken for personal use and upkeep.
Securities are the stock investments that a person has with the bank. The last three variables; CD
Account, Online and credit card are modes that customers use while banking.
Descriptive Statistics
Verbal analysis of datasets only enables us to understand actual variables meaning. This will
prompt us to lead the data into Jupyter notebook to run the group analysis and the individualistic
analysis. But since the dataset is in excel and is saved in xlsx format. We will have to change it
to CSV comma delimited file. This is the format which we will use to upload the dataset into
python's Jupyter Notebook. We then, from Jupyter Notebook, install libraries pandas and os
(Howse, 2013). The actual dataset when loaded, the code variable = pd.read_csv(r"C:\Users\
Name of Device User\Desktop\Python Machine Learning\UniversalBank.csv"). Variable is the
name in which save our dataset as in the working directory. The part that starts with C: is where
our dataset is saved as per my computer (VanderPlas, 2016). After which we will be able to see
the set of data but only the top four columns will be displayed.
Cleaning of a dataset is always required in machine learning or any other data science
works. The reason for this is to help data more desirable to work with. Imagine using a dataset
that has more un-meaningful variables or missing entries that would be quit ignoring right?
Looking at the cleaning codes; the actual codes used are variable.isnull(). This is only done using
Python. This is after installing the numpy library. The code when run gives us FALSE results in
each and every entry of the rows and the columns. This means that there are no missing values
that there exist in the dataset (McKinney, W., 2012.) The dataset to has numerical values.
Numerical values are the best to work within python, this is because they are the only one that
python accepts. Another way of checking for missing values is; variable.isnull().any() which
gives missing values by column and not the entire dataset (Donnelly, 2014).
Individualistic descriptive statistics can be gotten by running the codes;
variable.median(), this gives us the actual median by column. The code variable.mean(), gives
variable mean by columns. The code variable.max() gives maximum values in each and every
column. The code variable.std() shows the standard of each and every variable of a column from
the mean of the respective column. The code variable.var() gives us the variance of each every
variable from each other (Schutt and O'Neil, 2014). Descriptive statistics can as well be done to
⊘ This is a preview!⊘
Do you want full access?
Subscribe today to unlock all pages.
Trusted by 1+ million students worldwide
Learning 4
the entire dataset using the code; variable.describe() which will give the same values as the ones
we were getting in the individualistic analyses.
Machine Learning Models
Set of questions to be answered:
There is one set of two questions that I developed for my machine learning project.
1. How do Experience and Income affect a customer's ability to getting a Personal Loan?
2. How do Experience, Education and Income affect a customer’s decision of having
Securities with the bank?
The very first question will be done under a logistic regression analysis in python. In addition to
the other libraries that have been installed, we will add libraries; from scipy. stats import
spearman, from pylab import rcParams, import seaborn as sb, import matplotlib.pyplot as plt,
import sklearn, from sklearn.preprocessing import scale, from sklearn.linear_model import
LogisticRegression, from sklearn.model_selection import train_test_split, from sklearn import
metrics, from sklearn import preprocessing (Raschka, 2015).
We answer our first question using logistic regression. Here we will use a binary form of a
dependent variable against a set of independent variables. We will predict the probability of
occurrence by fitting data into a logistic model. We will check for the independence of each and
every variable before we actually proceed with the actual algorithm code development. You
should know that you need a dataset with at least 50 observations for better results. Checking for
the independence of variables we will actually end up visualizing that on a plot. The code that
gives us that is something that goes like; sb.regplot(x='Experience', y='Income', data = variable,
scatter = True). The actual plot that we have to visualize the variables points’ independence is;
Paraphrase This Document
Need a fresh take? Get an instant paraphrase of this document with our AI Paraphraser
Learning 5
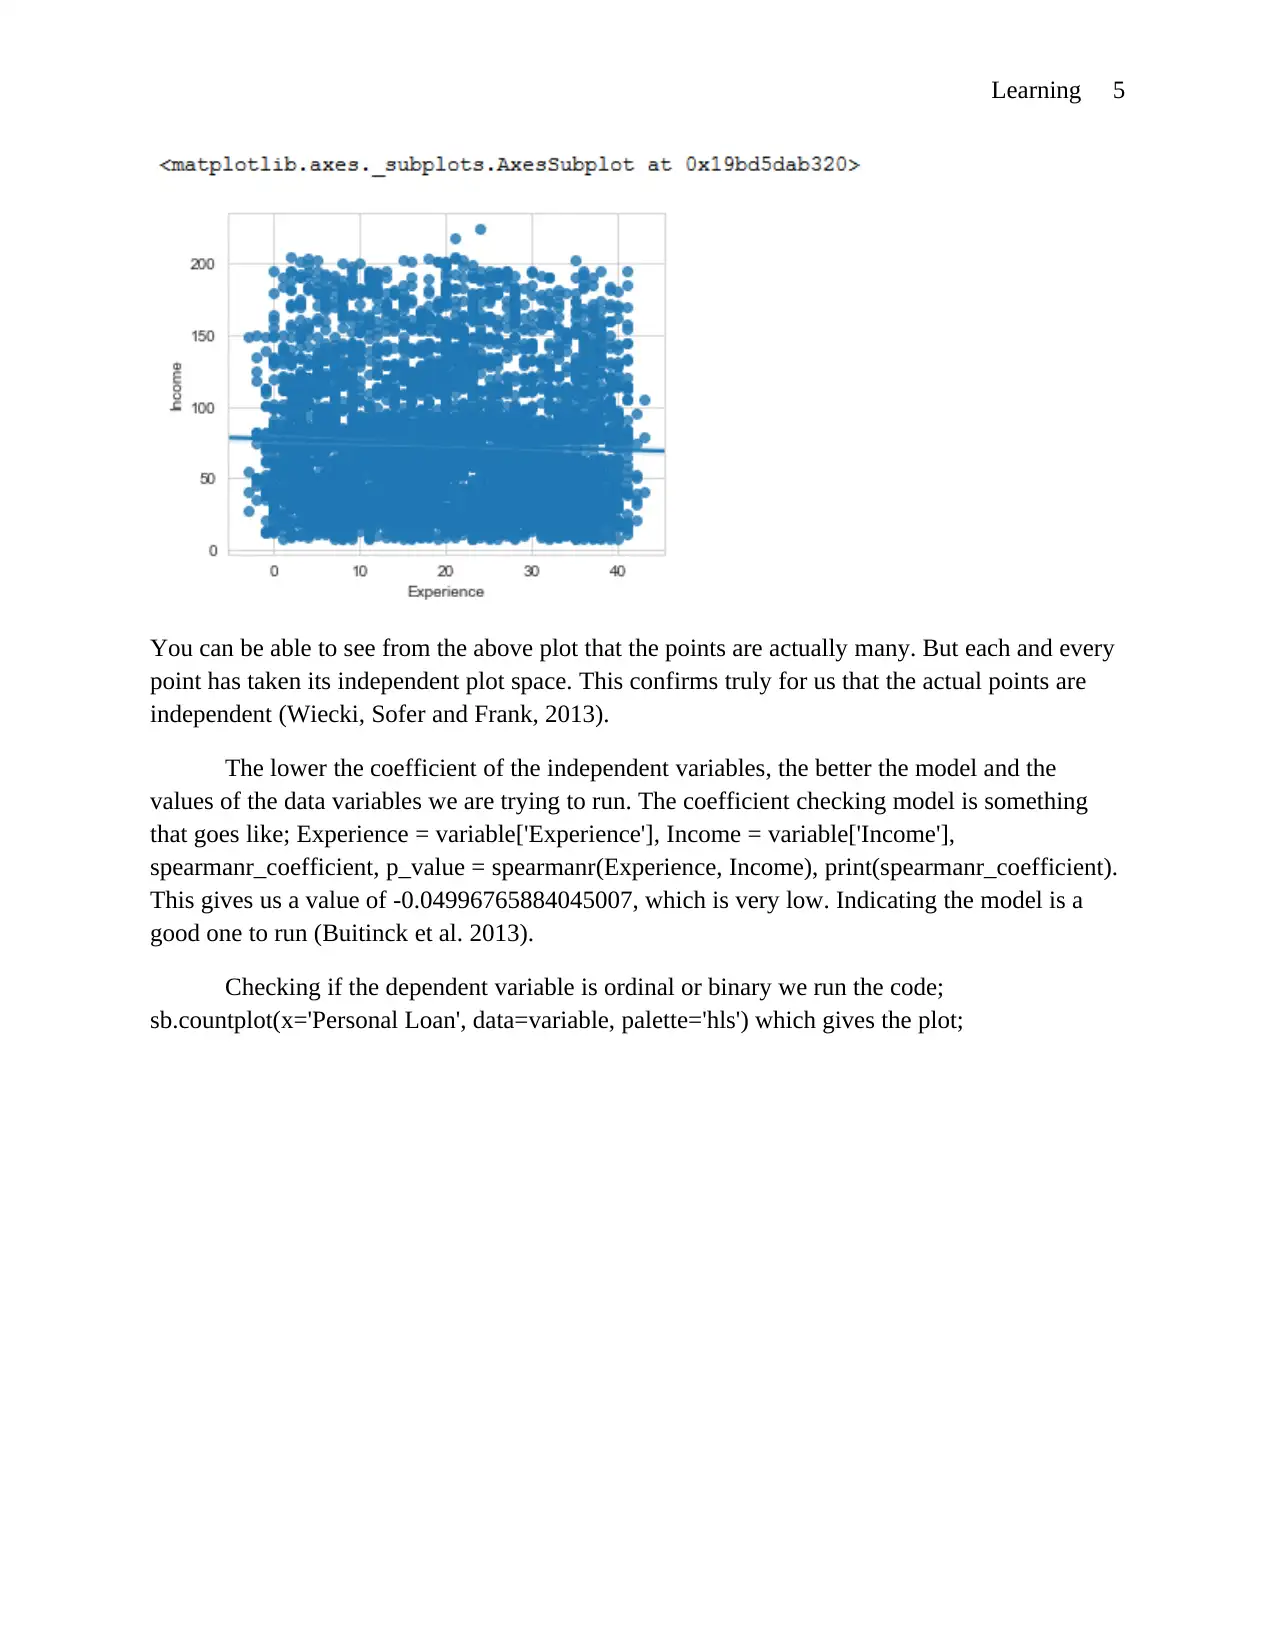
You can be able to see from the above plot that the points are actually many. But each and every
point has taken its independent plot space. This confirms truly for us that the actual points are
independent (Wiecki, Sofer and Frank, 2013).
The lower the coefficient of the independent variables, the better the model and the
values of the data variables we are trying to run. The coefficient checking model is something
that goes like; Experience = variable['Experience'], Income = variable['Income'],
spearmanr_coefficient, p_value = spearmanr(Experience, Income), print(spearmanr_coefficient).
This gives us a value of -0.04996765884045007, which is very low. Indicating the model is a
good one to run (Buitinck et al. 2013).
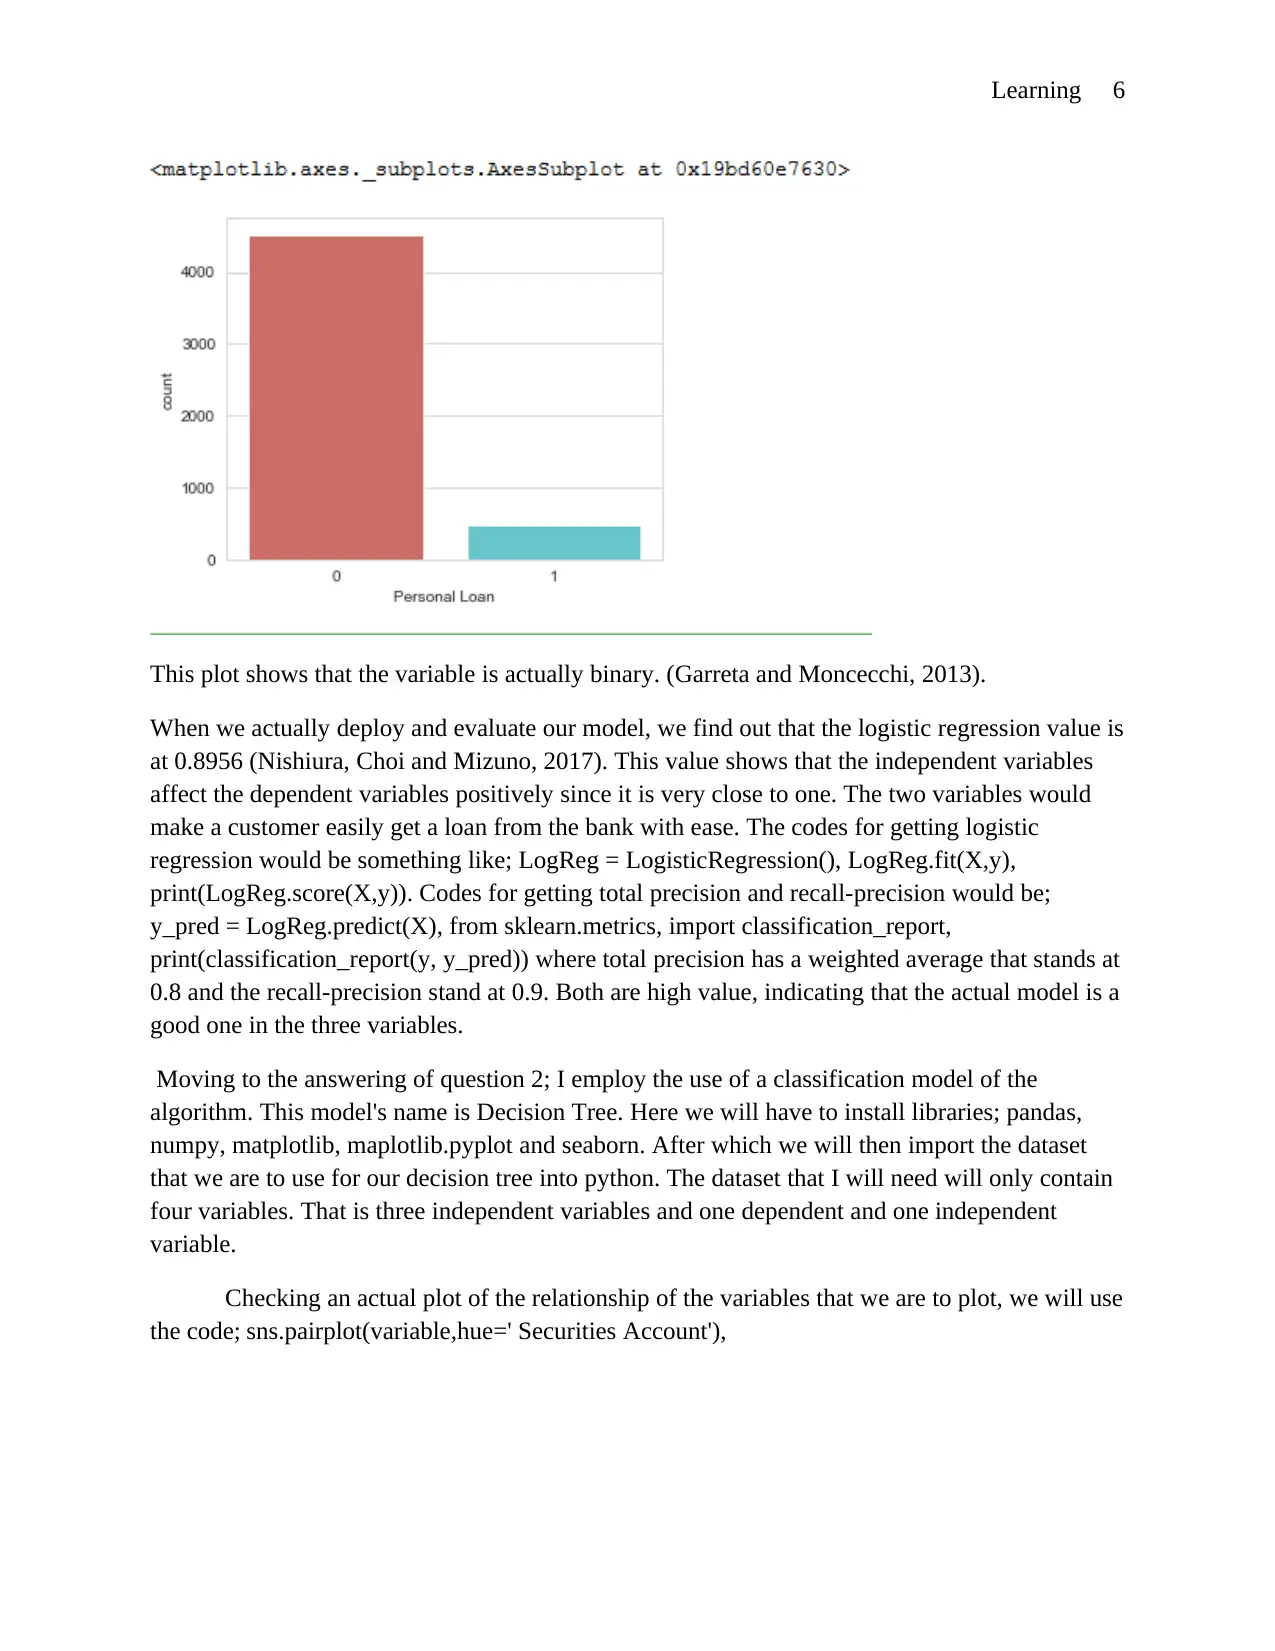
Checking if the dependent variable is ordinal or binary we run the code;
sb.countplot(x='Personal Loan', data=variable, palette='hls') which gives the plot;
You can be able to see from the above plot that the points are actually many. But each and every
point has taken its independent plot space. This confirms truly for us that the actual points are
independent (Wiecki, Sofer and Frank, 2013).
The lower the coefficient of the independent variables, the better the model and the
values of the data variables we are trying to run. The coefficient checking model is something
that goes like; Experience = variable['Experience'], Income = variable['Income'],
spearmanr_coefficient, p_value = spearmanr(Experience, Income), print(spearmanr_coefficient).
This gives us a value of -0.04996765884045007, which is very low. Indicating the model is a
good one to run (Buitinck et al. 2013).
Checking if the dependent variable is ordinal or binary we run the code;
sb.countplot(x='Personal Loan', data=variable, palette='hls') which gives the plot;
Learning 6
This plot shows that the variable is actually binary. (Garreta and Moncecchi, 2013).
When we actually deploy and evaluate our model, we find out that the logistic regression value is
at 0.8956 (Nishiura, Choi and Mizuno, 2017). This value shows that the independent variables
affect the dependent variables positively since it is very close to one. The two variables would
make a customer easily get a loan from the bank with ease. The codes for getting logistic
regression would be something like; LogReg = LogisticRegression(), LogReg.fit(X,y),
print(LogReg.score(X,y)). Codes for getting total precision and recall-precision would be;
y_pred = LogReg.predict(X), from sklearn.metrics, import classification_report,
print(classification_report(y, y_pred)) where total precision has a weighted average that stands at
0.8 and the recall-precision stand at 0.9. Both are high value, indicating that the actual model is a
good one in the three variables.
Moving to the answering of question 2; I employ the use of a classification model of the
algorithm. This model's name is Decision Tree. Here we will have to install libraries; pandas,
numpy, matplotlib, maplotlib.pyplot and seaborn. After which we will then import the dataset
that we are to use for our decision tree into python. The dataset that I will need will only contain
four variables. That is three independent variables and one dependent and one independent
variable.
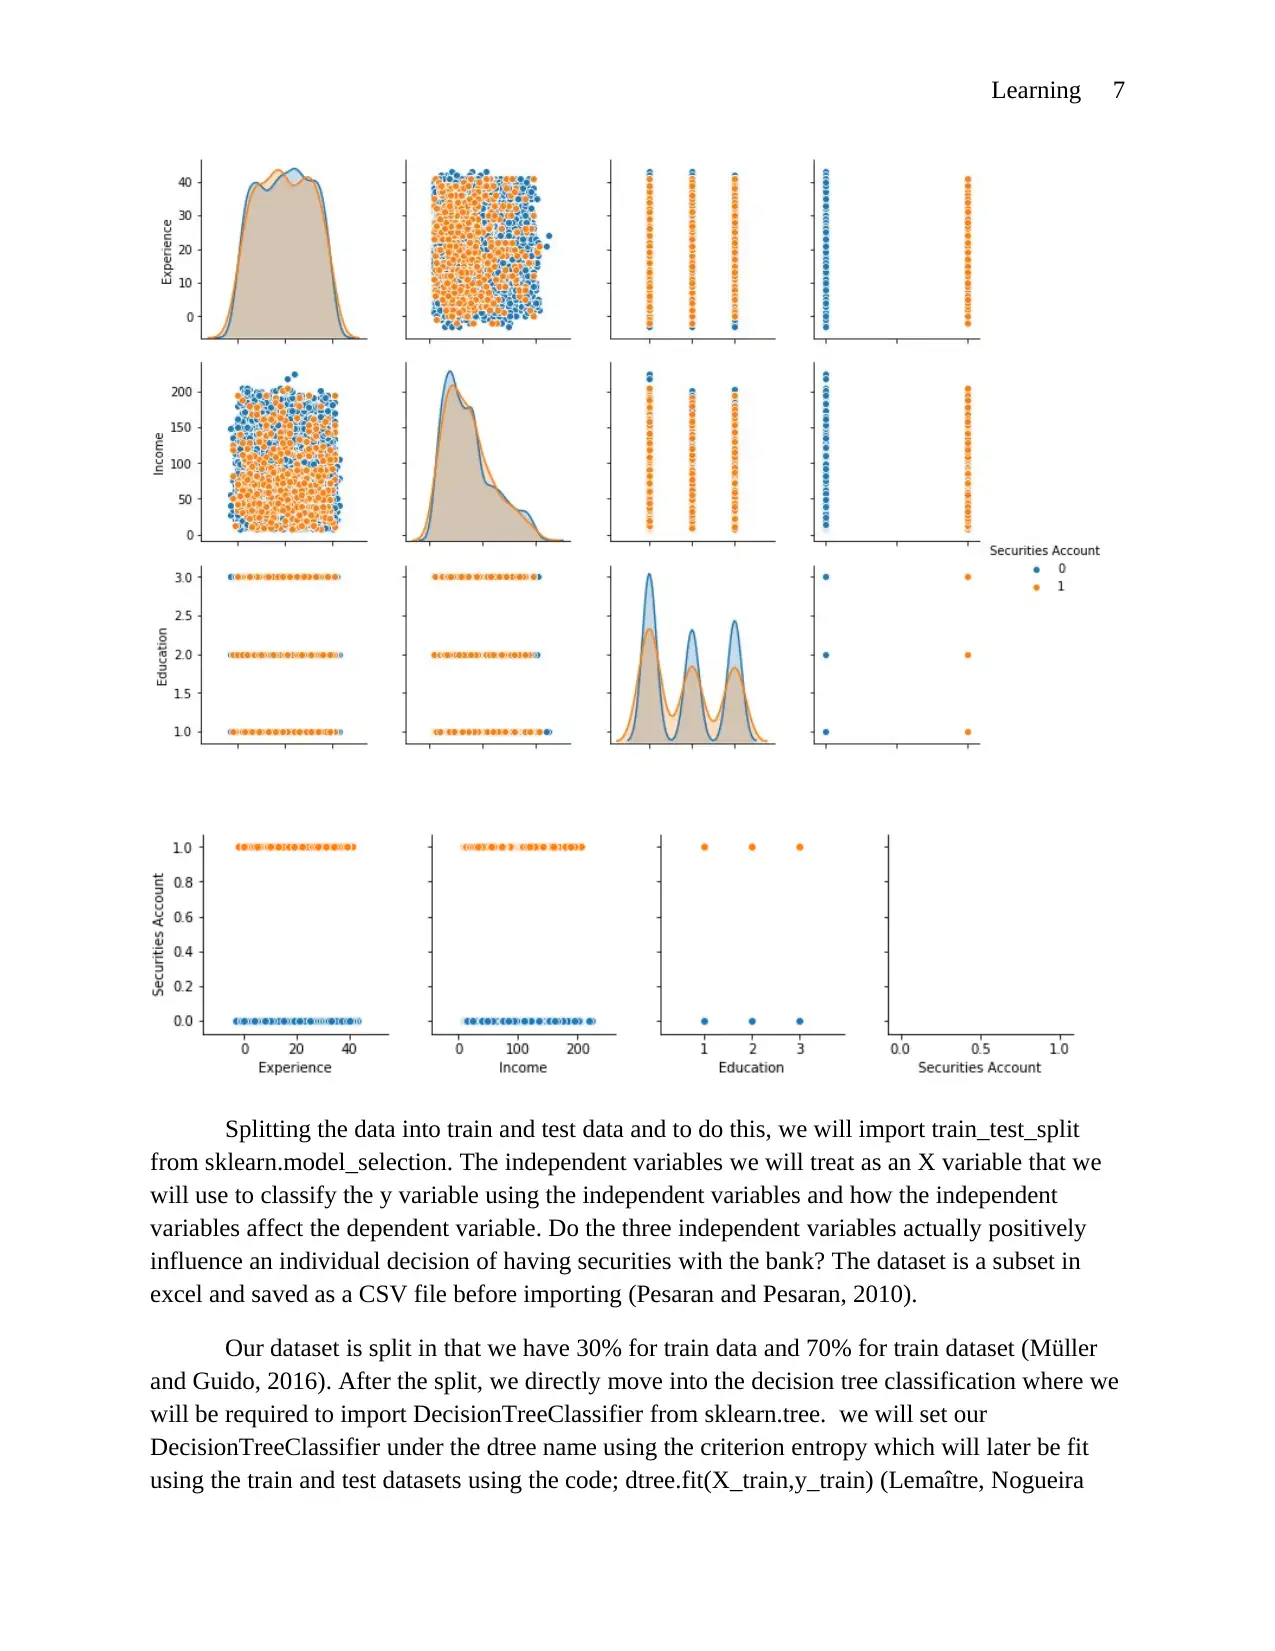
Checking an actual plot of the relationship of the variables that we are to plot, we will use
the code; sns.pairplot(variable,hue=' Securities Account'),
This plot shows that the variable is actually binary. (Garreta and Moncecchi, 2013).
When we actually deploy and evaluate our model, we find out that the logistic regression value is
at 0.8956 (Nishiura, Choi and Mizuno, 2017). This value shows that the independent variables
affect the dependent variables positively since it is very close to one. The two variables would
make a customer easily get a loan from the bank with ease. The codes for getting logistic
regression would be something like; LogReg = LogisticRegression(), LogReg.fit(X,y),
print(LogReg.score(X,y)). Codes for getting total precision and recall-precision would be;
y_pred = LogReg.predict(X), from sklearn.metrics, import classification_report,
print(classification_report(y, y_pred)) where total precision has a weighted average that stands at
0.8 and the recall-precision stand at 0.9. Both are high value, indicating that the actual model is a
good one in the three variables.
Moving to the answering of question 2; I employ the use of a classification model of the
algorithm. This model's name is Decision Tree. Here we will have to install libraries; pandas,
numpy, matplotlib, maplotlib.pyplot and seaborn. After which we will then import the dataset
that we are to use for our decision tree into python. The dataset that I will need will only contain
four variables. That is three independent variables and one dependent and one independent
variable.
Checking an actual plot of the relationship of the variables that we are to plot, we will use
the code; sns.pairplot(variable,hue=' Securities Account'),
⊘ This is a preview!⊘
Do you want full access?
Subscribe today to unlock all pages.
Trusted by 1+ million students worldwide
Learning 7
Splitting the data into train and test data and to do this, we will import train_test_split
from sklearn.model_selection. The independent variables we will treat as an X variable that we
will use to classify the y variable using the independent variables and how the independent
variables affect the dependent variable. Do the three independent variables actually positively
influence an individual decision of having securities with the bank? The dataset is a subset in
excel and saved as a CSV file before importing (Pesaran and Pesaran, 2010).
Our dataset is split in that we have 30% for train data and 70% for train dataset (Müller
and Guido, 2016). After the split, we directly move into the decision tree classification where we
will be required to import DecisionTreeClassifier from sklearn.tree. we will set our
DecisionTreeClassifier under the dtree name using the criterion entropy which will later be fit
using the train and test datasets using the code; dtree.fit(X_train,y_train) (Lemaître, Nogueira
Paraphrase This Document
Need a fresh take? Get an instant paraphrase of this document with our AI Paraphraser
Learning 8
and Aridas, 2017). Fitting the dataset will give us all the attributes of the data set as per the
decision tree.
In doing prediction and evaluation, we will need to import from sklearn,
classification_report, confusion-matrix and accuracy_score. We will do our prediction on the
variable X_test from the train and test data splits. Confusion matrix, we will get for y_test while
doing the predictions. Accuracy score too will be gotten for y_test that comes during predictions.
The confusion matrix accuracy, after writing the relevant codes of extracting them in the case
above; we get it as; 0.8246666666666667 which is high enough hence the train data used to test
all the variables classify or point out that the classification model is deemed appropriate as per
the results that are given back.
Printing the actual classification_report results, we come out with precision values and recall
values which are above 0.8 each. The precision and the recall value is this high justify the
significance of the dataset and the model itself.
When it comes to the visualization of the decision tree; we will have to import libraries;
sklearn, image from IPython, String.IO, sklearn.externals.six, graphviz from sklearn.tree. The
codes features = list(variable.columns[:3]) and features being below. When the two are run, we
will get the independent variables that we will need to use to classify the customers that their
decision to have been positively affected or negatively affected to have securities with the bank
and hence have opened securities account.
Conclusion
It is evident to see how the actual libraries installed affect the whole machine learning
model in the whole process. It is, therefore, s good practice to always import or install all the
libraries that you might need in one go before starting to run your machine learning algorithms.
But when you are running multiple algorithms on one page, you might not know which library is
needed where and that might be challenging. Looking at our machine learning model on a
decision tree, different functions require different libraries at different points. This fact made us
install them accordingly and when needed but then they worked. Therefore as a data scientist,
you will be needed to be a bit flexible because installing your libraries earlier on in the start or
installing them when needed will take you to the same direction of results.
As per the models used it is easier to predict using any what binary representation of the
dependent variable would be resulted in when the combination of independent variables are
made as per the algorithm. From here it is evident and so true to confirm what the machine
learning analogy is true. At the start of the report, we stated that machine learning is the process
by which computers and machines are set or programmed to follow certain set rules and
predictions. They monitor how functions that they are required to operate under are put and they
run that same way. Just like phones, the websites monitor what you would like to view or read

Learning 9
the most and it brings you related topics on the same. That is why machine learning is the best in
today’s world. It eases lives in many ways.
the most and it brings you related topics on the same. That is why machine learning is the best in
today’s world. It eases lives in many ways.
⊘ This is a preview!⊘
Do you want full access?
Subscribe today to unlock all pages.
Trusted by 1+ million students worldwide
Learning 10
References
Baydin, A.G., Pearlmutter, B.A., Radul, A.A. and Siskind, J.M., 2018. Automatic differentiation
in machine learning: a survey. Journal of Marchine Learning Research, 18, pp.1-43.
Buitinck, L., Louppe, G., Blondel, M., Pedregosa, F., Mueller, A., Grisel, O., Niculae, V.,
Prettenhofer, P., Gramfort, A., Grobler, J. and Layton, R., 2013. API design for machine learning
software: experiences from the scikit-learn project. arXiv preprint arXiv:1309.0238.
Donnelly, F., 2014. Processing Government Data: ZIP Codes, Python, and OpenRefine.
Garreta, R. and Moncecchi, G., 2013. Learning scikit-learn: machine learning in python. Packt
Publishing Ltd.
Howse, J., 2013. OpenCV computer vision with python. Packt Publishing Ltd.
Kuppusamy, P.G., Gopal, B.G. and Prabhu, V., 2015. Specific Absorption Rate (SAR)
Assessment and Measurement of Temperature Change On Human Head Due To Radiations by
Mobile Phone Antenna. International Journal of Applied Engineering Research, 10(16),
pp.36466-36470.
Lemaître, G., Nogueira, F. and Aridas, C.K., 2017. Imbalanced-learn: A python toolbox to tackle
the curse of imbalanced datasets in machine learning. The Journal of Machine Learning
Research, 18(1), pp.559-563.
McKinney, W., 2012. Python for data analysis: Data wrangling with Pandas, NumPy, and
IPython. " O'Reilly Media, Inc.".
Müller, A.C. and Guido, S., 2016. Introduction to machine learning with Python: a guide for
data scientists. " O'Reilly Media, Inc.".
Nishiura, K., Choi, E.H. and Mizuno, O., 2017, July. Improving faulty interaction localization
using logistic regression. In 2017 IEEE International Conference on Software Quality,
Reliability and Security (QRS) (pp. 138-149). IEEE.
Parmar, C., Grossmann, P., Bussink, J., Lambin, P. and Aerts, H.J., 2015. Machine learning
methods for quantitative radiomic biomarkers. Scientific reports, 5, p.13087.
Pesaran, B. and Pesaran, M.H., 2010. Time series econometrics using Microfit 5.0: A user's
manual. Oxford University Press, Inc..
Raschka, S., 2015. Python machine learning. Packt Publishing Ltd.
Russell, S.J. and Norvig, P., 2016. Artificial intelligence: a modern approach. Malaysia; Pearson
Education Limited,.
Paraphrase This Document
Need a fresh take? Get an instant paraphrase of this document with our AI Paraphraser
Learning 11
Schutt, R. and O'Neil, C., 2014. Doing data science: Straight talk from the frontline. O'Reilly.
Steels, L. and Brooks, R., 2018. The artificial life route to artificial intelligence: Building
embodied, situated agents. Routledge.
VanderPlas, J., 2016. Python data science handbook: essential tools for working with data. "
O'Reilly Media, Inc.".
Wiecki, T.V., Sofer, I. and Frank, M.J., 2013. HDDM: Hierarchical Bayesian estimation of the
drift-diffusion model in Python. Frontiers in neuroinformatics, 7, p.14.

Learning 12
⊘ This is a preview!⊘
Do you want full access?
Subscribe today to unlock all pages.
Trusted by 1+ million students worldwide
1 out of 13
Related Documents


Your All-in-One AI-Powered Toolkit for Academic Success.
+13062052269
info@desklib.com
Available 24*7 on WhatsApp / Email
![[object Object]](/_next/static/media/star-bottom.7253800d.svg)
Unlock your academic potential
Copyright © 2020–2026 A2Z Services. All Rights Reserved. Developed and managed by ZUCOL.