Ask a question from expert
Production and Operation Management PDF
98 Pages27558 Words364 Views
Added on 2022-01-22
Production and Operation Management PDF
Added on 2022-01-22
BookmarkShareRelated Documents
Lectures notes
On
Production and Operation
Management
Prepared by
Dr. Sarojrani Pattnaik Dr. Swagatika Mishra
Assistant Professor
Department of Mechanical Engineering
VSSUT Burla
.
On
Production and Operation
Management
Prepared by
Dr. Sarojrani Pattnaik Dr. Swagatika Mishra
Assistant Professor
Department of Mechanical Engineering
VSSUT Burla
.
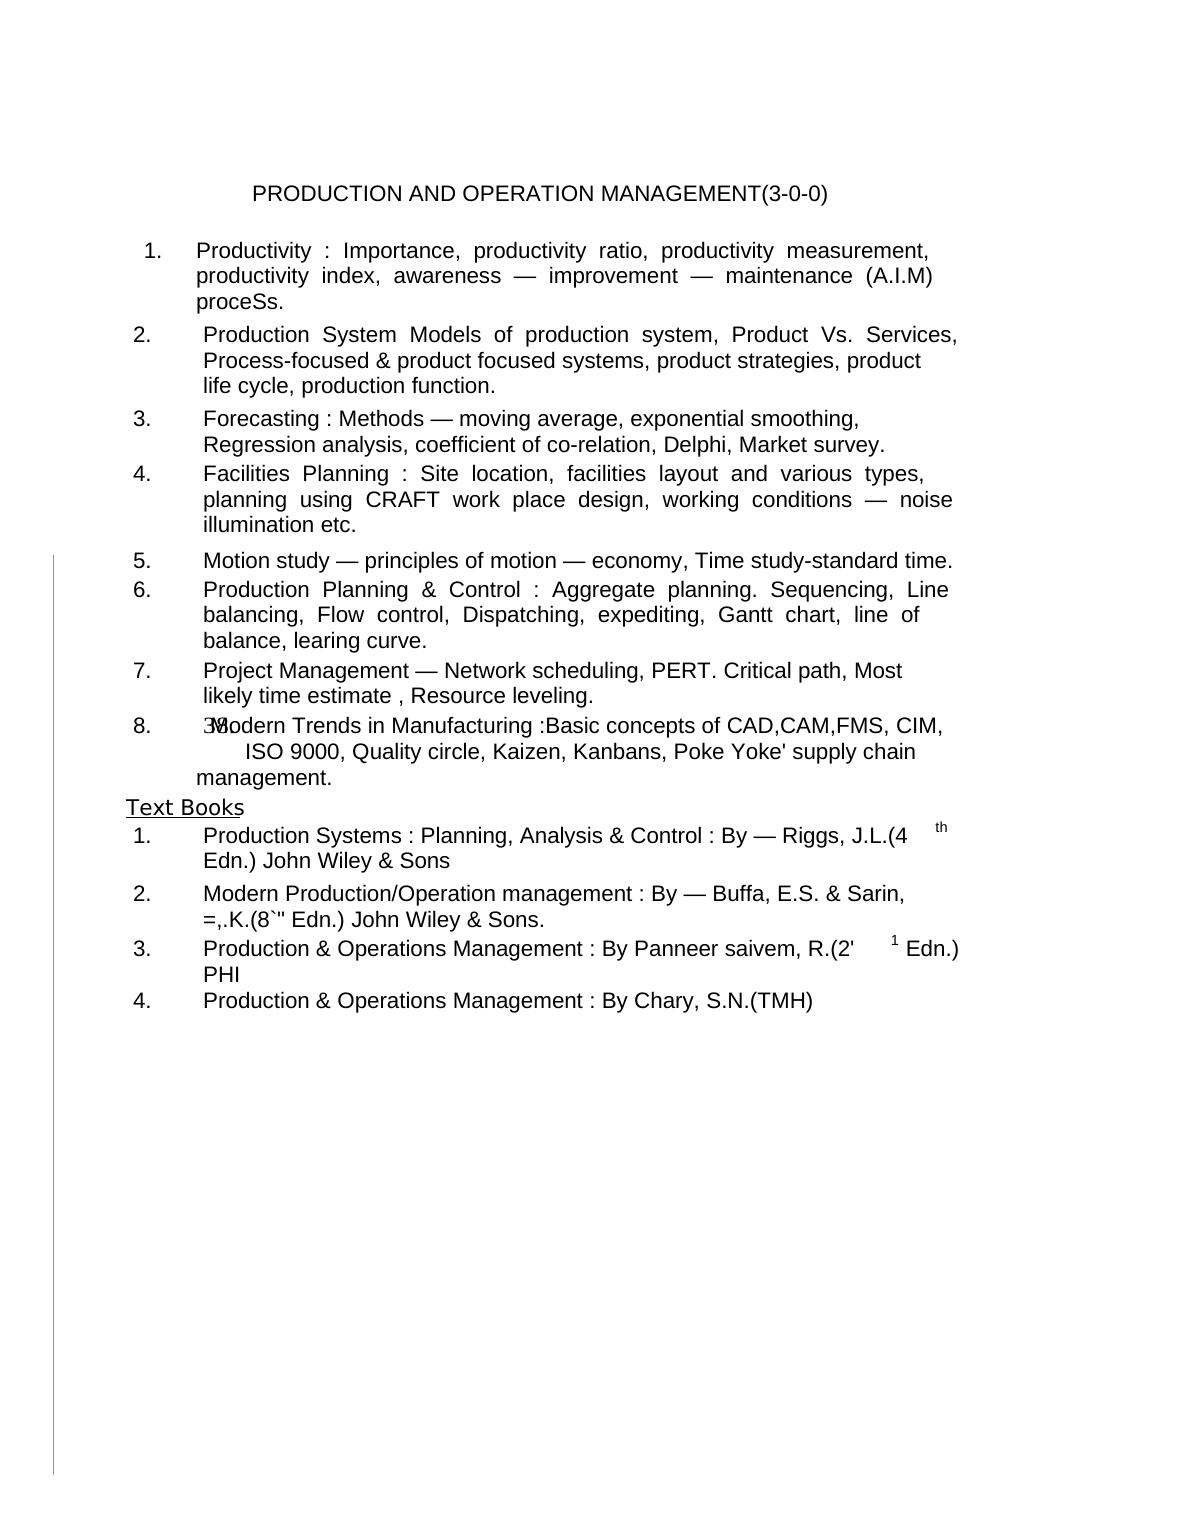
PRODUCTION AND OPERATION MANAGEMENT(3-0-0)
1. Productivity : Importance, productivity ratio, productivity measurement,
productivity index, awareness — improvement — maintenance (A.I.M)
proceSs.
2. Production System Models of production system, Product Vs. Services,
Process-focused & product focused systems, product strategies, product
life cycle, production function.
3. Forecasting : Methods — moving average, exponential smoothing,
Regression analysis, coefficient of co-relation, Delphi, Market survey.
4. Facilities Planning : Site location, facilities layout and various types,
planning using CRAFT work place design, working conditions — noise
illumination etc.
5. Motion study — principles of motion — economy, Time study-standard time.
6. Production Planning & Control : Aggregate planning. Sequencing, Line
balancing, Flow control, Dispatching, expediting, Gantt chart, line of
balance, learing curve.
7. Project Management — Network scheduling, PERT. Critical path, Most
likely time estimate , Resource leveling.
8. 38.Modern Trends in Manufacturing :Basic concepts of CAD,CAM,FMS, CIM,
ISO 9000, Quality circle, Kaizen, Kanbans, Poke Yoke' supply chain
management.
Text Books
1. Production Systems : Planning, Analysis & Control : By — Riggs, J.L.(4th
Edn.) John Wiley & Sons
2. Modern Production/Operation management : By — Buffa, E.S. & Sarin,
=,.K.(8`" Edn.) John Wiley & Sons.
3. Production & Operations Management : By Panneer saivem, R.(2'1 Edn.)
PHI
4. Production & Operations Managem ent : By Chary, S.N.(TMH)
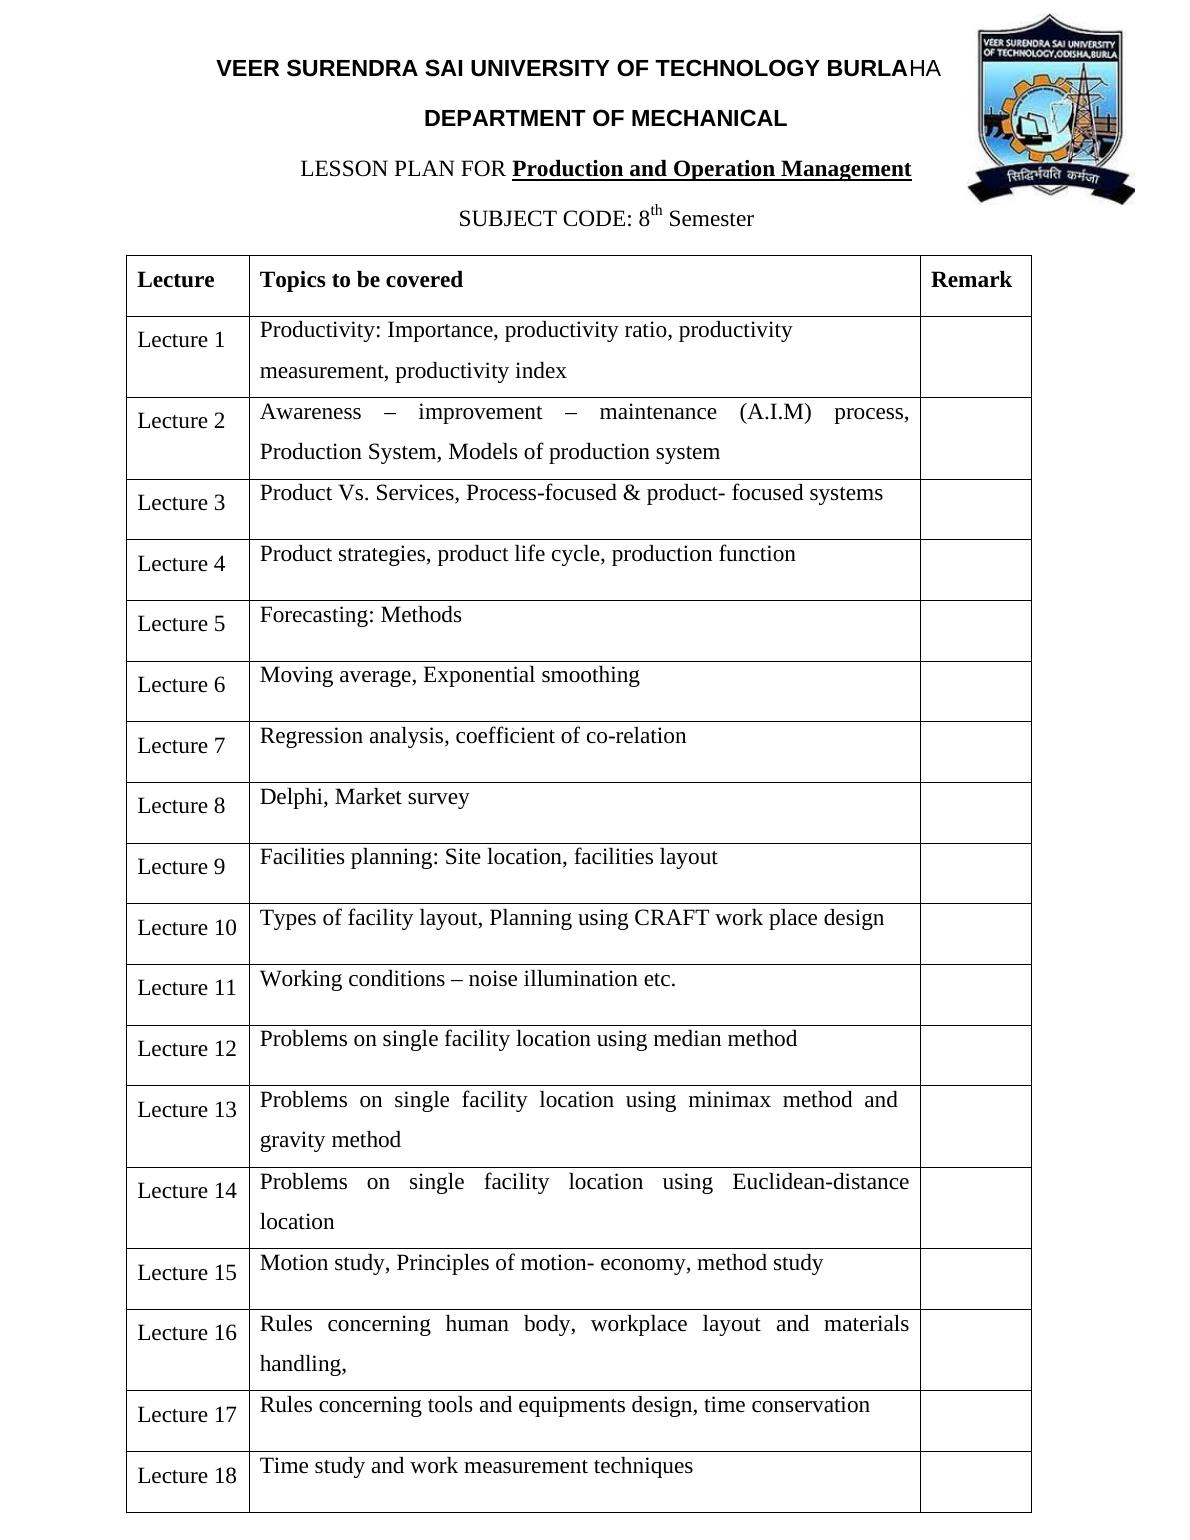
VEER SURENDRA SAI UNIVERSITY OF TECHNOLOGY BURLAHA
DEPARTMENT OF MECHANICAL
LESSON PLAN FOR Production and Operation Management
SUBJECT CODE: 8th Semester
Lecture Topics to be covered Remark
Lecture 1 Productivity: Importance, productivity ratio, productivity
measurement, productivity index
Lecture 2 Awareness – improvement – maintenance (A.I.M) process,
Production System, Models of production system
Lecture 3 Product Vs. Services, Process-focused & product- focused systems
Lecture 4 Product strategies, product life cycle, production function
Lecture 5 Forecasting: Methods
Lecture 6 Moving average, Exponential smoothing
Lecture 7 Regression analysis, coefficient of co-relation
Lecture 8 Delphi, Market survey
Lecture 9 Facilities planning: Site location, facilities layout
Lecture 10 Types of facility layout, Planning using CRAFT work place design
Lecture 11 Working conditions – noise illumination etc.
Lecture 12 Problems on single facility location using median method
Lecture 13 Problems on single facility location using minimax method and
gravity method
Lecture 14 Problems on single facility location using Euclidean-distance
location
Lecture 15 Motion study, Principles of motion- economy, method study
Lecture 16 Rules concerning human body, workplace layout and materials
handling,
Lecture 17 Rules concerning tools and equipments design, time conservation
Lecture 18 Time study and work measurement techniques
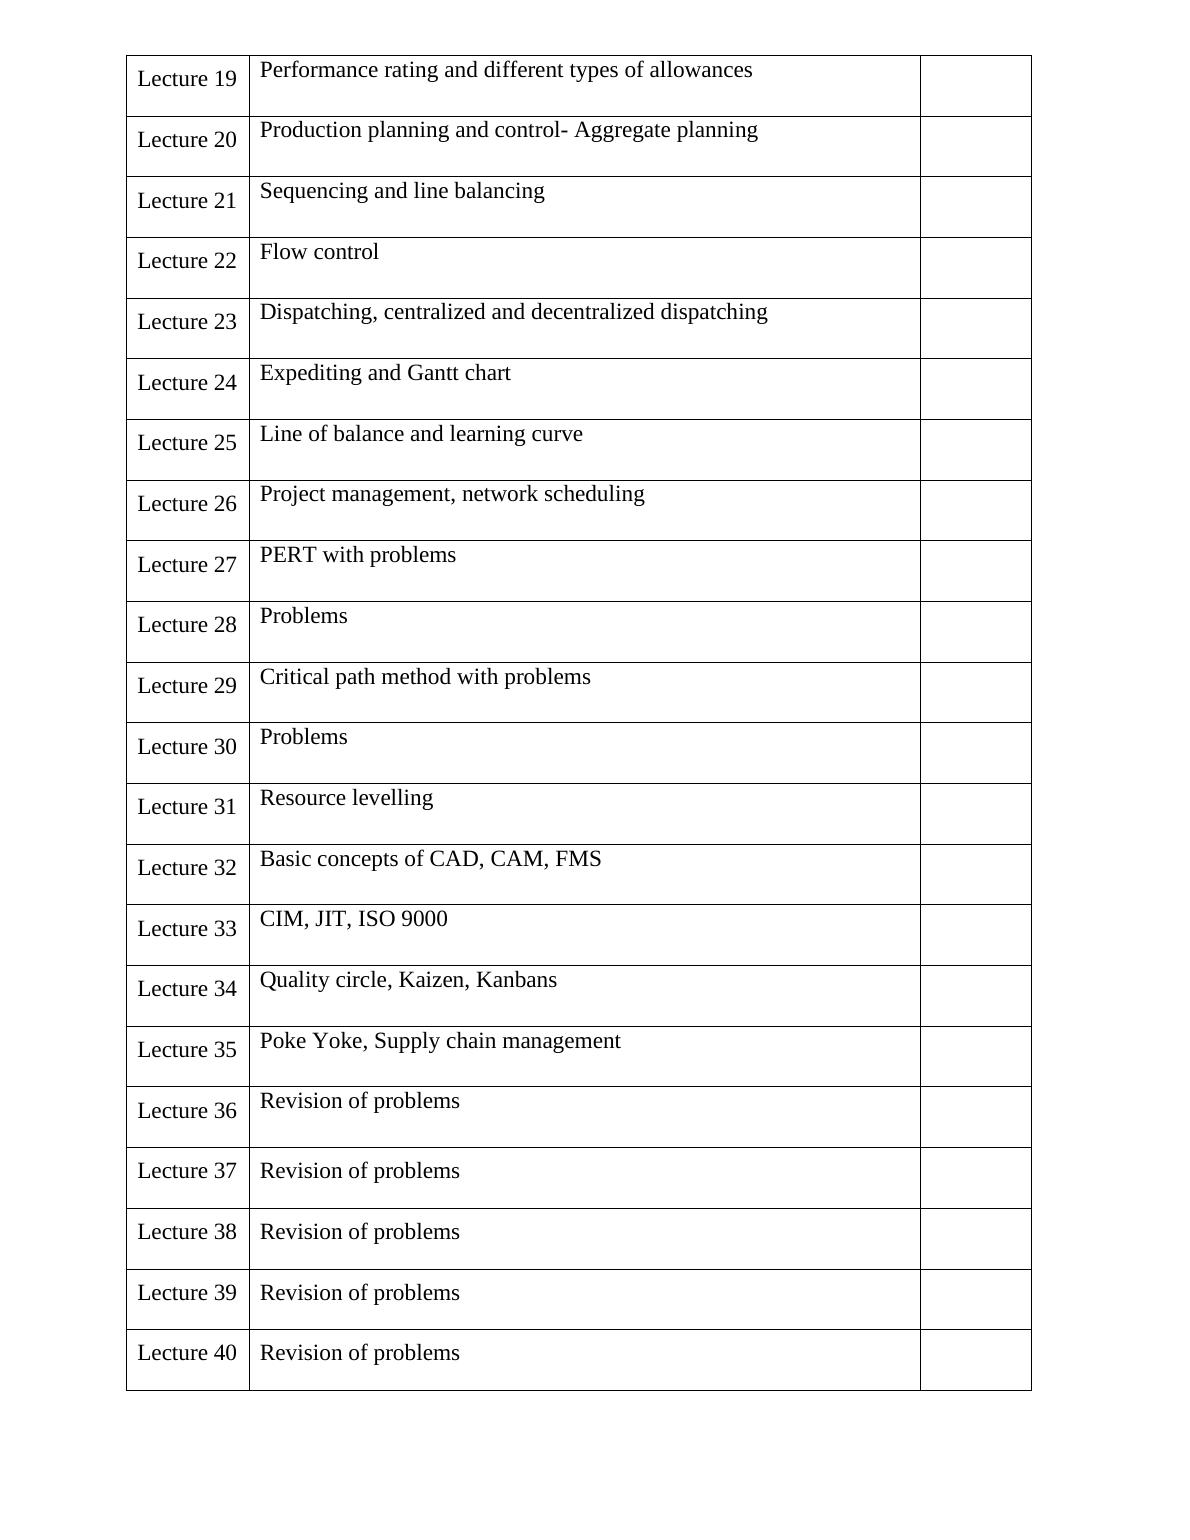
Lecture 19 Performance rating and different types of allowances
Lecture 20 Production planning and control- Aggregate planning
Lecture 21 Sequencing and line balancing
Lecture 22 Flow control
Lecture 23 Dispatching, centralized and decentralized dispatching
Lecture 24 Expediting and Gantt chart
Lecture 25 Line of balance and learning curve
Lecture 26 Project management, network scheduling
Lecture 27 PERT with problems
Lecture 28 Problems
Lecture 29 Critical path method with problems
Lecture 30 Problems
Lecture 31 Resource levelling
Lecture 32 Basic concepts of CAD, CAM, FMS
Lecture 33 CIM, JIT, ISO 9000
Lecture 34 Quality circle, Kaizen, Kanbans
Lecture 35 Poke Yoke, Supply chain management
Lecture 36 Revision of problems
Lecture 37 Revision of problems
Lecture 38 Revision of problems
Lecture 39 Revision of problems
Lecture 40 Revision of problems
CHAPTER-I
PRODUCTIVITY
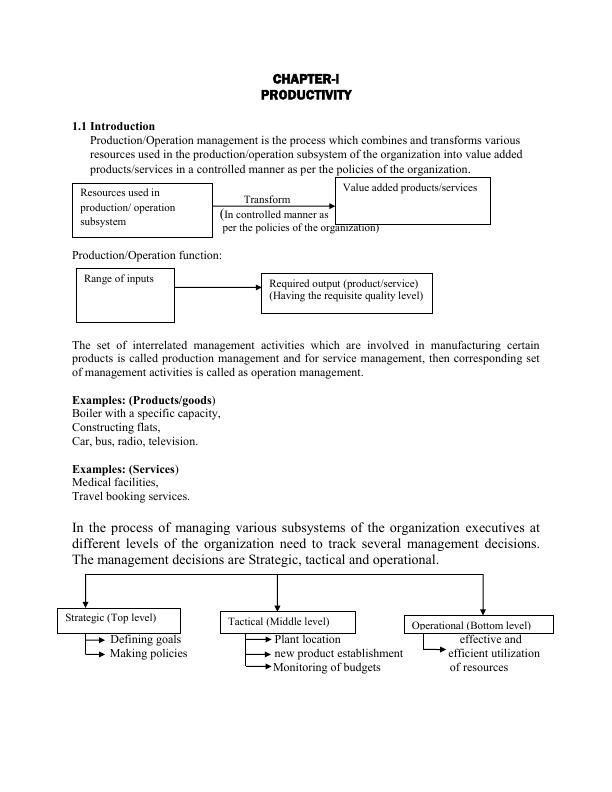
1.1 Introduction
Production/Operation management is the process which combines and transforms various
resources used in the production/operation subsystem of the organization into value added
products/services in a controlled manner as per the policies of the organization.
Transform
(In controlled manner as
per the policies of the organization)
Production/Operation function:
The set of interrelated management activities which are involved in manufacturing certain
products is called production management and for service management, then corresponding set
of management activities is called as operation management.
Examples: (Products/goods)
Boiler with a specific capacity,
Constructing flats,
Car, bus, radio, television.
Examples: (Services)
Medical facilities,
Travel booking services.
In the process of managing various subsystems of the organization executives at
different levels of the organization need to track several management decisions.
The management decisions are Strategic, tactical and operational.
Defining goals Plant location effective and
Making policies new product establishment efficient utilization
Monitoring of budgets of resources
Resources used in
production/ operation
subsystem
Value added products/services
Range of inputs Required output (product/service)
(Having the requisite quality level)
Strategic (Top level) Tactical (Middle level) Operational (Bottom level)
PRODUCTIVITY
1.1 Introduction
Production/Operation management is the process which combines and transforms various
resources used in the production/operation subsystem of the organization into value added
products/services in a controlled manner as per the policies of the organization.
Transform
(In controlled manner as
per the policies of the organization)
Production/Operation function:
The set of interrelated management activities which are involved in manufacturing certain
products is called production management and for service management, then corresponding set
of management activities is called as operation management.
Examples: (Products/goods)
Boiler with a specific capacity,
Constructing flats,
Car, bus, radio, television.
Examples: (Services)
Medical facilities,
Travel booking services.
In the process of managing various subsystems of the organization executives at
different levels of the organization need to track several management decisions.
The management decisions are Strategic, tactical and operational.
Defining goals Plant location effective and
Making policies new product establishment efficient utilization
Monitoring of budgets of resources
Resources used in
production/ operation
subsystem
Value added products/services
Range of inputs Required output (product/service)
(Having the requisite quality level)
Strategic (Top level) Tactical (Middle level) Operational (Bottom level)
2
Corrections from feedback information:
Tight quality check on the incoming raw-material.
Adjustment of machine settings.
Change of tools.
Proper allocation of operations to machines with matching skills.
Change in the production plans.
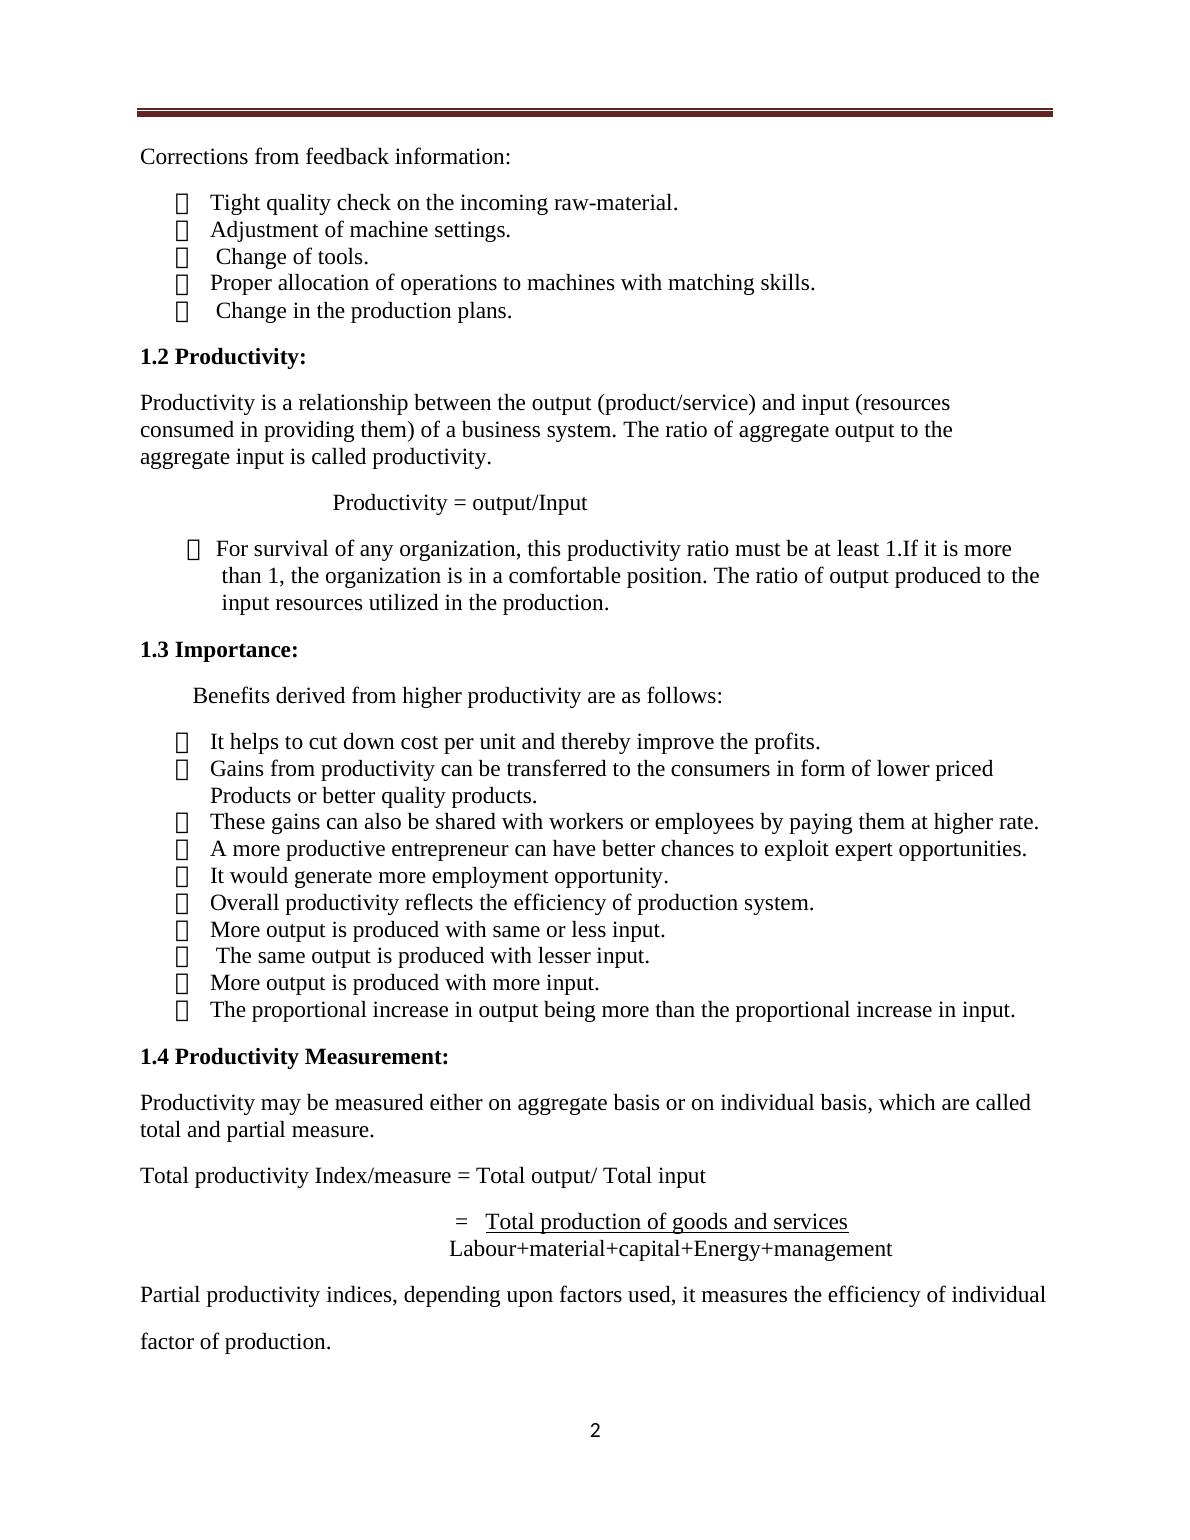
1.2 Productivity:
Productivity is a relationship between the output (product/service) and input (resources
consumed in providing them) of a business system. The ratio of aggregate output to the
aggregate input is called productivity.
Productivity = output/Input
For survival of any organization, this productivity ratio must be at least 1.If it is more
than 1, the organization is in a comfortable position. The ratio of output produced to the
input resources utilized in the production.
1.3 Importance:
Benefits derived from higher productivity are as follows:
It helps to cut down cost per unit and thereby improve the profits.
Gains from productivity can be transferred to the consumers in form of lower priced
Products or better quality products.
These gains can also be shared with workers or employees by paying them at higher rate.
A more productive entrepreneur can have better chances to exploit expert opportunities.
It would generate more employment opportunity.
Overall productivity reflects the efficiency of production system.
More output is produced with same or less input.
The same output is produced with lesser input.
More output is produced with more input.
The proportional increase in output being more than the proportional increase in input.
1.4 Productivity Measurement:
Productivity may be measured either on aggregate basis or on individual basis, which are called
total and partial measure.
Total productivity Index/measure = Total output/ Total input
= Total production of goods and services
Labour+material+capital+Energy+management
Partial productivity indices, depending upon factors used, it measures the efficiency of individual
factor of production.
Corrections from feedback information:
Tight quality check on the incoming raw-material.
Adjustment of machine settings.
Change of tools.
Proper allocation of operations to machines with matching skills.
Change in the production plans.
1.2 Productivity:
Productivity is a relationship between the output (product/service) and input (resources
consumed in providing them) of a business system. The ratio of aggregate output to the
aggregate input is called productivity.
Productivity = output/Input
For survival of any organization, this productivity ratio must be at least 1.If it is more
than 1, the organization is in a comfortable position. The ratio of output produced to the
input resources utilized in the production.
1.3 Importance:
Benefits derived from higher productivity are as follows:
It helps to cut down cost per unit and thereby improve the profits.
Gains from productivity can be transferred to the consumers in form of lower priced
Products or better quality products.
These gains can also be shared with workers or employees by paying them at higher rate.
A more productive entrepreneur can have better chances to exploit expert opportunities.
It would generate more employment opportunity.
Overall productivity reflects the efficiency of production system.
More output is produced with same or less input.
The same output is produced with lesser input.
More output is produced with more input.
The proportional increase in output being more than the proportional increase in input.
1.4 Productivity Measurement:
Productivity may be measured either on aggregate basis or on individual basis, which are called
total and partial measure.
Total productivity Index/measure = Total output/ Total input
= Total production of goods and services
Labour+material+capital+Energy+management
Partial productivity indices, depending upon factors used, it measures the efficiency of individual
factor of production.
3
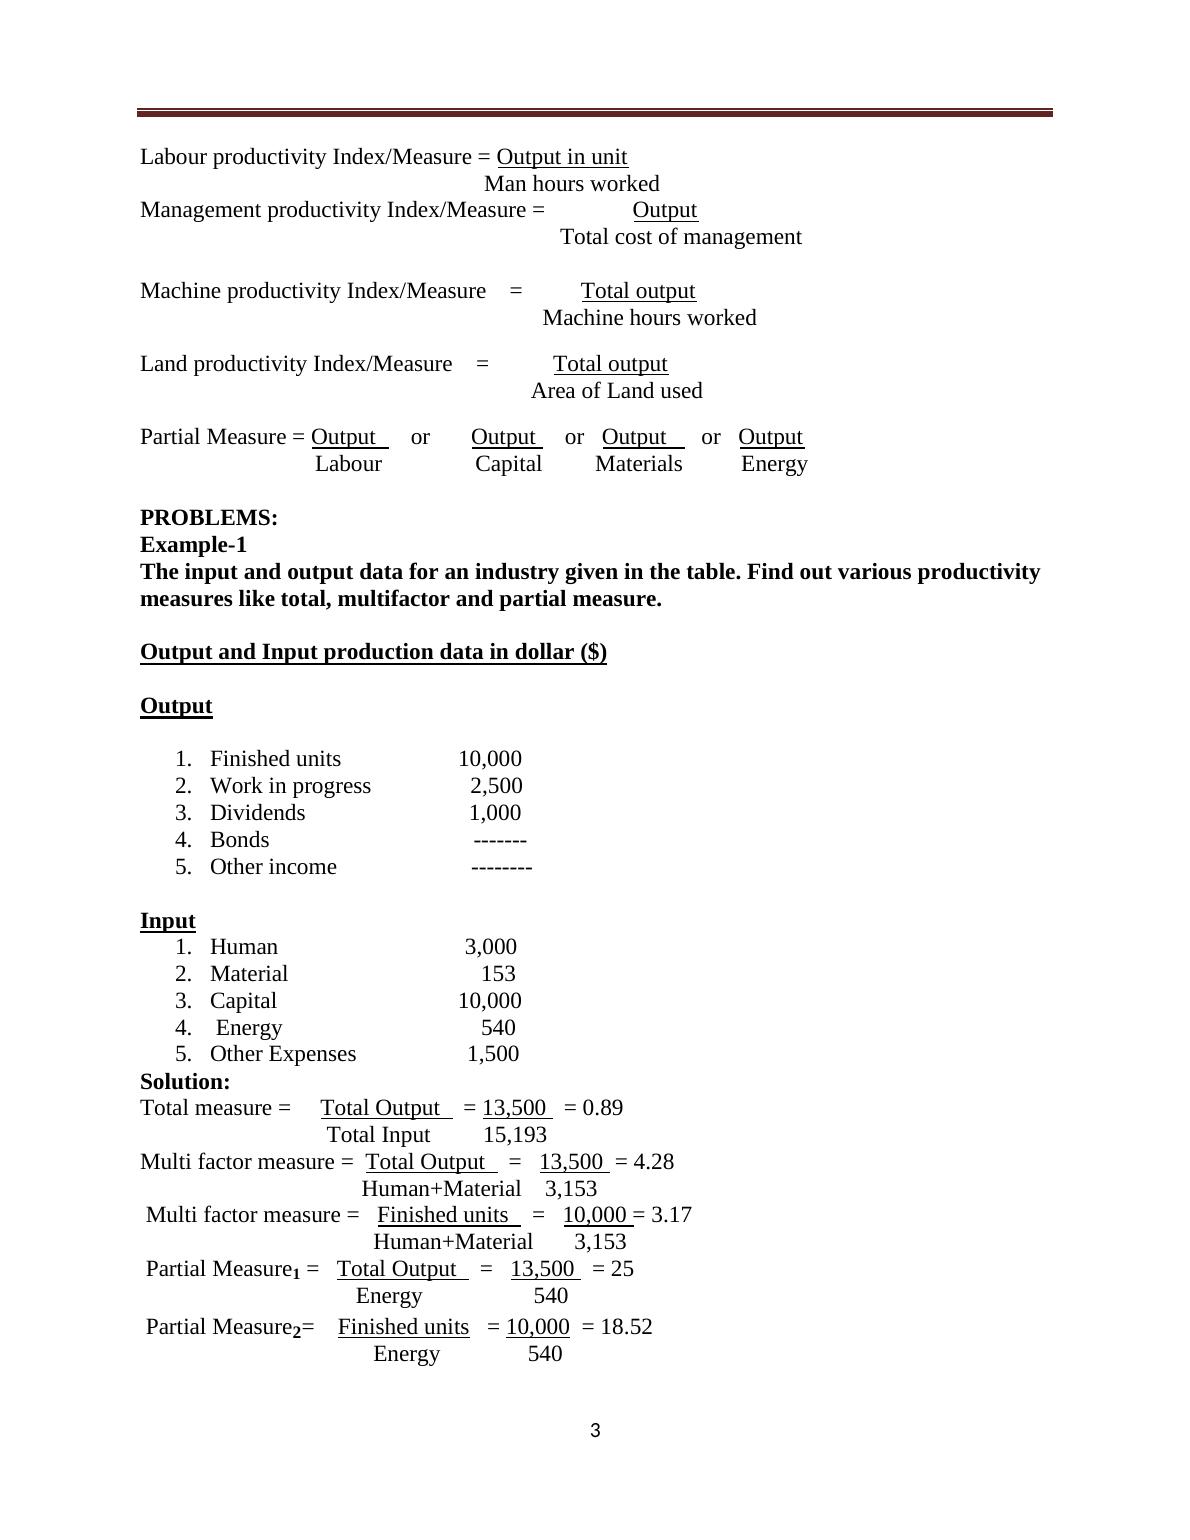
Labour productivity Index/Measure = Output in unit
Man hours worked
Management productivity Index/Measure = Output
Total cost of management
Machine productivity Index/Measure = Total output
Machine hours worked
Land productivity Index/Measure = Total output
Area of Land used
Partial Measure = Output or Output or Output or Output
Labour Capital Materials Energy
PROBLEMS:
Example-1
The input and output data for an industry given in the table. Find out various productivity
measures like total, multifactor and partial measure.
Output and Input production data in dollar ($)
Output
1. Finished units 10,000
2. Work in progress 2,500
3. Dividends 1,000
4. Bonds -------
5. Other income --------
Input
1. Human 3,000
2. Material 153
3. Capital 10,000
4. Energy 540
5. Other Expenses 1,500
Solution:
Total measure = Total Output = 13,500 = 0.89
Total Input 15,193
Multi factor measure = Total Output = 13,500 = 4.28
Human+Material 3,153
Multi factor measure = Finished units = 10,000 = 3.17
Human+Material 3,153
Partial Measure1 = Total Output = 13,500 = 25
Energy 540
Partial Measure2= Finished units = 10,000 = 18.52
Energy 540
4
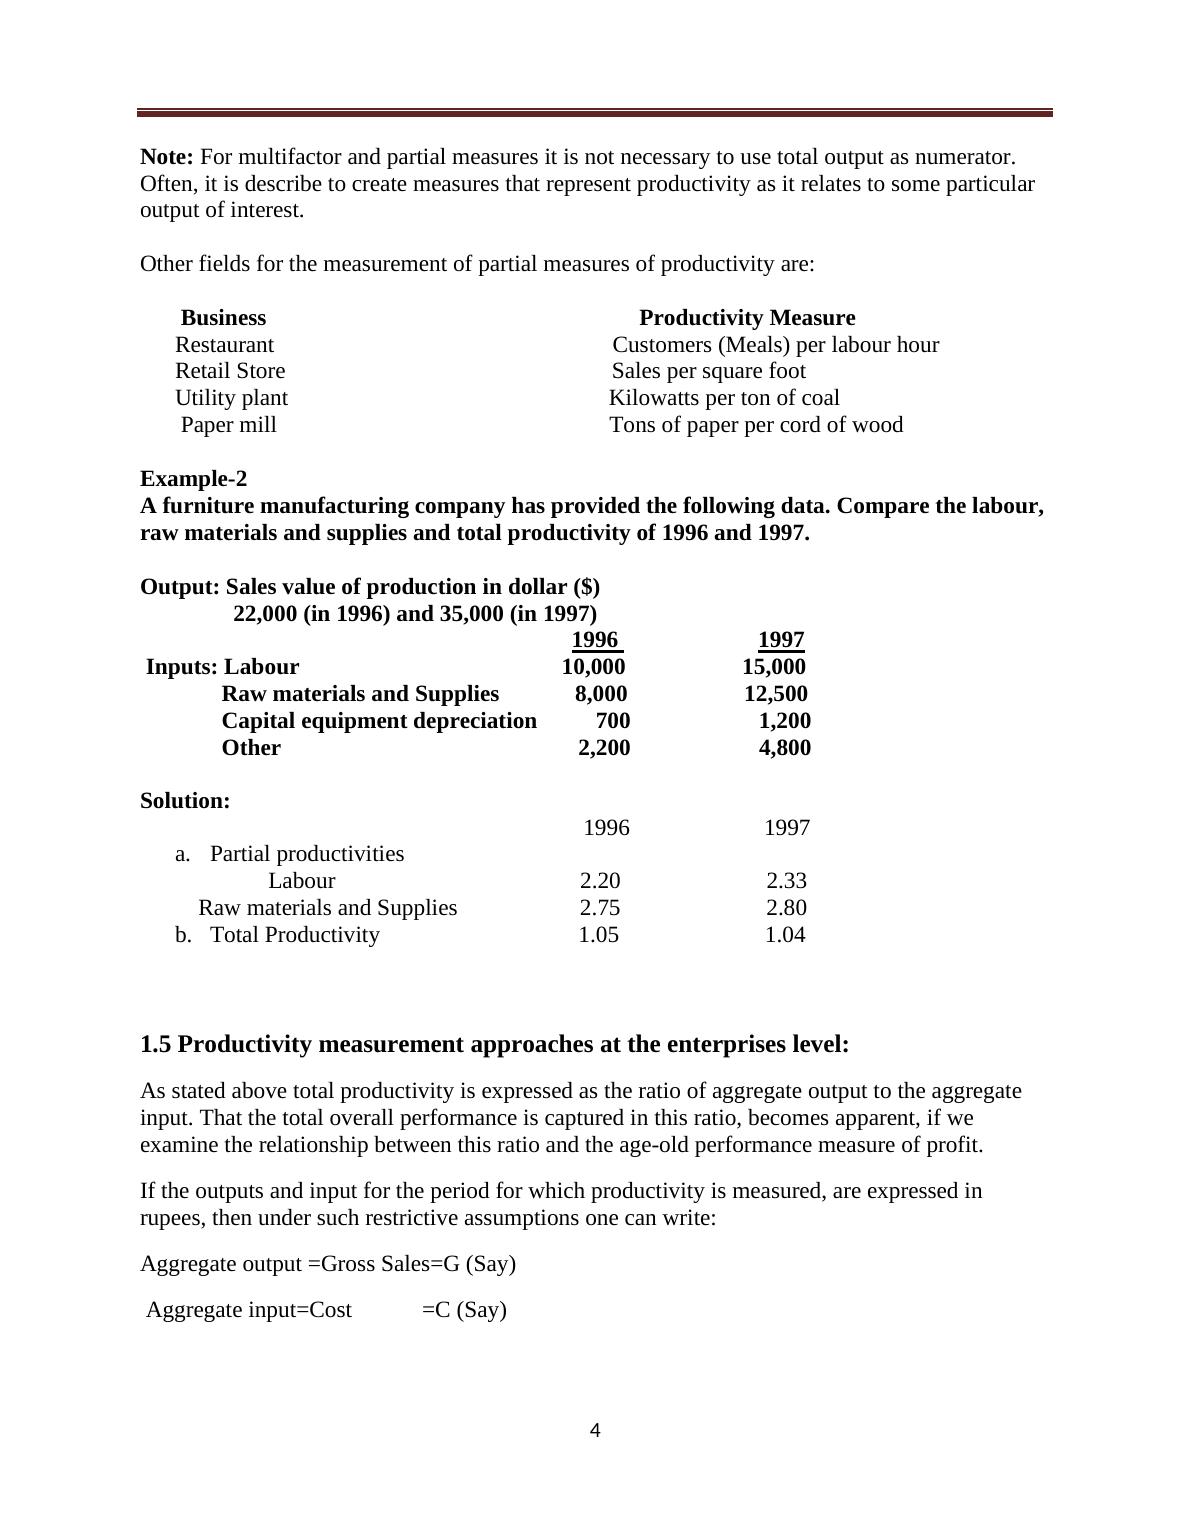
Note: For multifactor and partial measures it is not necessary to use total output as numerator.
Often, it is describe to create measures that represent productivity as it relates to some particular
output of interest.
Other fields for the measurement of partial measures of productivity are:
Business Productivity Measure
Restaurant Customers (Meals) per labour hour
Retail Store Sales per square foot
Utility plant Kilowatts per ton of coal
Paper mill Tons of paper per cord of wood
Example-2
A furniture manufacturing company has provided the following data. Compare the labour,
raw materials and supplies and total productivity of 1996 and 1997.
Output: Sales value of production in dollar ($)
22,000 (in 1996) and 35,000 (in 1997)
1996 1997
Inputs: Labour 10,000 15,000
Raw materials and Supplies 8,000 12,500
Capital equipment depreciation 700 1,200
Other 2,200 4,800
Solution:
1996 1997
a. Partial productivities
Labour 2.20 2.33
Raw materials and Supplies 2.75 2.80
b. Total Productivity 1.05 1.04
1.5 Productivity measurement approaches at the enterprises level:
As stated above total productivity is expressed as the ratio of aggregate output to the aggregate
input. That the total overall performance is captured in this ratio, becomes apparent, if we
examine the relationship between this ratio and the age-old performance measure of profit.
If the outputs and input for the period for which productivity is measured, are expressed in
rupees, then under such restrictive assumptions one can write:
Aggregate output =Gross Sales=G (Say)
Aggregate input=Cost =C (Say)
End of preview
Want to access all the pages? Upload your documents or become a member.
Related Documents
Operations Management Systems: Pre-lecture Questionslg...
|19
|4994
|233