Comparative Analysis of Life Expectancy and Age-Friendly Communities
VerifiedAdded on 2021/10/13
|11
|2892
|129
Report
AI Summary
This report provides a detailed analysis of life expectancy, comparing New Zealand and Japan. It explores factors influencing longevity, including demographic data, mortality rates from various diseases (cancer, heart disease, and cerebrovascular disease), and the impact of gender. The report highlights differences in life expectancy between the two countries and within New Zealand's population (Maori vs. non-Maori). It then offers recommendations to improve life expectancy in New Zealand, such as adopting healthier diets, reducing healthcare costs for the elderly, and implementing stricter regulations on smoking. The report also defines and compares age-friendly communities and healthy aging strategies, emphasizing their importance in maintaining independence, functionality, and health for older adults, and the benefits of creating communities that address pollution, crime, and offer cultural and educational programs. The report concludes by highlighting the importance of empowering the elderly in social, economic, and civic decisions.

Paraphrase This Document
Need a fresh take? Get an instant paraphrase of this document with our AI Paraphraser
LIFE EXPECTANCY
Part 1.1 Life expectancy
Life expectancy is a measure of the average time in which an individual, a human is
supposed to live. Life expectancy is based on factors that include; the year of birth of the
individual, current age of the individual and other demographic factors that include gender. In
New Zealand, life expectancy is completed through life tables. The tables are achieved by
recording living residents and recording the number of deaths in the country (Sandiford,
Consuelo & Rouse, 2017). The total life expectancy of New Zealand with all factors kept
constant was 81.46 years in 2015. In the year 2016, there was an increase to 81.61. There is a
continuing slow increase in life expectancy in New Zealand. However, compared to Japan, life
expectancy is still lower (Duggan, 2017). Japan recorded a life expectancy of about 84.2 years
(Wang et.al 2017)
Variations between New Zealand and Japan life expectancy were also recorded in gender.
In New Zealand in 2016, the life expectancy of males was 80.5 years. Their female counterparts
had a higher life expectancy of 84.2 years, whereas that year in Japan, male life expectancy was
81.1years while that of their female counterparts was at 87.1 years according to New Zealand
Health Ministry 2016 report and data from World health organization chronic illness report of
2017. The similarity in both countries is that the life expectancy of females is higher than that of
the males. The causes of death in both countries vary. Diseases that cause the highest death rates
in New Zealand includes; stroke, CHD, trachea bronchus, and lung cancer, ischemic heart
disease as well as cerebral and cardiovascular disease. These death rates regarding statistics were
recorded at 7.98%, 10.3% 30.02%, 17.8%, and 8.8% respectively.
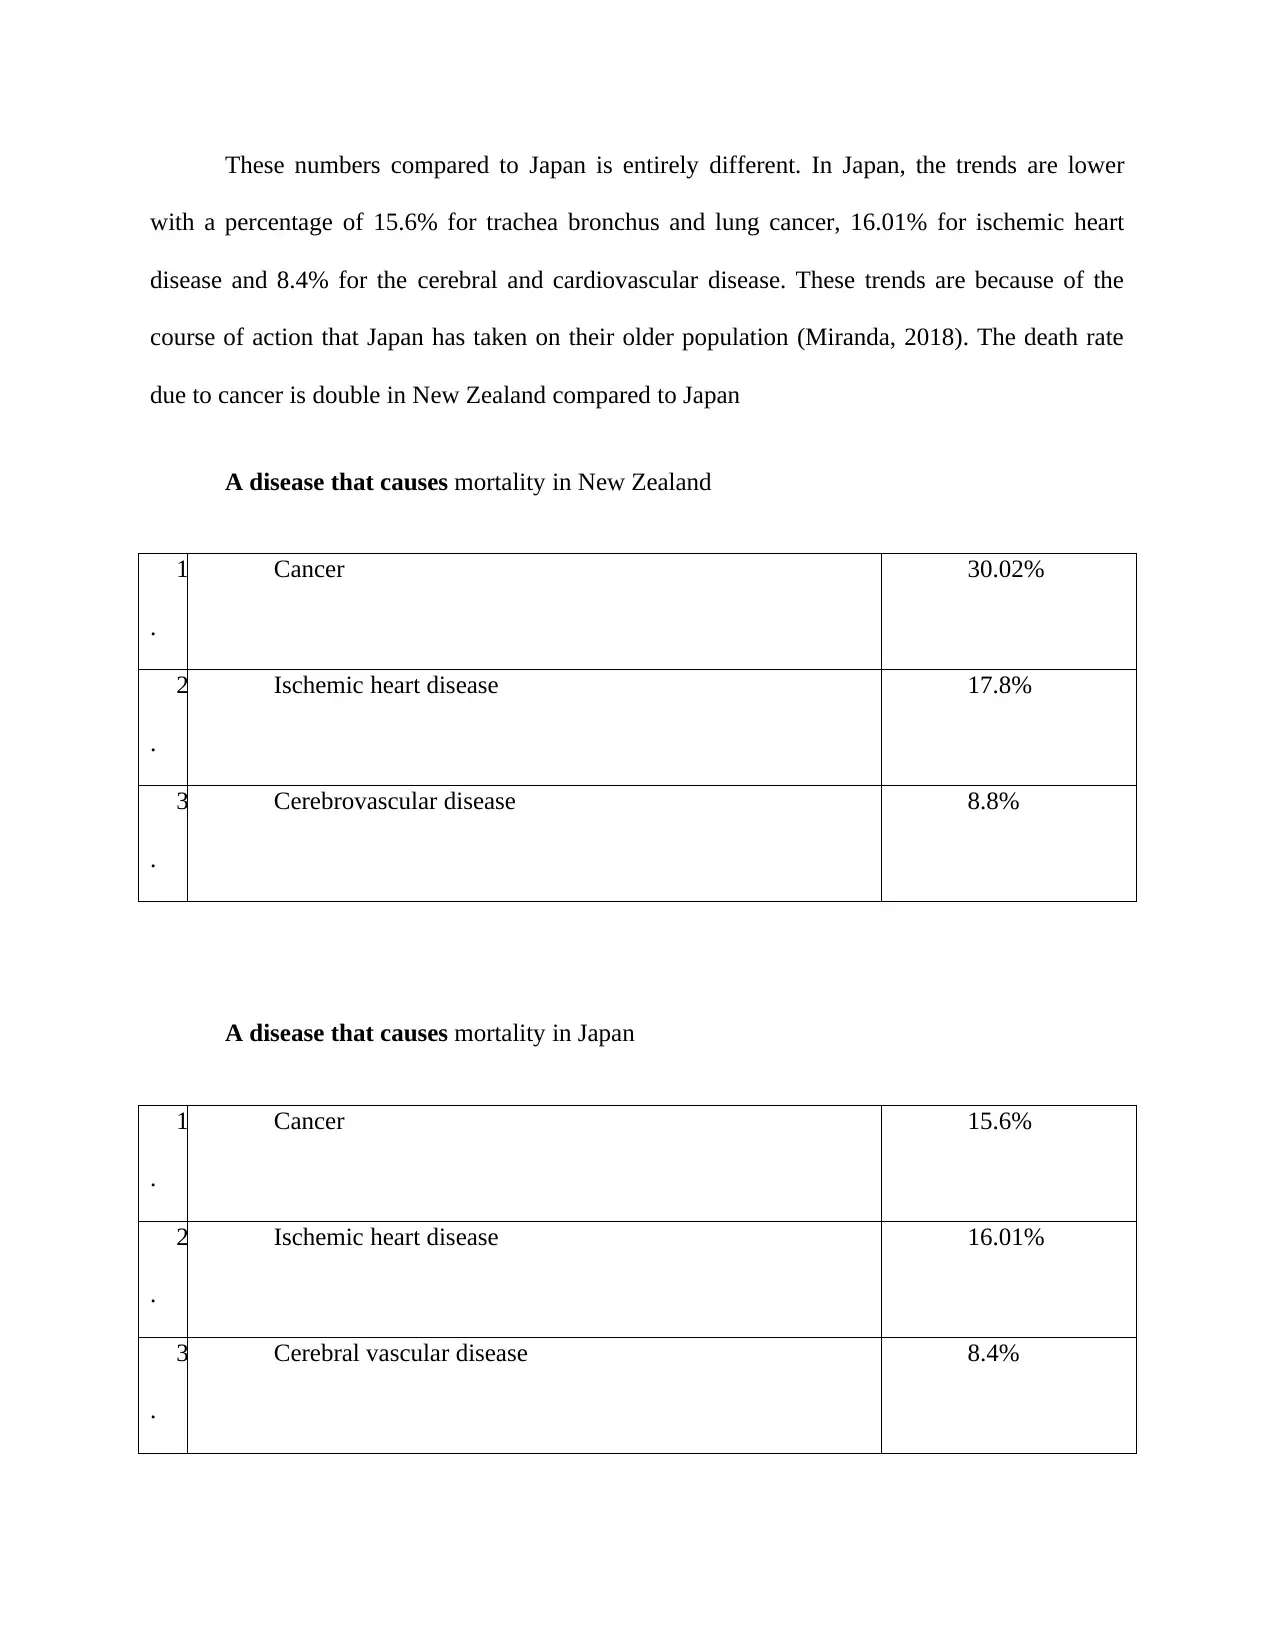
These numbers compared to Japan is entirely different. In Japan, the trends are lower
with a percentage of 15.6% for trachea bronchus and lung cancer, 16.01% for ischemic heart
disease and 8.4% for the cerebral and cardiovascular disease. These trends are because of the
course of action that Japan has taken on their older population (Miranda, 2018). The death rate
due to cancer is double in New Zealand compared to Japan
A disease that causes mortality in New Zealand
1
.
Cancer 30.02%
2
.
Ischemic heart disease 17.8%
3
.
Cerebrovascular disease 8.8%
A disease that causes mortality in Japan
1
.
Cancer 15.6%
2
.
Ischemic heart disease 16.01%
3
.
Cerebral vascular disease 8.4%
⊘ This is a preview!⊘
Do you want full access?
Subscribe today to unlock all pages.
Trusted by 1+ million students worldwide
In New Zealand, in the population 65 years and older, the percentage of non-Maori is
higher than the Maori. From 2012 to 2017, non-Maori males were at 19.4 %, while non-Maori
females were 21.5 % (Kontis et al. 2017). Maori men 65 and older made up 15.4 % of the
population and their female counterparts 17.5 %. Non-Maori lives longer than the Maori. The
trend, therefore, cuts across all the generations of the New Zealand population. These numbers
are far below than life expectancy rates in Japan (Wei et al. 2017). It is believed that this increase
in life expectancy of the elderly in Japan is because of their unique cuisine and reduced smoking
rates (Mathers, Stevens, Boerma & Tobias, 2015). The disease conditions of which are caused by
smoking are therefore reduced in Japan compared to New Zealand.
Part 1.2 Recommendations to improve the life expectancy of older adults in New
Zealand.
The first recommendation is that New Zealand should adopt a different diet for its
population. Many New Zealanders eat diets that are not well balanced, with a high intake of
processed food (Wei et al. 2017). These diets increase the risks of acquiring non-communicable
diseases such as coronary heart disease, stroke, cancer, and diabetes. Unhealthy diet habits are
one of the causes of reduced life expectancy New Zealand (Klen et al. 2016). In Japan which has
a globally recognized high life expectancy, their food intake is one of the things that enables this.
One example is the Okinawa Japanese diet, which consists of fresh vegetables and sushi. The
Japanese cuisine also consists of lower calorie foods that lower the possibilities of any calorie
related conditions like obesity and diabetes. Food consists of good amounts of fish and other
Paraphrase This Document
Need a fresh take? Get an instant paraphrase of this document with our AI Paraphraser
seafood with vegetables that all contribute to a longer and healthier lifespan (Blank, Burau &
Kuhlmann, 2017).
A second recommendation is a reduction in large life bills for elderly persons through
free hospital treatments without a long wait to be seen. This will reduce stress to the elderly.
Health conditions caused by stress easily kill the elderly therefore decreasing their lifespan and
expectancy rates. For the old people, in Japan, there is relief from hospital bills. The elderly in
Japan are treated at the cost of the government and working family members. Senior citizens are
then allowed to enjoy their final years without ‘withering away’ in hospitals thinking of they are
using up hospital resources. They only need to concentrate on how they can keep the quality of
their life.
The third recommendation is coming up with a Japanese government policy that regulates
from smoking (Tokudome, Hashimoto & Igata, 2016). Just like the underage are not allowed to
smoke the elderly too should be rehabilitated and not allowed to take any hard drugs. This
recommendation has worked in Japan, where both alcohol and cigarettes are not sold to persons
under the age of 18 and persons above the age of 65 years. Although there are factors that have
made the country to have a lower rate of life expectancy on the elderly compared to New
Zealand, death rates caused by smoking and related infections are meager. They registered as
little as 1% of deaths caused by smoking and associated infections due to this policy. New
Zealand has a rather high death rate of the elderly caused by smoking, and related diseases,
which is at 11% thus should come up with a policy regulating drugs just as in Japan (Miranda,
2018). These recommendations would help in making sure the elderly live a perfect life as they
will be less obvious factors that cause their deaths.
Part 2.1
Definition of age-friendly
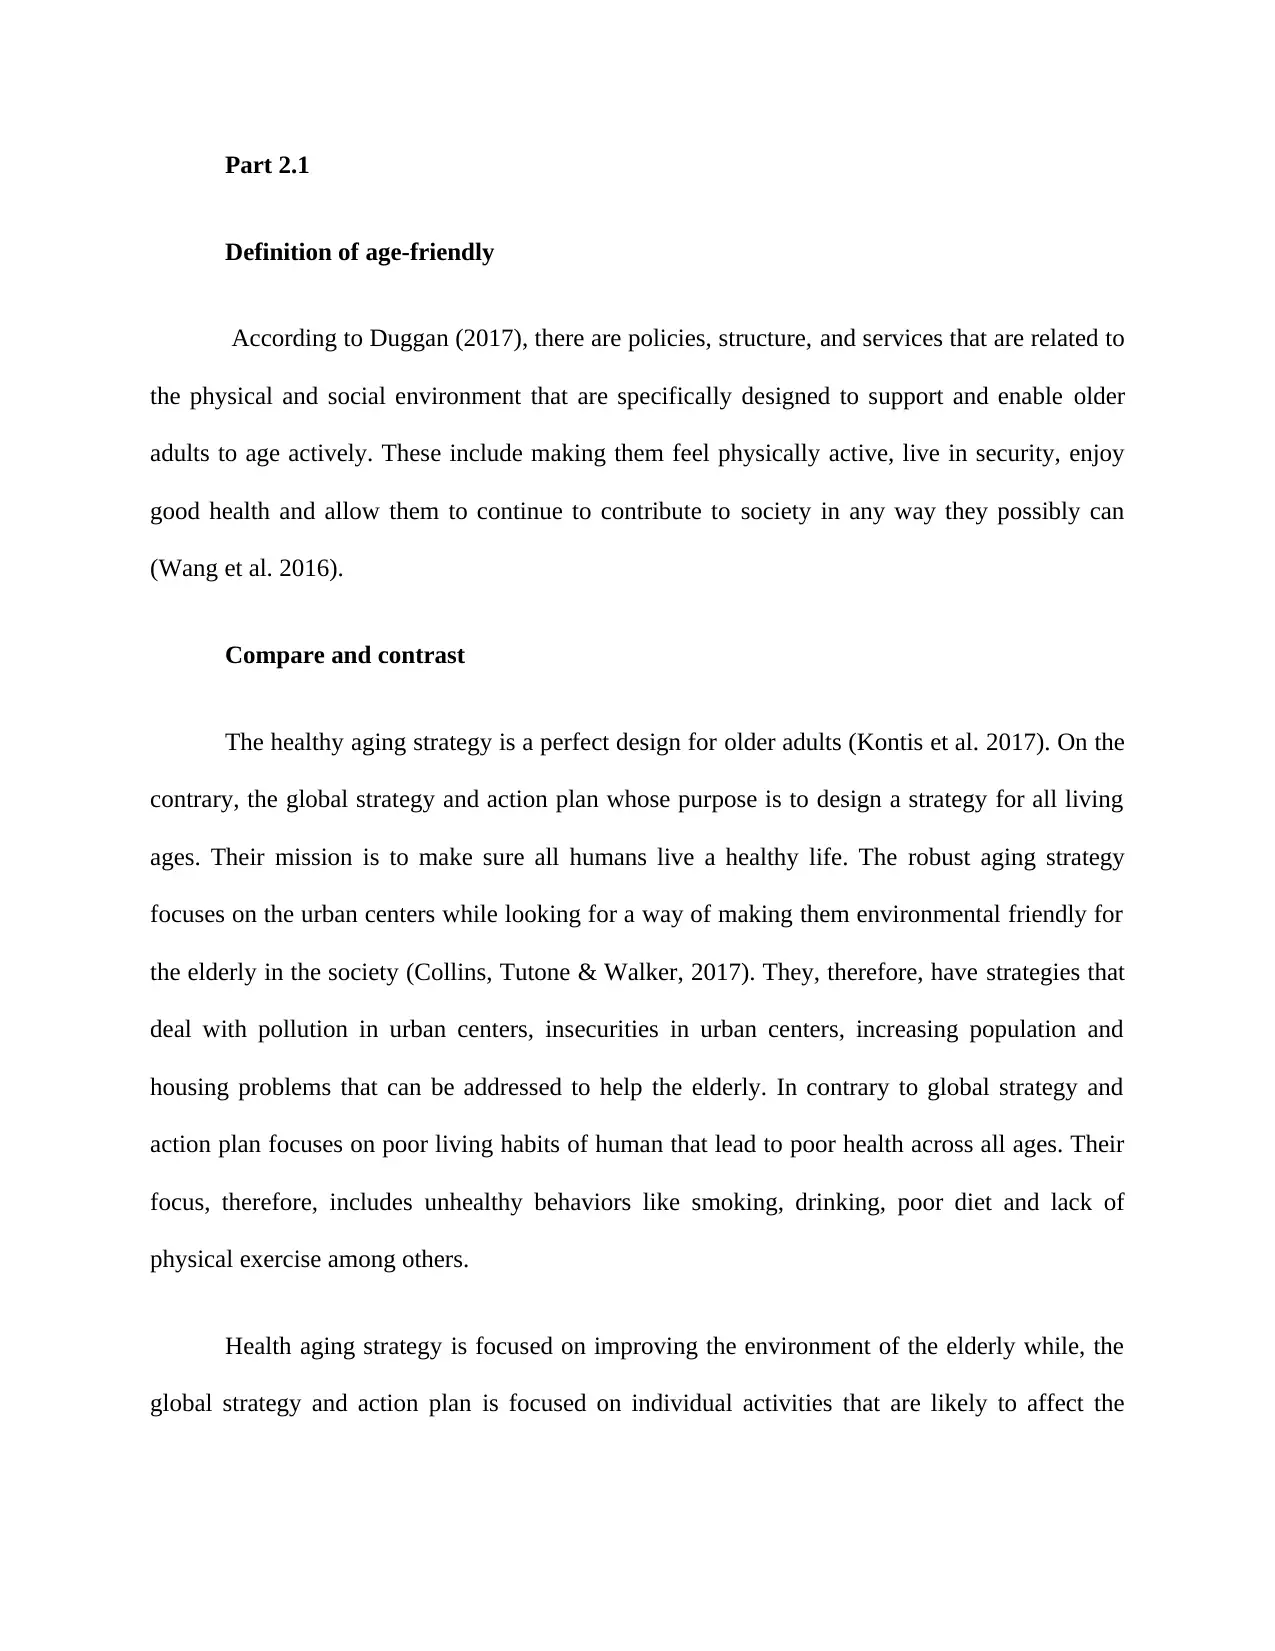
According to Duggan (2017), there are policies, structure, and services that are related to
the physical and social environment that are specifically designed to support and enable older
adults to age actively. These include making them feel physically active, live in security, enjoy
good health and allow them to continue to contribute to society in any way they possibly can
(Wang et al. 2016).
Compare and contrast
The healthy aging strategy is a perfect design for older adults (Kontis et al. 2017). On the
contrary, the global strategy and action plan whose purpose is to design a strategy for all living
ages. Their mission is to make sure all humans live a healthy life. The robust aging strategy
focuses on the urban centers while looking for a way of making them environmental friendly for
the elderly in the society (Collins, Tutone & Walker, 2017). They, therefore, have strategies that
deal with pollution in urban centers, insecurities in urban centers, increasing population and
housing problems that can be addressed to help the elderly. In contrary to global strategy and
action plan focuses on poor living habits of human that lead to poor health across all ages. Their
focus, therefore, includes unhealthy behaviors like smoking, drinking, poor diet and lack of
physical exercise among others.
Health aging strategy is focused on improving the environment of the elderly while, the
global strategy and action plan is focused on individual activities that are likely to affect the
Definition of age-friendly
According to Duggan (2017), there are policies, structure, and services that are related to
the physical and social environment that are specifically designed to support and enable older
adults to age actively. These include making them feel physically active, live in security, enjoy
good health and allow them to continue to contribute to society in any way they possibly can
(Wang et al. 2016).
Compare and contrast
The healthy aging strategy is a perfect design for older adults (Kontis et al. 2017). On the
contrary, the global strategy and action plan whose purpose is to design a strategy for all living
ages. Their mission is to make sure all humans live a healthy life. The robust aging strategy
focuses on the urban centers while looking for a way of making them environmental friendly for
the elderly in the society (Collins, Tutone & Walker, 2017). They, therefore, have strategies that
deal with pollution in urban centers, insecurities in urban centers, increasing population and
housing problems that can be addressed to help the elderly. In contrary to global strategy and
action plan focuses on poor living habits of human that lead to poor health across all ages. Their
focus, therefore, includes unhealthy behaviors like smoking, drinking, poor diet and lack of
physical exercise among others.
Health aging strategy is focused on improving the environment of the elderly while, the
global strategy and action plan is focused on individual activities that are likely to affect the
⊘ This is a preview!⊘
Do you want full access?
Subscribe today to unlock all pages.
Trusted by 1+ million students worldwide
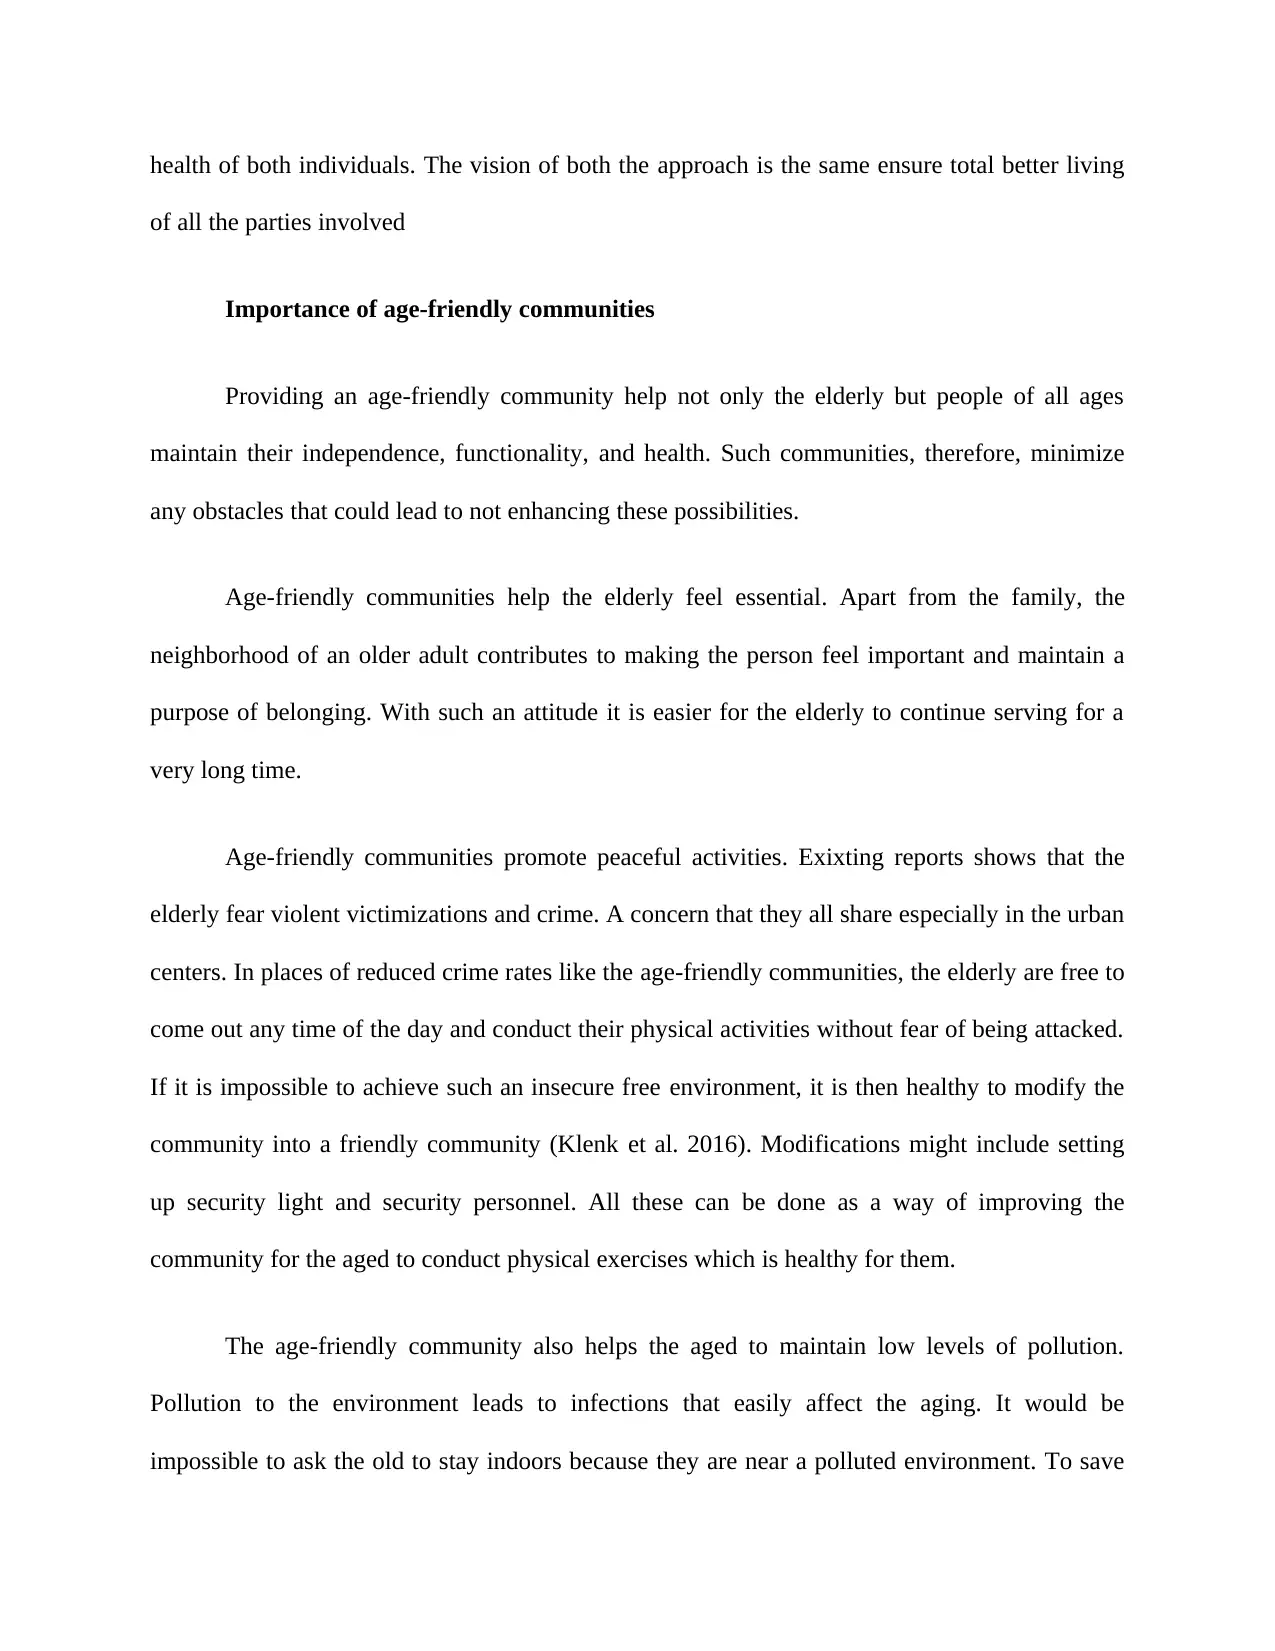
health of both individuals. The vision of both the approach is the same ensure total better living
of all the parties involved
Importance of age-friendly communities
Providing an age-friendly community help not only the elderly but people of all ages
maintain their independence, functionality, and health. Such communities, therefore, minimize
any obstacles that could lead to not enhancing these possibilities.
Age-friendly communities help the elderly feel essential. Apart from the family, the
neighborhood of an older adult contributes to making the person feel important and maintain a
purpose of belonging. With such an attitude it is easier for the elderly to continue serving for a
very long time.
Age-friendly communities promote peaceful activities. Exixting reports shows that the
elderly fear violent victimizations and crime. A concern that they all share especially in the urban
centers. In places of reduced crime rates like the age-friendly communities, the elderly are free to
come out any time of the day and conduct their physical activities without fear of being attacked.
If it is impossible to achieve such an insecure free environment, it is then healthy to modify the
community into a friendly community (Klenk et al. 2016). Modifications might include setting
up security light and security personnel. All these can be done as a way of improving the
community for the aged to conduct physical exercises which is healthy for them.
The age-friendly community also helps the aged to maintain low levels of pollution.
Pollution to the environment leads to infections that easily affect the aging. It would be
impossible to ask the old to stay indoors because they are near a polluted environment. To save
Paraphrase This Document
Need a fresh take? Get an instant paraphrase of this document with our AI Paraphraser
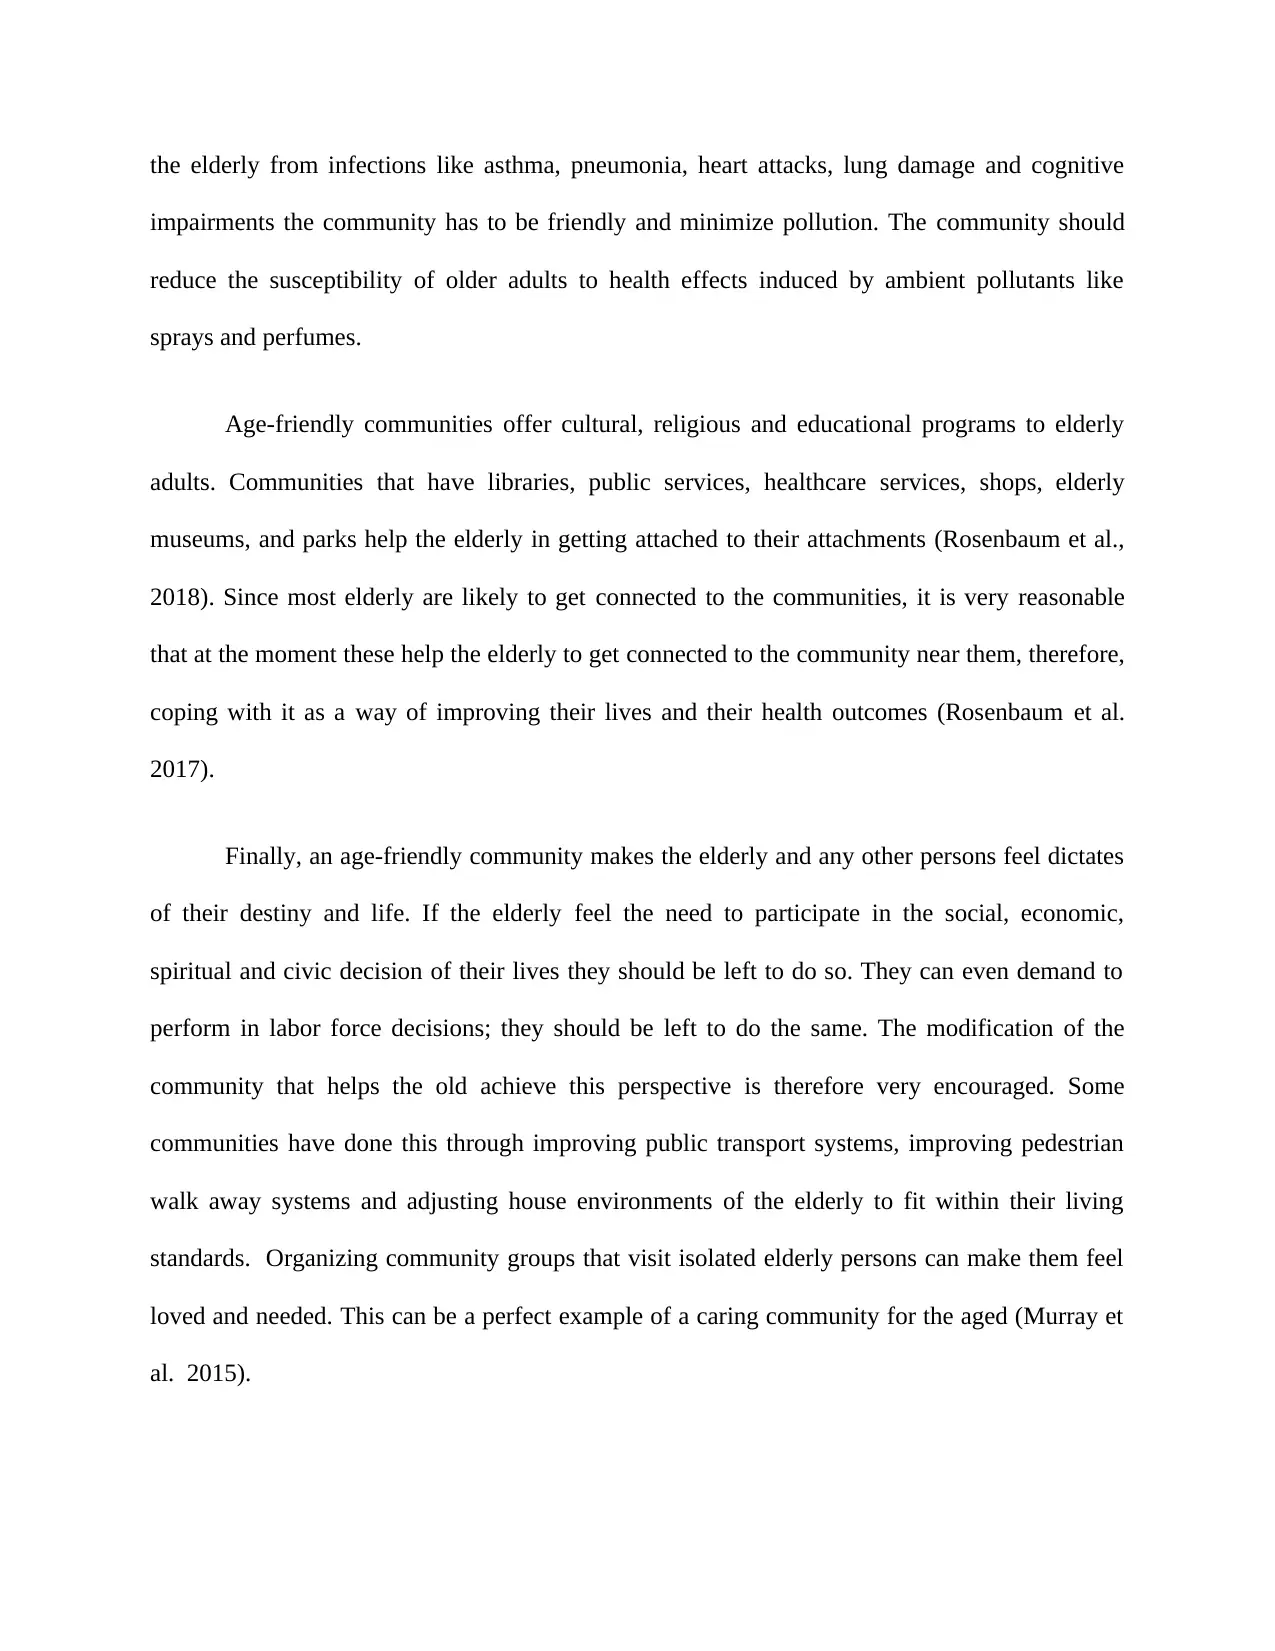
the elderly from infections like asthma, pneumonia, heart attacks, lung damage and cognitive
impairments the community has to be friendly and minimize pollution. The community should
reduce the susceptibility of older adults to health effects induced by ambient pollutants like
sprays and perfumes.
Age-friendly communities offer cultural, religious and educational programs to elderly
adults. Communities that have libraries, public services, healthcare services, shops, elderly
museums, and parks help the elderly in getting attached to their attachments (Rosenbaum et al.,
2018). Since most elderly are likely to get connected to the communities, it is very reasonable
that at the moment these help the elderly to get connected to the community near them, therefore,
coping with it as a way of improving their lives and their health outcomes (Rosenbaum et al.
2017).
Finally, an age-friendly community makes the elderly and any other persons feel dictates
of their destiny and life. If the elderly feel the need to participate in the social, economic,
spiritual and civic decision of their lives they should be left to do so. They can even demand to
perform in labor force decisions; they should be left to do the same. The modification of the
community that helps the old achieve this perspective is therefore very encouraged. Some
communities have done this through improving public transport systems, improving pedestrian
walk away systems and adjusting house environments of the elderly to fit within their living
standards. Organizing community groups that visit isolated elderly persons can make them feel
loved and needed. This can be a perfect example of a caring community for the aged (Murray et
al. 2015).
REFERENCES
Blank, R., Burau, V., & Kuhlmann, E. (2017). Comparative health policy. Macmillan
International Higher Education.
Collins, J. F., Tutone, V., & Walker, C. (2017). Kidney disease in Maori and Pacific people in
New Zealand. In Chronic Kidney Disease in Disadvantaged Populations (pp. 157-166).
Duggan, A. J. (2017). Postal Reform in Japan: A Comparative New Zealand–Japan Study of
Economic Issues in Privatising a Postal System (Doctoral dissertation, University of
Waikato).
Klenk, J., Keil, U., Jaensch, A., Christiansen, M. C., & Nagel, G. (2016). Changes in life
expectancy 1950–2010: contributions from age-and disease-specific mortality in selected
countries. Population health metrics, 14(1), 20.
Kontis, V., Bennett, J. E., Mathers, C. D., Li, G., Foreman, K., & Ezzati, M. (2017). Future life
expectancy in 35 industrialised countries: projections with a Bayesian model ensemble.
The Lancet, 389(10076), 1323-1335.
Mathers, C. D., Stevens, G. A., Boerma, T., White, R. A., & Tobias, M. I. (2015). Causes of
international increases in older age life expectancy. The Lancet, 385(9967), 540-548.
Miranda, A. E. R. (2018). Finding Opportunities in Japan's Aging Population. Ministry of health
Japan. 91(1), 335-341.
⊘ This is a preview!⊘
Do you want full access?
Subscribe today to unlock all pages.
Trusted by 1+ million students worldwide
Murray, C. J., Barber, R. M., Foreman, K. J., Ozgoren, A. A., Abd-Allah, F., Abera, S. F., ... &
Abu-Rmeileh, N. M. (2015). Global, regional, and national disability-adjusted life years
(DALYs) for 306 diseases and injuries and healthy life expectancy (HALE) for 188
countries, 1990–2013: quantifying the epidemiological transition. The Lancet,
386(10009), 2145-2191.
Narayan, S. W., & Nishtala, P. S. (2017). Discontinuation of preventive medicines in older
people with limited life expectancy: a systematic review. Drugs & aging, 34(10), 767-
776.
Rosenbaum, S., Hobson-Powell, A., Davison, K., Elliot, C., & Ward, P. B. (2017). Role Of
Physical Activity In Closing The Life Expectancy Gap of People With Mental Illness:
2934 June 2 245 PM-300 PM. Medicine & Science in Sports & Exercise, 49(5S), 842-
843.
Rosenbaum, S., Hobson-Powell, A., Davison, K., Stanton, R., Craft, L. L., Duncan, M., ... &
Ward, P. B. (2018). The Role of Sport, Exercise, and Physical Activity in Closing the
Life Expectancy Gap for People with Mental Illness: An International Consensus
Statement by Exercise and Sports Science Australia, American College of Sports
Medicine, British Association of Sport and Exercise Science, and Sport and Exercise
Science New Zealand. Translational Journal of the American College of Sports
Medicine, 3(10), 72-73.
Paraphrase This Document
Need a fresh take? Get an instant paraphrase of this document with our AI Paraphraser
Sandiford, P., Consuelo, D. J. J. V., & Rouse, P. (2017). How efficient are New Zealand's
District Health Boards at producing life expectancy gains for Māori and Europeans?.
Australian and New Zealand journal of public health, 41(2), 125-129.
Tokudome, S., Hashimoto, S., & Igata, A. (2016). Life expectancy and healthy life expectancy of
Japan: the fastest graying society in the world. BMC research notes, 9(1), 482.
Wang, H., Abajobir, A. A., Abate, K. H., Abbafati, C., Abbas, K. M., Abd-Allah, F., ... &
Adedeji, I. A. (2017). Global, regional, and national under-5 mortality, adult mortality,
age-specific mortality, and life expectancy, 1970–2016: a systematic analysis for the
Global Burden of Disease Study 2016. The Lancet, 390(10100), 1084-1150.
Wei, H. L., Wu, H. C., Lindell, M. K., Prater, C. S., Shiroshita, H., Johnston, D. M., & Becker, J.
S. (2017). Assessment of households’ responses to the tsunami threat: A comparative
study of Japan and New Zealand. International journal of disaster risk reduction, 25,
274-282.
1 out of 11


Your All-in-One AI-Powered Toolkit for Academic Success.
+13062052269
info@desklib.com
Available 24*7 on WhatsApp / Email
![[object Object]](/_next/static/media/star-bottom.7253800d.svg)
Unlock your academic potential
Copyright © 2020–2026 A2Z Services. All Rights Reserved. Developed and managed by ZUCOL.