logo

Cost Volume Profit Analysis and Decision-Making Techniques

10 Pages5049 Words36 Views
   

Added on  2022-07-07

About This Document

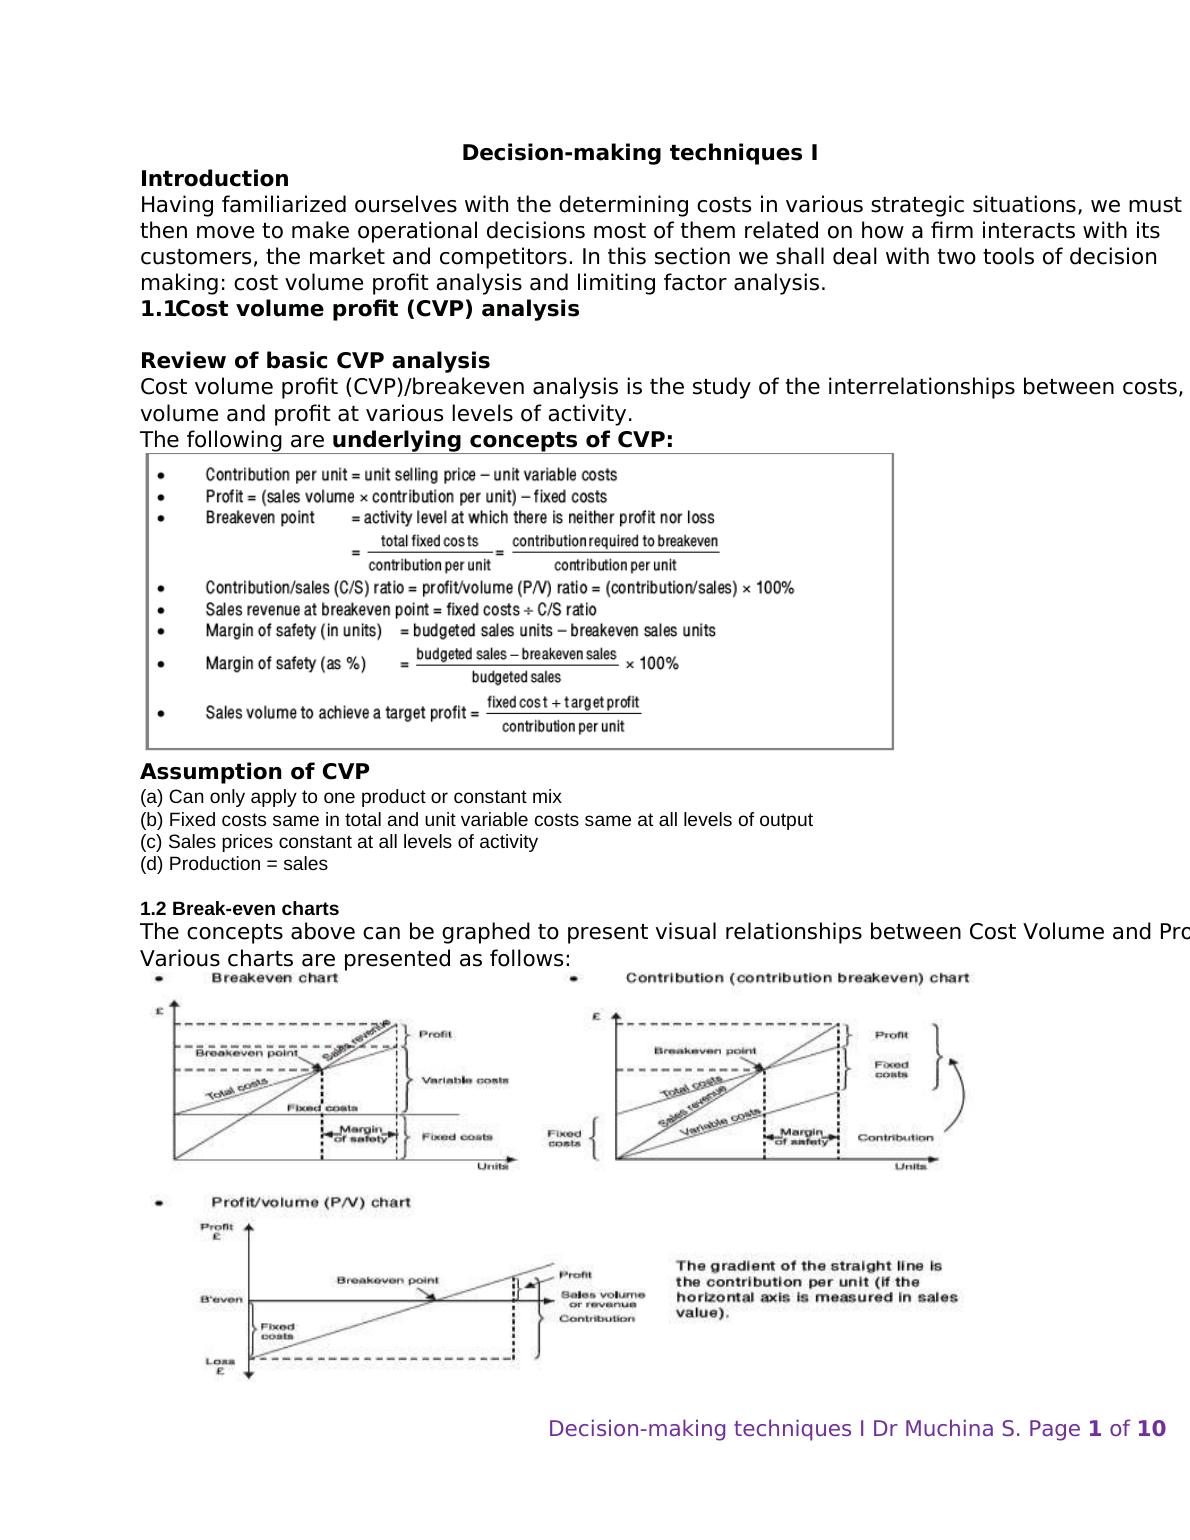
This document focuses on Cost Volume Profit (CVP). Limitation and Advantages of CVP, limiting factor analysis, and contribution to sale ratio (C/S) are discussed. Organisations typically produce and sell a variety of products and services. To perform breakeven analysis in a multi-product organisation, however, a constant product sales mix must be assumed. The margin of safety for a multi-product organisation is equal to the budgeted sales in the standard mix less the breakeven sales in the standard mix. It may be expressed as a percentage of the budgeted sales.

Cost Volume Profit Analysis and Decision-Making Techniques

   Added on 2022-07-07

ShareRelated Documents
Decision-making techniques I Dr Muchina S. Page 1 of 10
Decision-making techniques I
Introduction
Having familiarized ourselves with the determining costs in various strategic situations, we must
then move to make operational decisions most of them related on how a firm interacts with its
customers, the market and competitors. In this section we shall deal with two tools of decision
making: cost volume profit analysis and limiting factor analysis.
1.1 Cost volume profit (CVP) analysis
Review of basic CVP analysis
Cost volume profit (CVP)/breakeven analysis is the study of the interrelationships between costs,
volume and profit at various levels of activity.
The following are underlying concepts of CVP:
Assumption of CVP
(a) Can only apply to one product or constant mix
(b) Fixed costs same in total and unit variable costs same at all levels of output
(c) Sales prices constant at all levels of activity
(d) Production = sales
1.2 Break-even charts
The concepts above can be graphed to present visual relationships between Cost Volume and Profit.
Various charts are presented as follows:
Cost Volume Profit Analysis and Decision-Making Techniques_1
Decision-making techniques I Dr Muchina S. Page 2 of 10
Example: Graphing CVP
A new product has the following sales and cost data.
Selling price $60 per unit ; Variable cost $40 per unit ; Fixed costs $25,000 per month
Forecast sales 1,800 units per month
Required: Prepare a breakeven chart using the above data.
Solution
Step 1 Draw the axes and label them. Your graph should fill as much of the page as possible, this
will make it clearer and easier to read. The highest value on the vertical axis will be the
monthly sales revenue. 1,800 units x $60 = $108,000
Step 2 Draw the fixed cost line and label it. This will be a straight line parallel to the horizontal axis
at the $25,000 level. The $25,000 fixed costs are incurred even with zero activity.
Step 3 Draw the total cost line and label it. The best way to do this is to calculate the total costs
for the maximum sales level (1,800 units). Mark this point on the graph and join it to the
cost incurred at zero activity, that is, $25,000.
$
Variable costs for 1,800 units (1,800 x $40) 72,000
Fixed costs 25,000
Total cost for 1,800 units 97,000
Step 4 Draw the revenue line and label it. Once again, start by plotting the revenue at the
maximum activity level. 1,800 units x $60 = $108,000. This point can be joined to the
origin, since at zero activity there will be no sales revenue.
Step 5 Mark any required information on the chart and read off solutions as required. Check that
your chart is accurate by reading off the measures: the breakeven point, the margin of
safety, the profit for sales of 1,800 units.
Step 6 Check the accuracy of your readings using arithmetic. If you have time, it is good
examination technique to check your answer and make adjustments for any errors in your
chart.
The completed graph is shown below.
1.3 Breakeven analysis in a multi-product environment
To perform breakeven analysis in a multi-product organisation, a constant product sales mix must be
assumed, or all products must have the same C/S ratio.
A major assumption
Organisations typically produce and sell a variety of products and services. To perform breakeven
analysis in a multi-product organisation, however, a constant product sales mix must be assumed. In
other words, we have to assume that whenever x units of product A are sold, y units of product B
and z units of product C are also sold.
Cost Volume Profit Analysis and Decision-Making Techniques_2
Decision-making techniques I Dr Muchina S. Page 3 of 10
Such an assumption allows us to calculate a weighted average contribution per mix, the weighting
being on the basis of the quantities of each product in the constant mix. This means that the unit
contribution of the product that makes up the largest proportion of the mix has the greatest impact
on the average contribution per mix.
The only situation when the mix of products does not affect the analysis is when all of the products
have the same ratio of contribution to sales (C/S ratio).
Breakeven point for multiple products
The breakeven point (in number of mixes) for a standard mix of products is calculated as fixed
costs/contribution per mix.
Example: Breakeven point for multiple products
PL produces and sells two products. The M sells for $7 per unit and has a total variable cost of $2.94
per unit, while the N sells for $15 per unit and has a total variable cost of $4.50 per unit. The
marketing department has estimated that for every five units of M sold, one unit of N will be sold.
The organisation's fixed costs total $36,000. Calculate the breakeven point for PL.
Solution We calculate the breakeven point as follows.
Step 1 Calculate contribution per unit
M N
$ per unit $ per unit
Selling price 7.00 15.00
Variable cost 2.94 4.50
Contribution 4.06 10.50
Step 2 Calculate contribution per mix = ($4.06 x 5) + ($10.50 x 1) = $30.80
Step 3 Calculate the breakeven point in terms of the number of mixes
= fixed costs/contribution per mix = $36,000/$30.80 = 1,169 mixes (rounded)
Step4 Calculate the breakeven point in terms of the number of units of the products
= (1,169 x 5) = 5,845 units of M and (1,169 x 1)=1,169 units of N (rounded)
Step 5 Calculate the breakeven point in terms of revenue
= (5,845 x$7) + (1,169 x $15) = $40,915 of M and $17,535 of N = $58,450 in total
It is important to note that the breakeven point is not $58,450 of revenue, whatever the mix of
products. The breakeven point is $58,450 provided that the sales mix remains 5:1. Likewise the
breakeven point is not at a production/sales level of (5,845 + 1,169) 7,014 units. Rather, it is when 5,845
units of M and 1,169 units of N are sold, assuming a sales mix of 5:1.
1.4 Contribution to sales (C/S) ratio for multiple products
The breakeven point in terms of sales revenue can be calculated as fixed costs/average C/S ratio. Any
change in the proportions of products in the mix will change the contribution per mix and the average
C/S ratio and hence the breakeven point.
Calculating the ratio
An alternative way of calculating the breakeven point is to use the average contribution to sales (C/S)
ratio for the standard mix. As you should already know, the C/S ratio is sometimes called the
profit/volume ratio or P/V ratio. We can calculate the breakeven point of PL as follows.
Step 1 Calculate revenue per mix = (5 x $7) + (1x $15) = $50
Step 2 Calculate contribution per mix = $30.80 see previous example
Step 3 Calculate average C/S ratio = ($30.80/$50.00) x 100% = 61.6%
Step 4 Calculate breakeven point (total) = fixed costs ÷ C/S ratio = $36,000/0.616 = $58,442
Step 5 Calculate revenue ratio of mix = (5 x $7) : (1x$15) = 35:15, or 7:3
Step 6 Calculate breakeven sales
M = $58,442 x 7/10 = $40,909 rounded ; N = $58,442 x 3/10 = $17,533 rounded
Cost Volume Profit Analysis and Decision-Making Techniques_3

End of preview

Want to access all the pages? Upload your documents or become a member.

Related Documents
MANAGEMENT ACCOUNTING FOR NON-ACCOUNTANTS
|6
|1056
|278

BREAK EVEN POINT ANALYSIS.
|5
|356
|58

Introduction to Quantitative Methods Assignment
|10
|1843
|25

Methods of Determining Breakeven Point
|9
|2031
|234

Managing Financial Resources
|16
|901
|81

1102AFE ACCOUNTING FOR DECISION MAKING - Homework
|3
|742
|40