Limitation of Financial Model and Conventional Analysis
Added on 2020-06-06
21 Pages4379 Words123 Views
Business AnalysisProject
Table of ContentsINTRODUCTION...........................................................................................................................11) COMPANY BACKGROUND....................................................................................................11.1 Key Issues.........................................................................................................................11.2 Comparison with competitors on the basis of value proposition.....................................11.3 Rationale of choice of company.......................................................................................22) FINANCIAL ANALYSIS...........................................................................................................22.1 Ration analysis and its importance...................................................................................22.2 Types of ratio analysis......................................................................................................23) STRATEGIC ANALYSIS..........................................................................................................83.1 PESTLE analysis..............................................................................................................83.2 New forces affect the organisation...................................................................................93.3 Operations perform by organisation.................................................................................93.4 Success factors................................................................................................................104) IDENTIFICATION OF APPROPRIATE STRATEGIES........................................................114.1 Ansoff's Matrix...............................................................................................................115) LIMITATION OF FINANCIAL MODEL AND CONVENTIONAL ANALYSIS.................125.1 Limitation of conventional analysis...............................................................................125.2 Limitation of financial model analysis...........................................................................12RECOMMENDATION.................................................................................................................13CONCLUSION..............................................................................................................................13MODELLING................................................................................................................................13REFERENCES..............................................................................................................................15APPENDIX....................................................................................................................................17Illustration IndexIllustration 1: Return on capital invested.........................................................................................3Illustration 2: Net Profit Margin Ratio.............................................................................................4Illustration 3: Return on Asset Ratio...............................................................................................5Illustration 4: Current Ratio.............................................................................................................6
Illustration 5: Quick Ratio...............................................................................................................7Illustration 6: Consumer price index................................................................................................8Illustration 7: Ansoff Matrix..........................................................................................................11
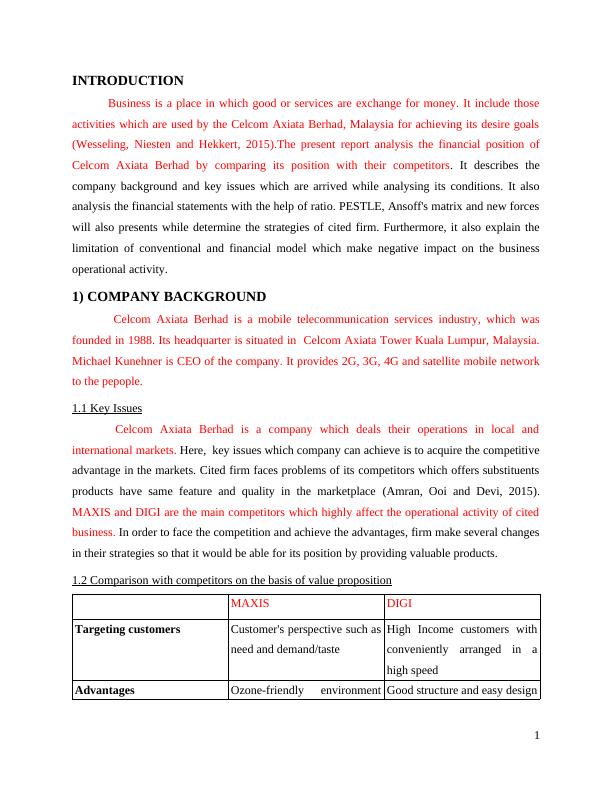
INTRODUCTIONBusiness is a place in which good or services are exchange for money. It include thoseactivities which are used by the Celcom Axiata Berhad, Malaysia for achieving its desire goals(Wesseling, Niesten and Hekkert, 2015).The present report analysis the financial position ofCelcom Axiata Berhad by comparing its position with their competitors. It describes thecompany background and key issues which are arrived while analysing its conditions. It alsoanalysis the financial statements with the help of ratio. PESTLE, Ansoff's matrix and new forceswill also presents while determine the strategies of cited firm. Furthermore, it also explain thelimitation of conventional and financial model which make negative impact on the businessoperational activity.1) COMPANY BACKGROUND Celcom Axiata Berhad is a mobile telecommunication services industry, which wasfounded in 1988. Its headquarter is situated in Celcom Axiata Tower Kuala Lumpur, Malaysia.Michael Kunehner is CEO of the company. It provides 2G, 3G, 4G and satellite mobile networkto the pepople.1.1 Key Issues Celcom Axiata Berhad is a company which deals their operations in local andinternational markets. Here, key issues which company can achieve is to acquire the competitiveadvantage in the markets. Cited firm faces problems of its competitors which offers substituentsproducts have same feature and quality in the marketplace (Amran, Ooi and Devi, 2015).MAXIS and DIGI are the main competitors which highly affect the operational activity of citedbusiness. In order to face the competition and achieve the advantages, firm make several changesin their strategies so that it would be able for its position by providing valuable products.1.2 Comparison with competitors on the basis of value propositionMAXISDIGITargeting customersCustomer's perspective such asneed and demand/tasteHigh Income customers withconveniently arranged in ahigh speedAdvantagesOzone-friendly environmentGood structure and easy design1
and quality productswith qualityPrice15% premium29% premiumValue for customersGood services in an affordablepriceAverage telecommunicationservices with normal price1.3 Rationale of choice of company Celcom Axiata Berhad is selected as a firm, aim of the study is to analysis the productswhich offers to their customers in good quality with an affordable price. It respect to this, citedfirm decide to operates its function in those market which has been increases for over 10 years. Itcan be said that it is essential for the organisation to understand the market trend and competitionwhich highly affect their managerial functions.2) FINANCIAL ANALYSIS2.1 Ration analysis and its importanceRatio analysis is a form of financial statement. It is used to take information of finalperformance of business. Ratio are of different types. The data which are provided by financialstatements are already available. The calculation of ratio are different in firms. It can be used tocompare with performance of industry (Isa and Mohamed, 2017). It is based upon accountinginformation, its effectiveness is limited because of some complications which arise due tohistorical cost accounting and inflation. And it can be used in a form of trends analysis toidentify the area which need to be investigated further.2.2 Types of ratio analysisReturn on invested capital2011-122012-132013-142014-152015-16 Return on invested capitalCelcom Axiata Berhad5.866.485.65.675.07Maxix13.559.439.667.2711.95DIGI83.2482.2194.31105.0191.472
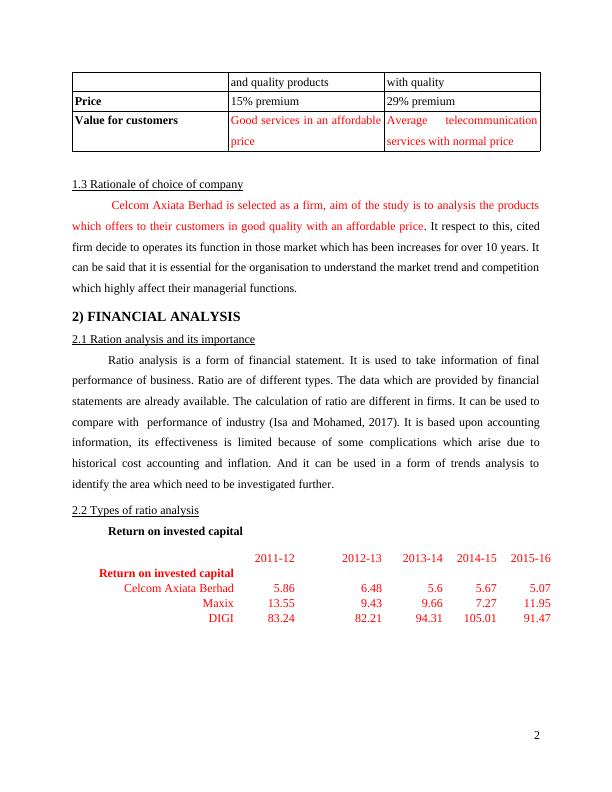
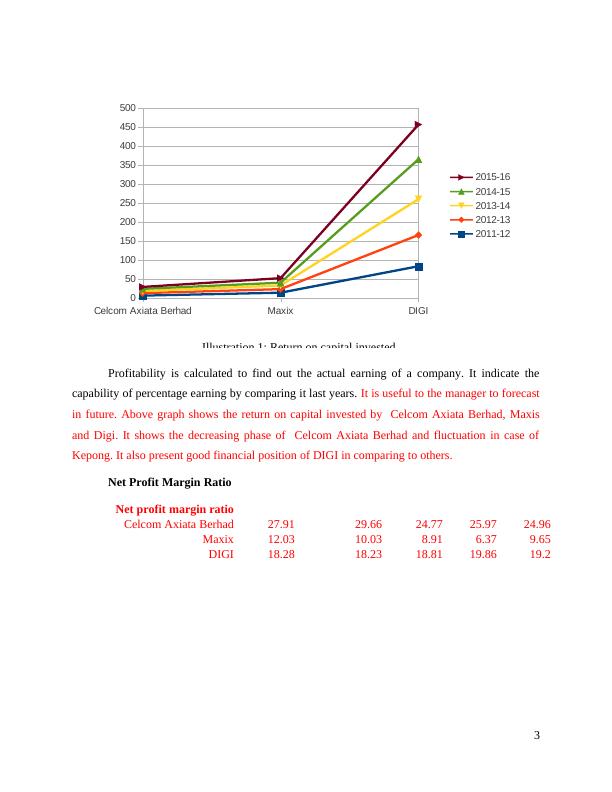
Celcom Axiata BerhadMaxixDIGI0501001502002503003504004505002015-16 2014-15 2013-14 2012-13 2011-12 Illustration 1: Return on capital investedProfitability is calculated to find out the actual earning of a company. It indicate thecapability of percentage earning by comparing it last years. It is useful to the manager to forecastin future. Above graph shows the return on capital invested by Celcom Axiata Berhad, Maxisand Digi. It shows the decreasing phase of Celcom Axiata Berhad and fluctuation in case ofKepong. It also present good financial position of DIGI in comparing to others.Net Profit Margin RatioNet profit margin ratioCelcom Axiata Berhad27.9129.6624.7725.9724.96Maxix12.0310.038.916.379.65DIGI18.2818.2318.8119.8619.23
End of preview
Want to access all the pages? Upload your documents or become a member.
Related Documents
Marketing Management : Assignment Solutionlg...
|18
|5270
|289
Report Analysis of Key Issues in Businesslg...
|20
|4595
|55
Financial Analysis and Management of Celcom and Maxislg...
|26
|4736
|375
FINANCIAL ANALYSIS AND MANAGEMENTlg...
|27
|5822
|22
Financial Analysis of Axiata and Maxis Communicationlg...
|22
|4563
|346
Assignment: Business Analysislg...
|13
|3676
|472