Finance Report: Interest Rates, Inflation Analysis & Forecasting
VerifiedAdded on 2023/06/03
|7
|1424
|212
Report
AI Summary
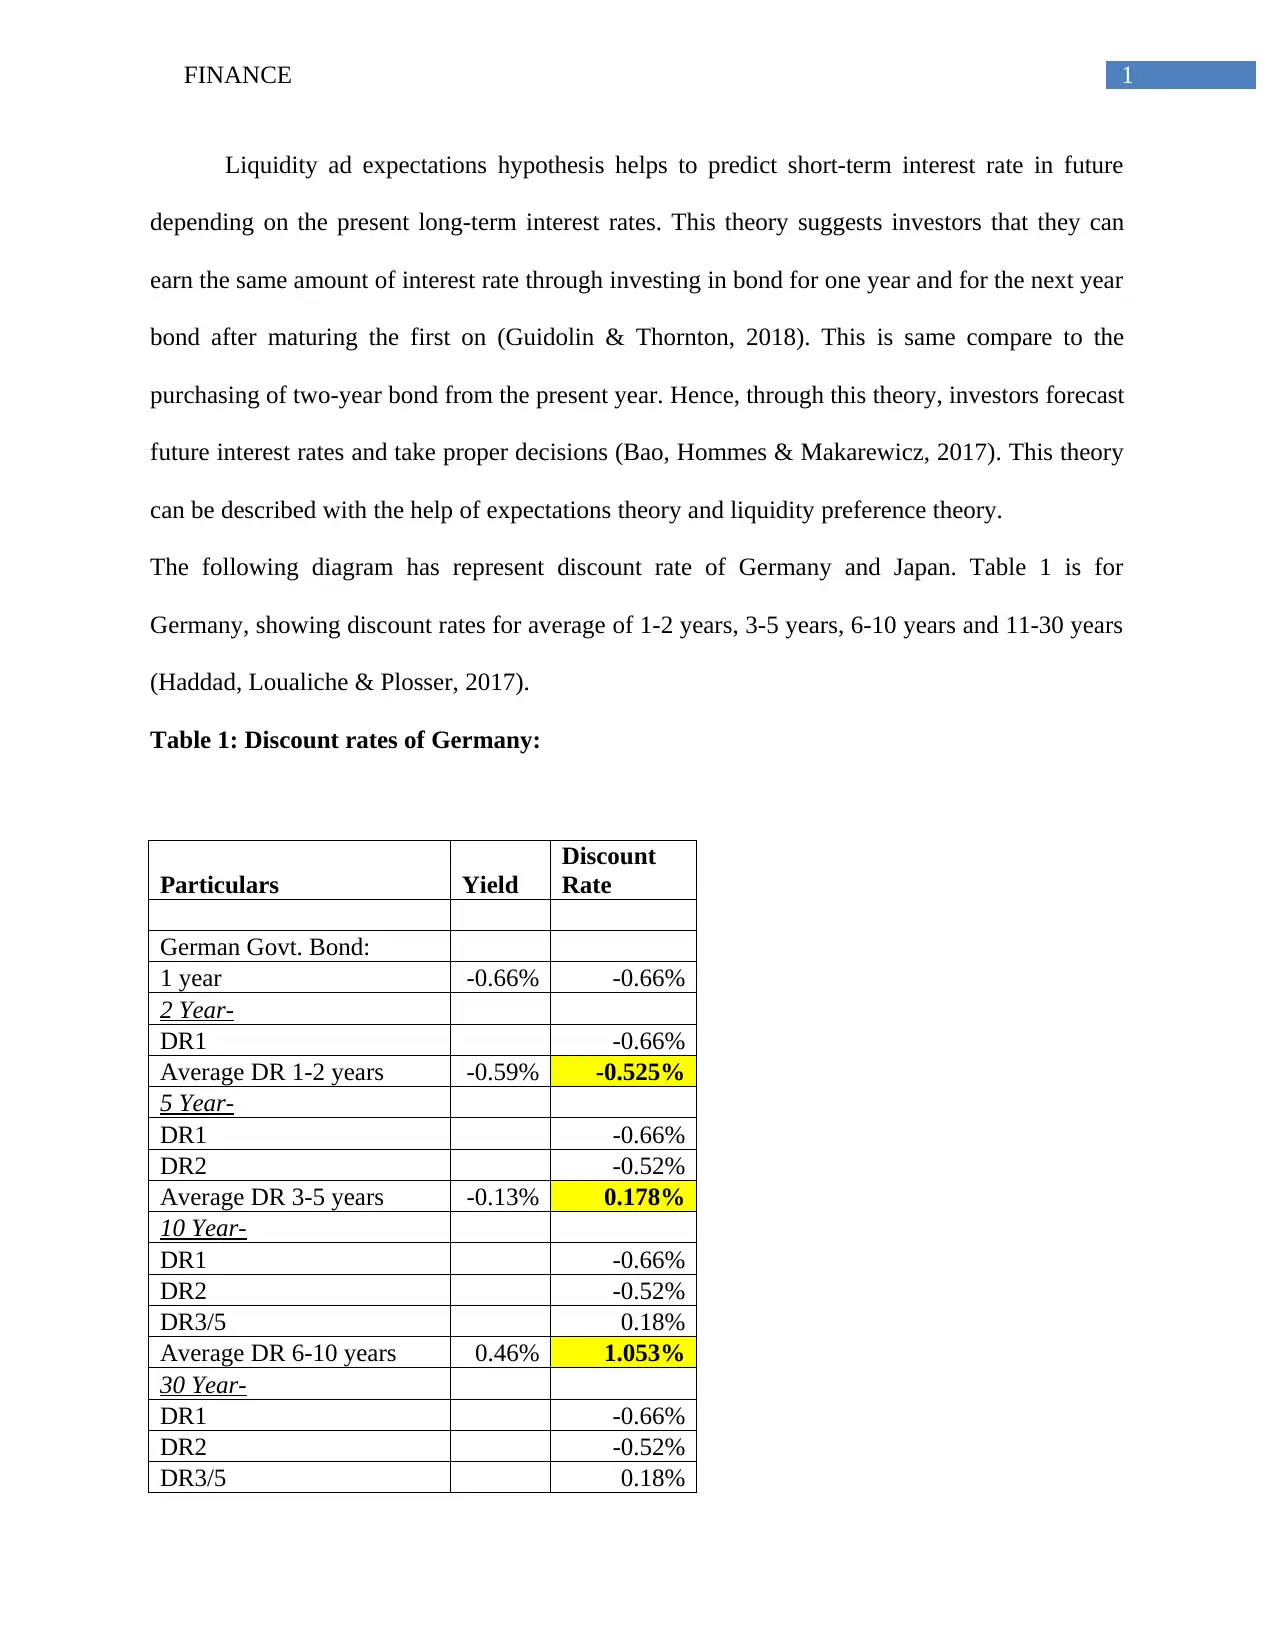
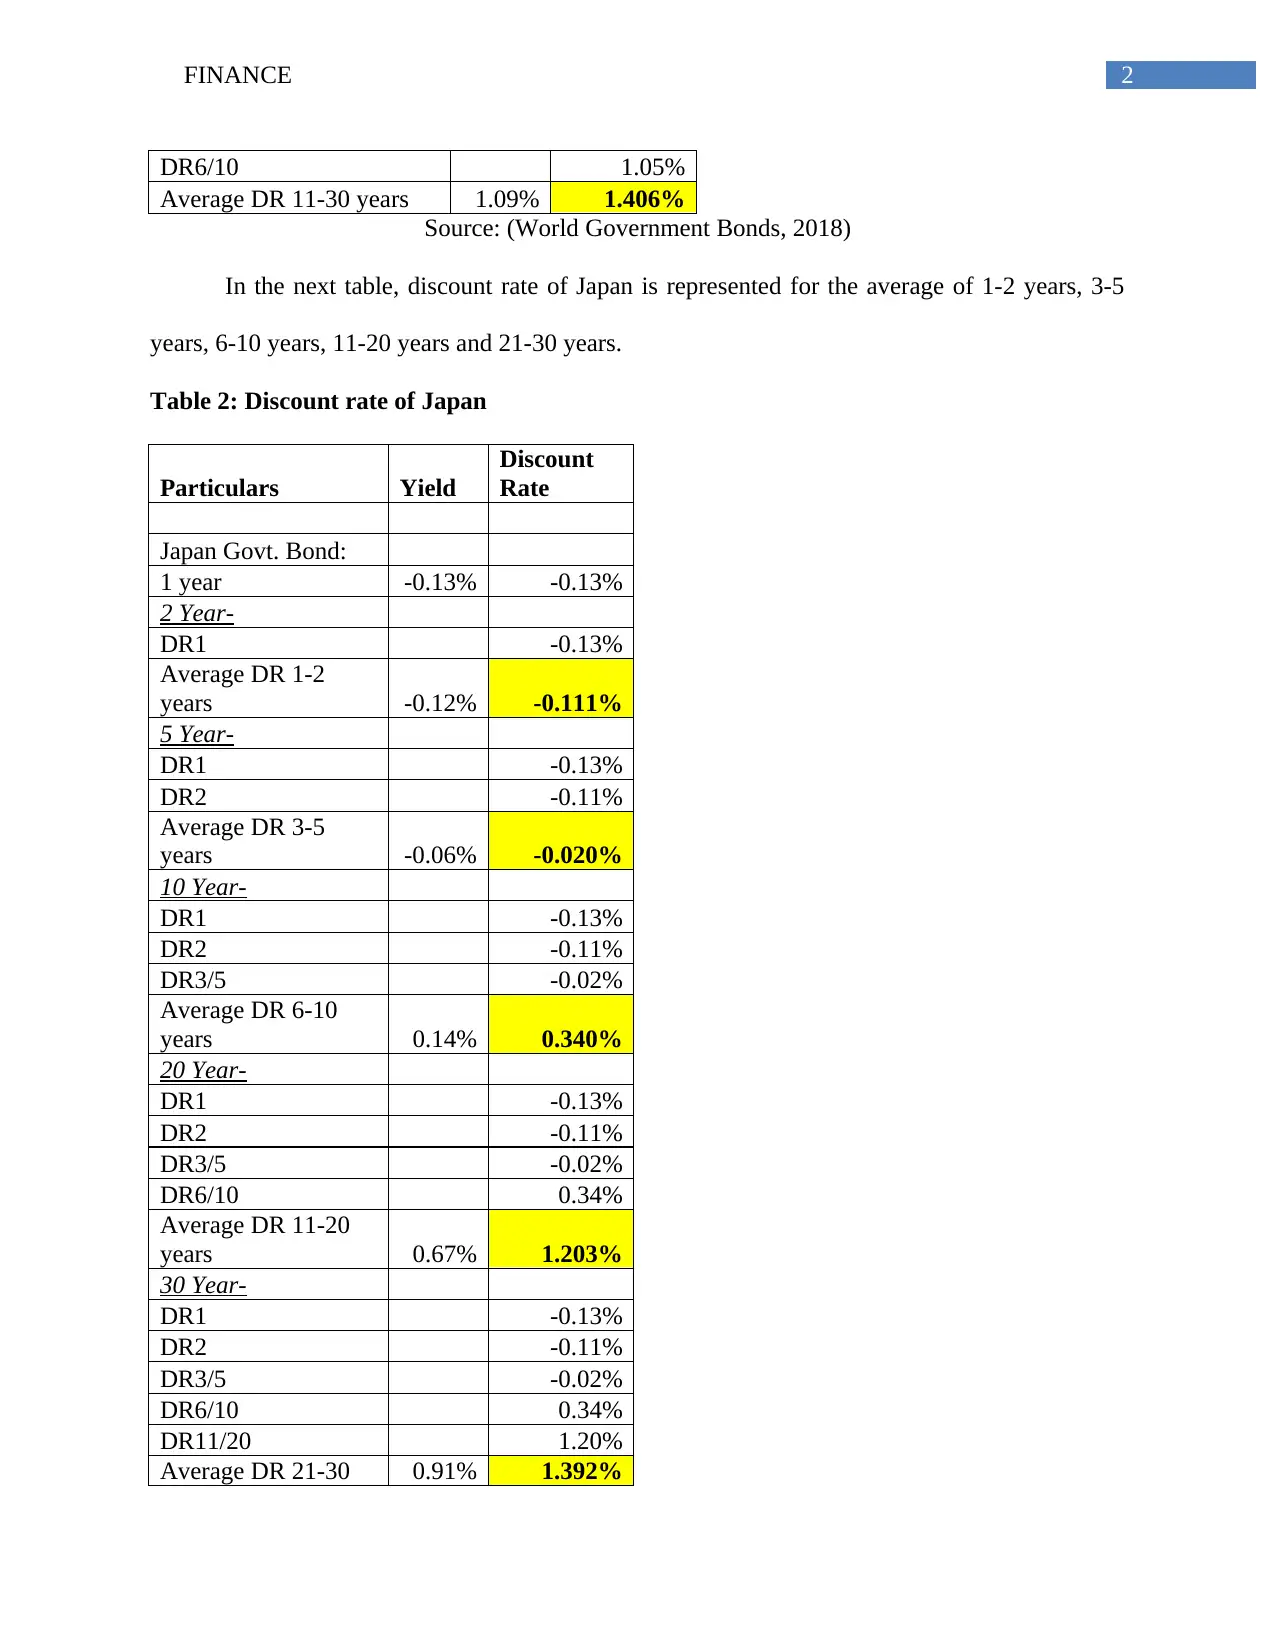
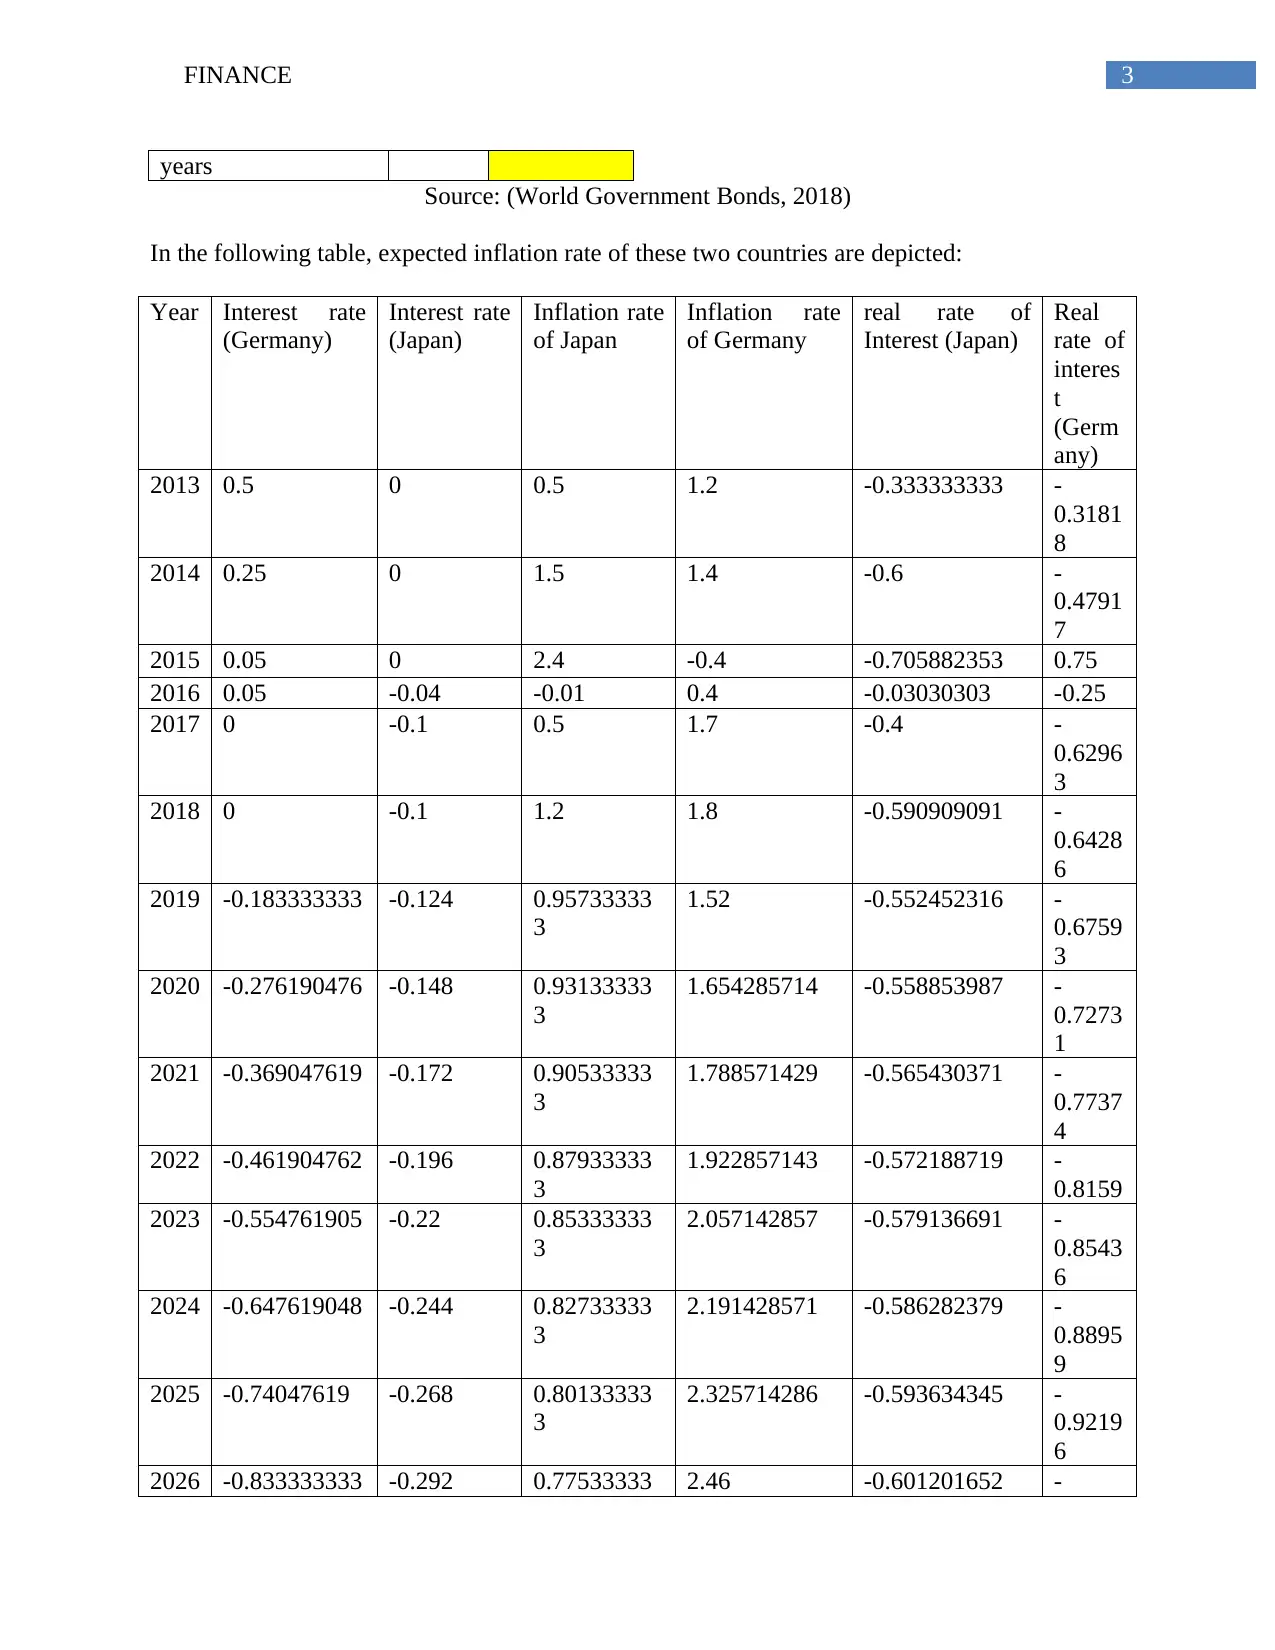
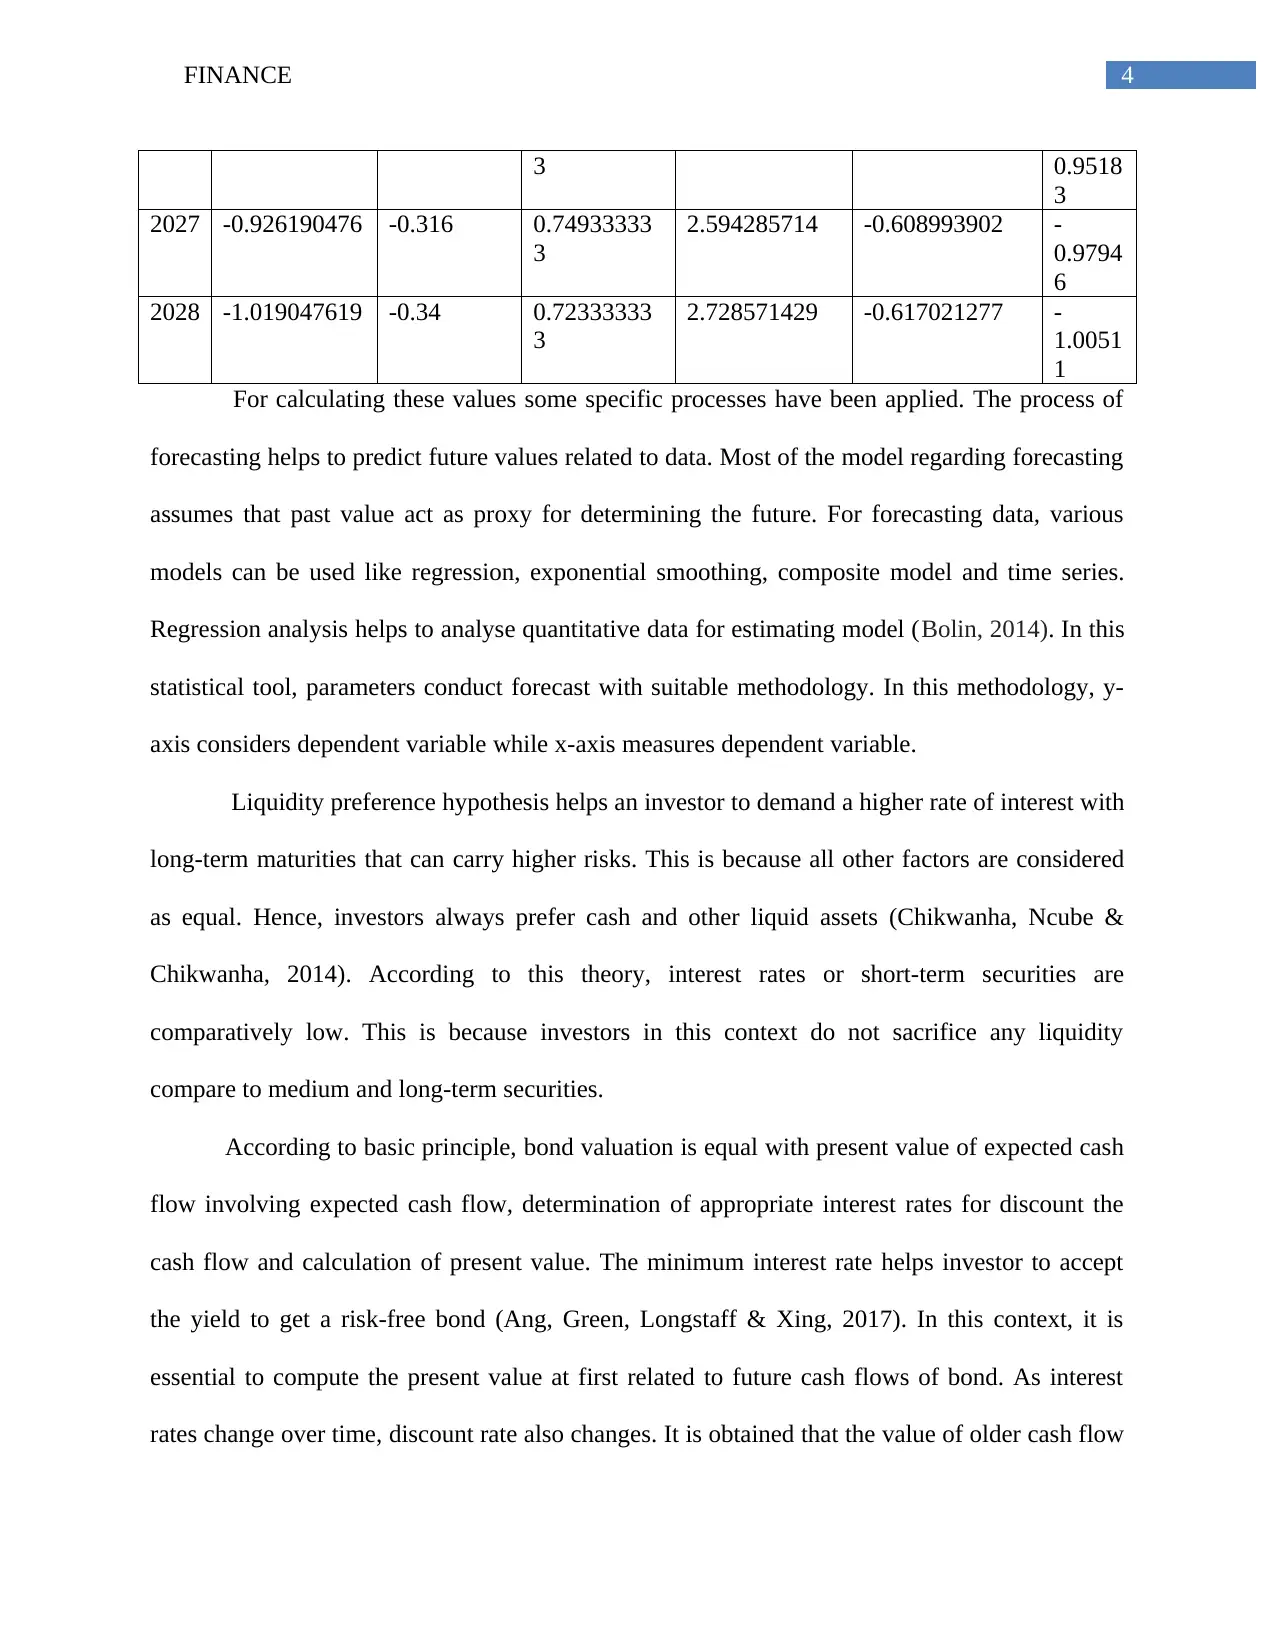
This finance report analyzes interest rates and inflation in Germany and Japan, utilizing the liquidity and expectations hypotheses to forecast future trends. It incorporates real-world market data and various forecasting models, including regression analysis, to estimate future values. The report examines discount rates, bond valuations, and the relationship between coupon rates and yields, highlighting how investors' liquidity preferences influence interest rate demands. The analysis includes detailed tables presenting discount rates for German and Japanese government bonds across different maturities, along with expected inflation rates and real interest rates. The report provides a comprehensive overview of the factors influencing interest rate and inflation dynamics, offering insights into market conditions and future financial outlooks. Desklib provides this document and other study resources for students.
1 out of 7
Related Documents


Your All-in-One AI-Powered Toolkit for Academic Success.
+13062052269
info@desklib.com
Available 24*7 on WhatsApp / Email
![[object Object]](/_next/static/media/star-bottom.7253800d.svg)
Copyright © 2020–2026 A2Z Services. All Rights Reserved. Developed and managed by ZUCOL.