Liveability and Sustainability Study in Canada Communities
VerifiedAdded on 2022/08/11
|15
|3049
|19
AI Summary
Contribute Materials
Your contribution can guide someone’s learning journey. Share your
documents today.

Liveability and sustainability study in between Toronto, Vancouver and Montreal
Secure Best Marks with AI Grader
Need help grading? Try our AI Grader for instant feedback on your assignments.
Introduction
Thesis statement:
This case study is related with three Canadian communities as Vancouver, Toronto and
Montreal. This analysis shows the different data for these three countries. This data can be
divided by using various parameters such as:
Demographic and economic data
Social well-being data
Housing data
Liveability measures
Description of each three communities:
Toronto is the largest city of Canada and it is also known as the cultural and economic centre
of Canada. It is the city, where a lot of immigrants migrate for searching the employment and
career opportunities. Toronto is situated on the shore of the Ontario Lake. This Ontario Lake
is one of the largest freshwater lakes in world. It has higher tree density in comparison with
any other city in the western world.
Vancouver is approximate 2000 km. closer to the Philippines on the pacific coast. It also has
the similar population size as Philippines has. As it is far from the industrial heartland, so it
has fewer career opportunities.
Montreal has the oldest winters with ice and snow build up, but it also has the hottest summer
in comparison with other communities.1
Criteria of analysis:
I am doing this analysis on the basis of different parameter’s criteria, such as: immigration,
Ethnicity, income, crime rates, Mortality rates, commitment to sustainable measures,
affordability, and availability of housing. I am using these three communities Vancouver,
Toronto and Montreal, because these all are having similar size in terms of population.
1 Benoit, “which city.”
Data presentation
Demographic and economic data:
In terms of immigration:
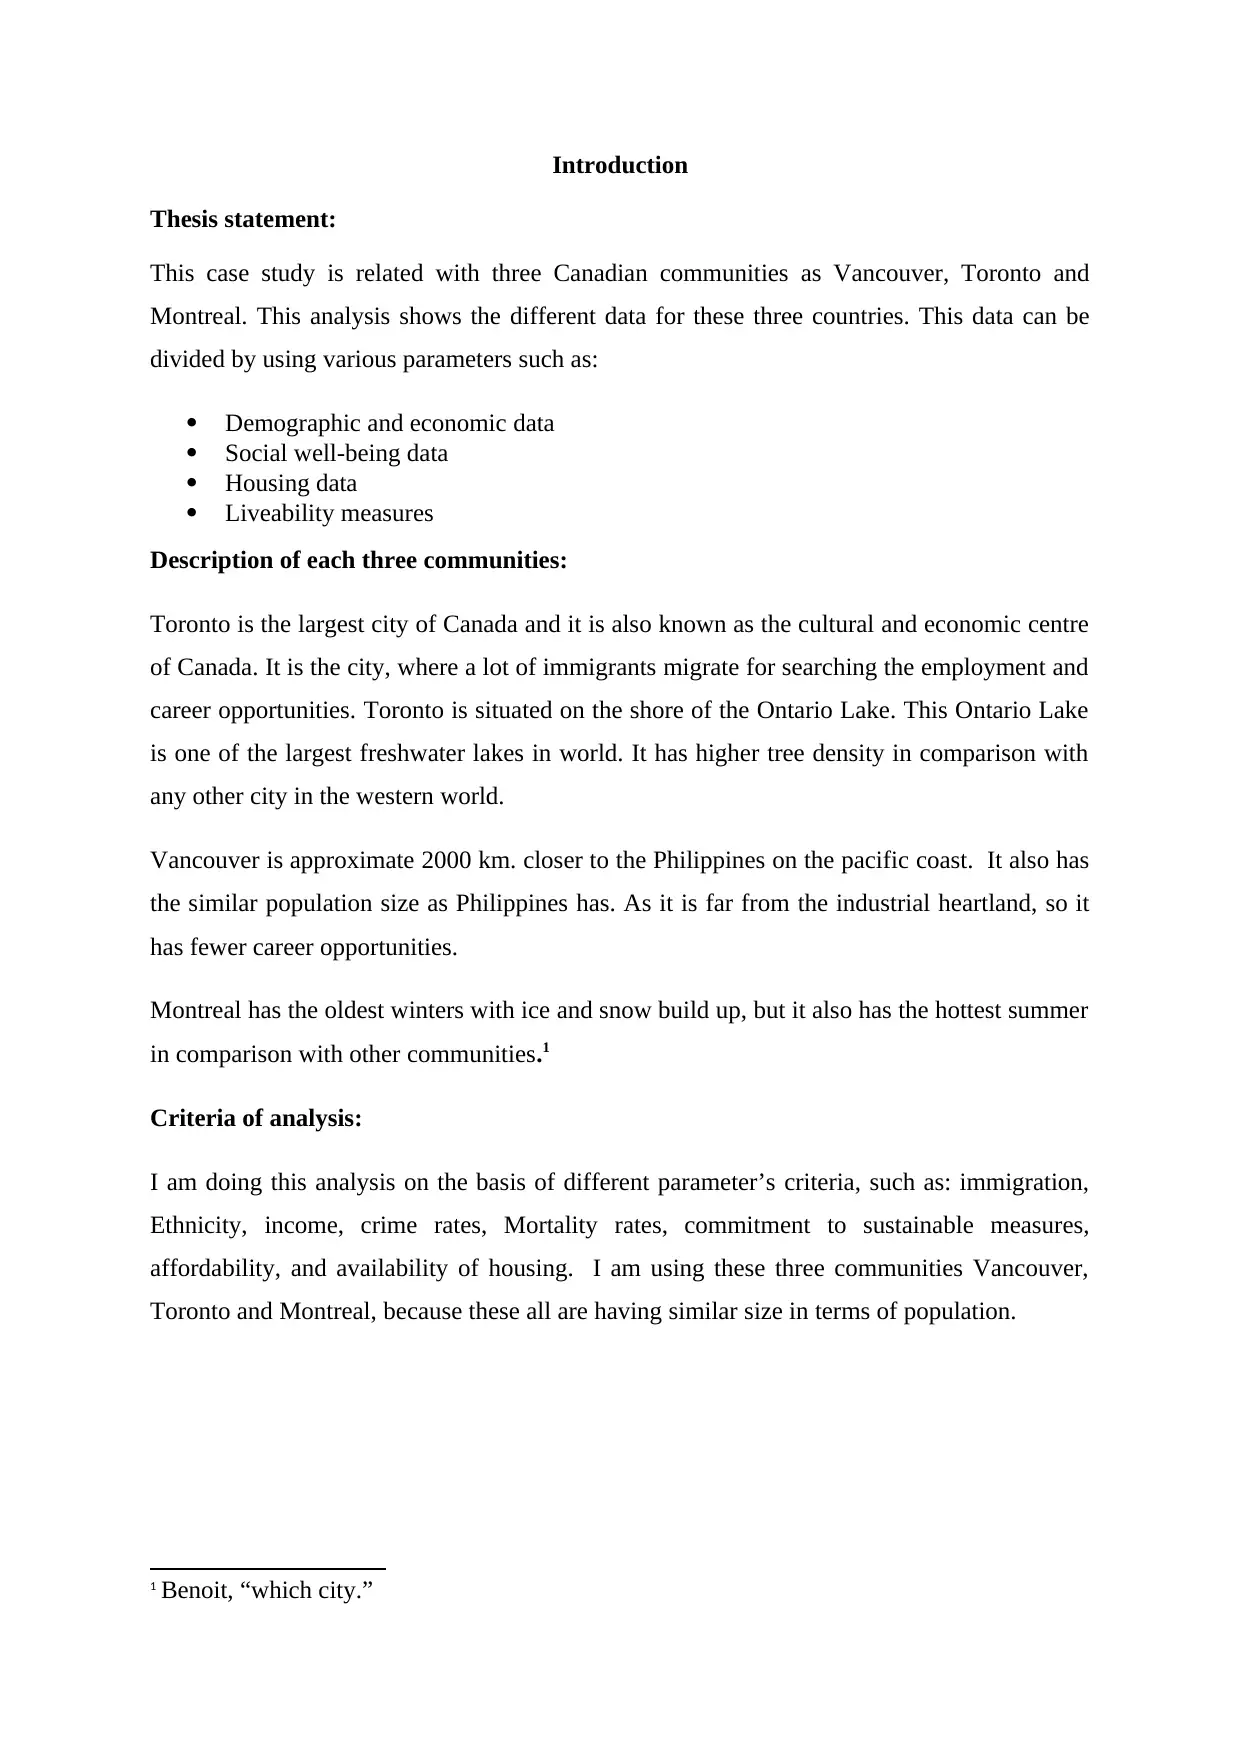
In the calculation of the total number of newcomers, Vancouver almost ranked up higher in
2006 and it could be possible to surpass that data in next decade. Due to this issue, Montreal
could lag behind due to many reasons in future. Such as, relatively slow economic growth;
and the pool of potential migrants from francophone countries is more restricted.
The enhanced concentration of immigrants in the large urban centres in Canada shows policy
issues for both the provincial and federal governments. Government official in Canada would
prefer a more balanced geographical distribution for immigrants. They would especially like
to direct recruits to smaller communities. These communities are losing population so these
communities require economic social revitalization. Some experts suggest that the broad
dispersion of immigrants would relieve the economic and social pressures which are
associated with the concentrations of immigrants in large metropolitan regions.2
Figure.1 Immigration for Toronto from various countries by Murdie, Robert A.
"Diversity and concentration in Canadian immigration: trends in Toronto, Montréal
and Vancouver, 1971–2006." (2011).
2 Murdie, “Diversity” 1971–2006.
Demographic and economic data:
In terms of immigration:
In the calculation of the total number of newcomers, Vancouver almost ranked up higher in
2006 and it could be possible to surpass that data in next decade. Due to this issue, Montreal
could lag behind due to many reasons in future. Such as, relatively slow economic growth;
and the pool of potential migrants from francophone countries is more restricted.
The enhanced concentration of immigrants in the large urban centres in Canada shows policy
issues for both the provincial and federal governments. Government official in Canada would
prefer a more balanced geographical distribution for immigrants. They would especially like
to direct recruits to smaller communities. These communities are losing population so these
communities require economic social revitalization. Some experts suggest that the broad
dispersion of immigrants would relieve the economic and social pressures which are
associated with the concentrations of immigrants in large metropolitan regions.2
Figure.1 Immigration for Toronto from various countries by Murdie, Robert A.
"Diversity and concentration in Canadian immigration: trends in Toronto, Montréal
and Vancouver, 1971–2006." (2011).
2 Murdie, “Diversity” 1971–2006.
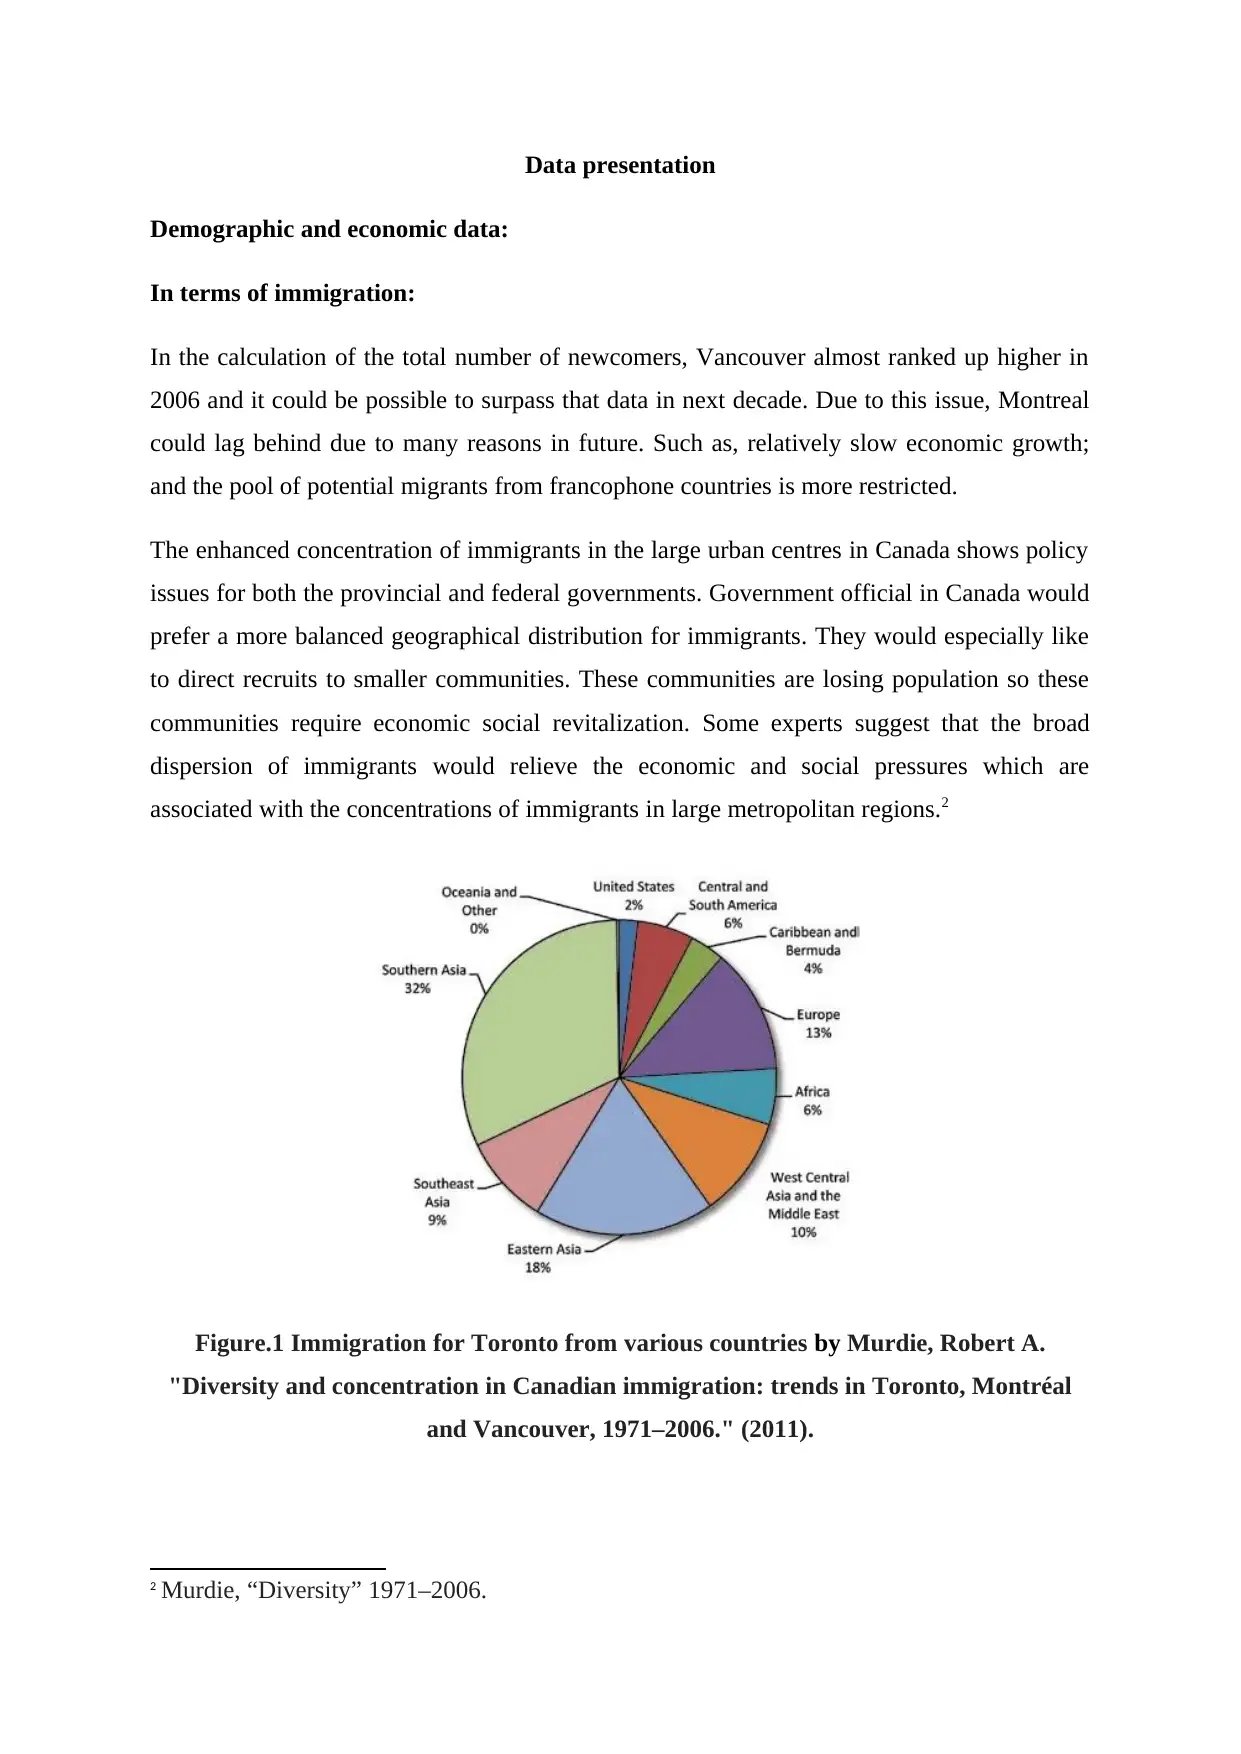
Figure.2 Immigration for Vancouver from various countries by Murdie, Robert A.
"Diversity and concentration in Canadian immigration: trends in Toronto, Montréal
and Vancouver, 1971–2006." (2011).
Figure.3 Immigration for Montreal from various countries by Murdie, Robert A.
"Diversity and concentration in Canadian immigration: trends in Toronto, Montréal
and Vancouver, 1971–2006." (2011).
In terms of Ethnicity:
In this analysis, I have used the data from an online marketplace of vacation rentals. This
market are having three features such as, detailed reviewing system existence, high frequency
of transaction and data panel dimensions.
"Diversity and concentration in Canadian immigration: trends in Toronto, Montréal
and Vancouver, 1971–2006." (2011).
Figure.3 Immigration for Montreal from various countries by Murdie, Robert A.
"Diversity and concentration in Canadian immigration: trends in Toronto, Montréal
and Vancouver, 1971–2006." (2011).
In terms of Ethnicity:
In this analysis, I have used the data from an online marketplace of vacation rentals. This
market are having three features such as, detailed reviewing system existence, high frequency
of transaction and data panel dimensions.
Secure Best Marks with AI Grader
Need help grading? Try our AI Grader for instant feedback on your assignments.
By using the fact that ratings provide the potential guests with data about the listing quality, I
build a credible statistical discrimination measure. Controlling for the rich set of
characteristics minimizes the ethnic prices gap at 3.2%. An additional review enhances the
daily cost more for the minority than for the majority hosts. By doing the parameters
estimation for this theoretical pricing model, I found that the statistical discrimination
accounts for most of the price differential at 2.5 percentage points. 3
City Observations Share
Montreal 104,726 3.04
Toronto 81,545 2.37
Vancouver 59,856 1.74
Table 1 Number of observations and shares in different provinces. 4
In terms of income:
On the basis of MLS home price index, nominal house prices have got increased in twice
during the time period of January 2005 to December 2016 in Canada. This variation can be
observed in the major metropolises such as in Vancouver, It is being enhanced with the rate
of 2.37 times and in Toronto enhancement is about 2.28 times. On other hand, High vitality
has provided the traditional belief that houses are secure and long- terms investments for the
people who want to receive a stable income. Canada has started to show the early signs for
experiencing the fluctuation of house prices, as the demand in house prices are growing
rapidly. This is because, Canada is a major metropolitan with a huge number of real estate
industry. These industries are going through a rapid commercialization on a worldwide
scale.5
The booming labour market also played a major role in development as income grew at the
rate of 5.1 % in the time period, when home prices did not vary at the national level.
3 Laouénan, “"Ethnic”.
4 Laouénan, “"Ethnic”.
5 Ma, “Fundamentals”.
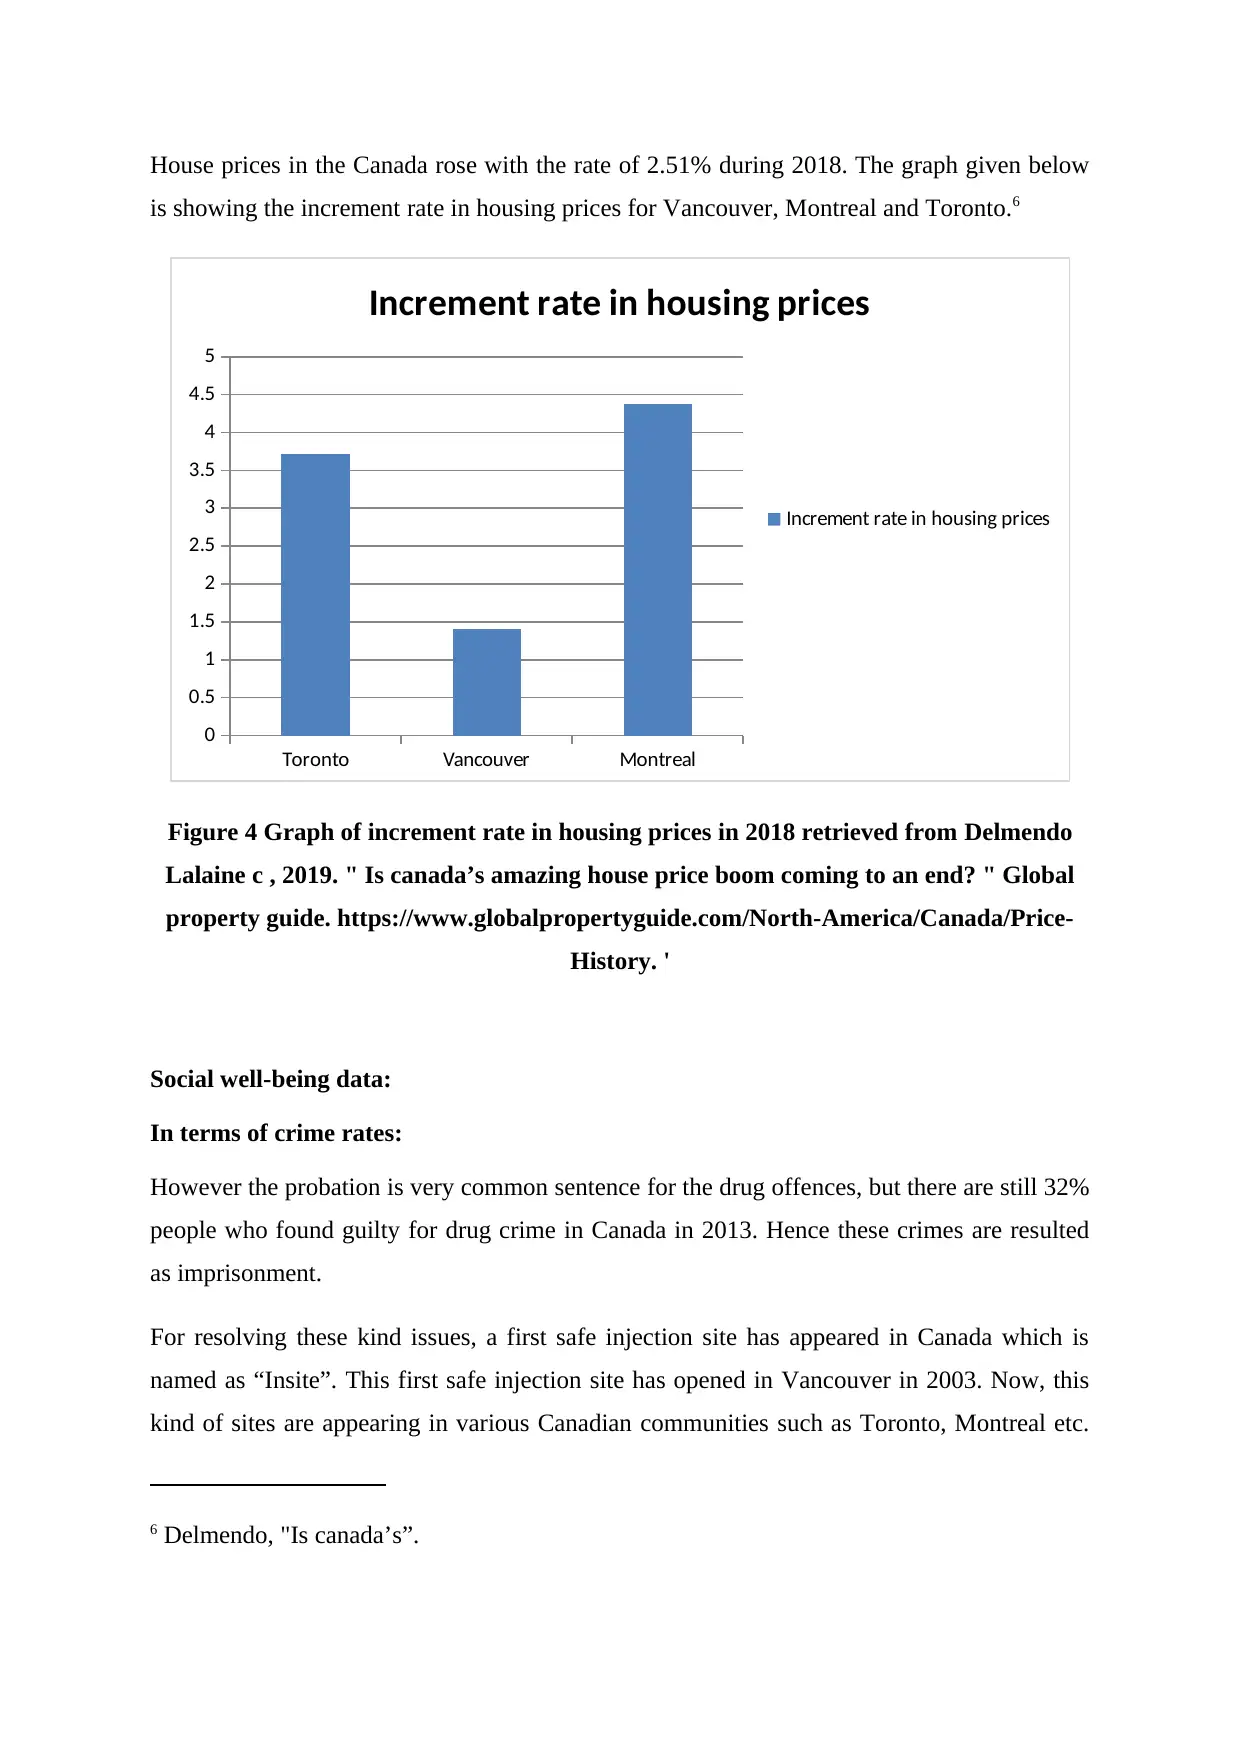
House prices in the Canada rose with the rate of 2.51% during 2018. The graph given below
is showing the increment rate in housing prices for Vancouver, Montreal and Toronto.6
Toronto Vancouver Montreal
0
0.5
1
1.5
2
2.5
3
3.5
4
4.5
5
Increment rate in housing prices
Increment rate in housing prices
Figure 4 Graph of increment rate in housing prices in 2018 retrieved from Delmendo
Lalaine c , 2019. " Is canada’s amazing house price boom coming to an end? " Global
property guide. https://www.globalpropertyguide.com/North-America/Canada/Price-
History. '
Social well-being data:
In terms of crime rates:
However the probation is very common sentence for the drug offences, but there are still 32%
people who found guilty for drug crime in Canada in 2013. Hence these crimes are resulted
as imprisonment.
For resolving these kind issues, a first safe injection site has appeared in Canada which is
named as “Insite”. This first safe injection site has opened in Vancouver in 2003. Now, this
kind of sites are appearing in various Canadian communities such as Toronto, Montreal etc.
6 Delmendo, "Is canada’s”.
these insites demonstrates the harm reduction as it aims to reduce the adverse health effects,
along with social and economic impacts of the drug usage.
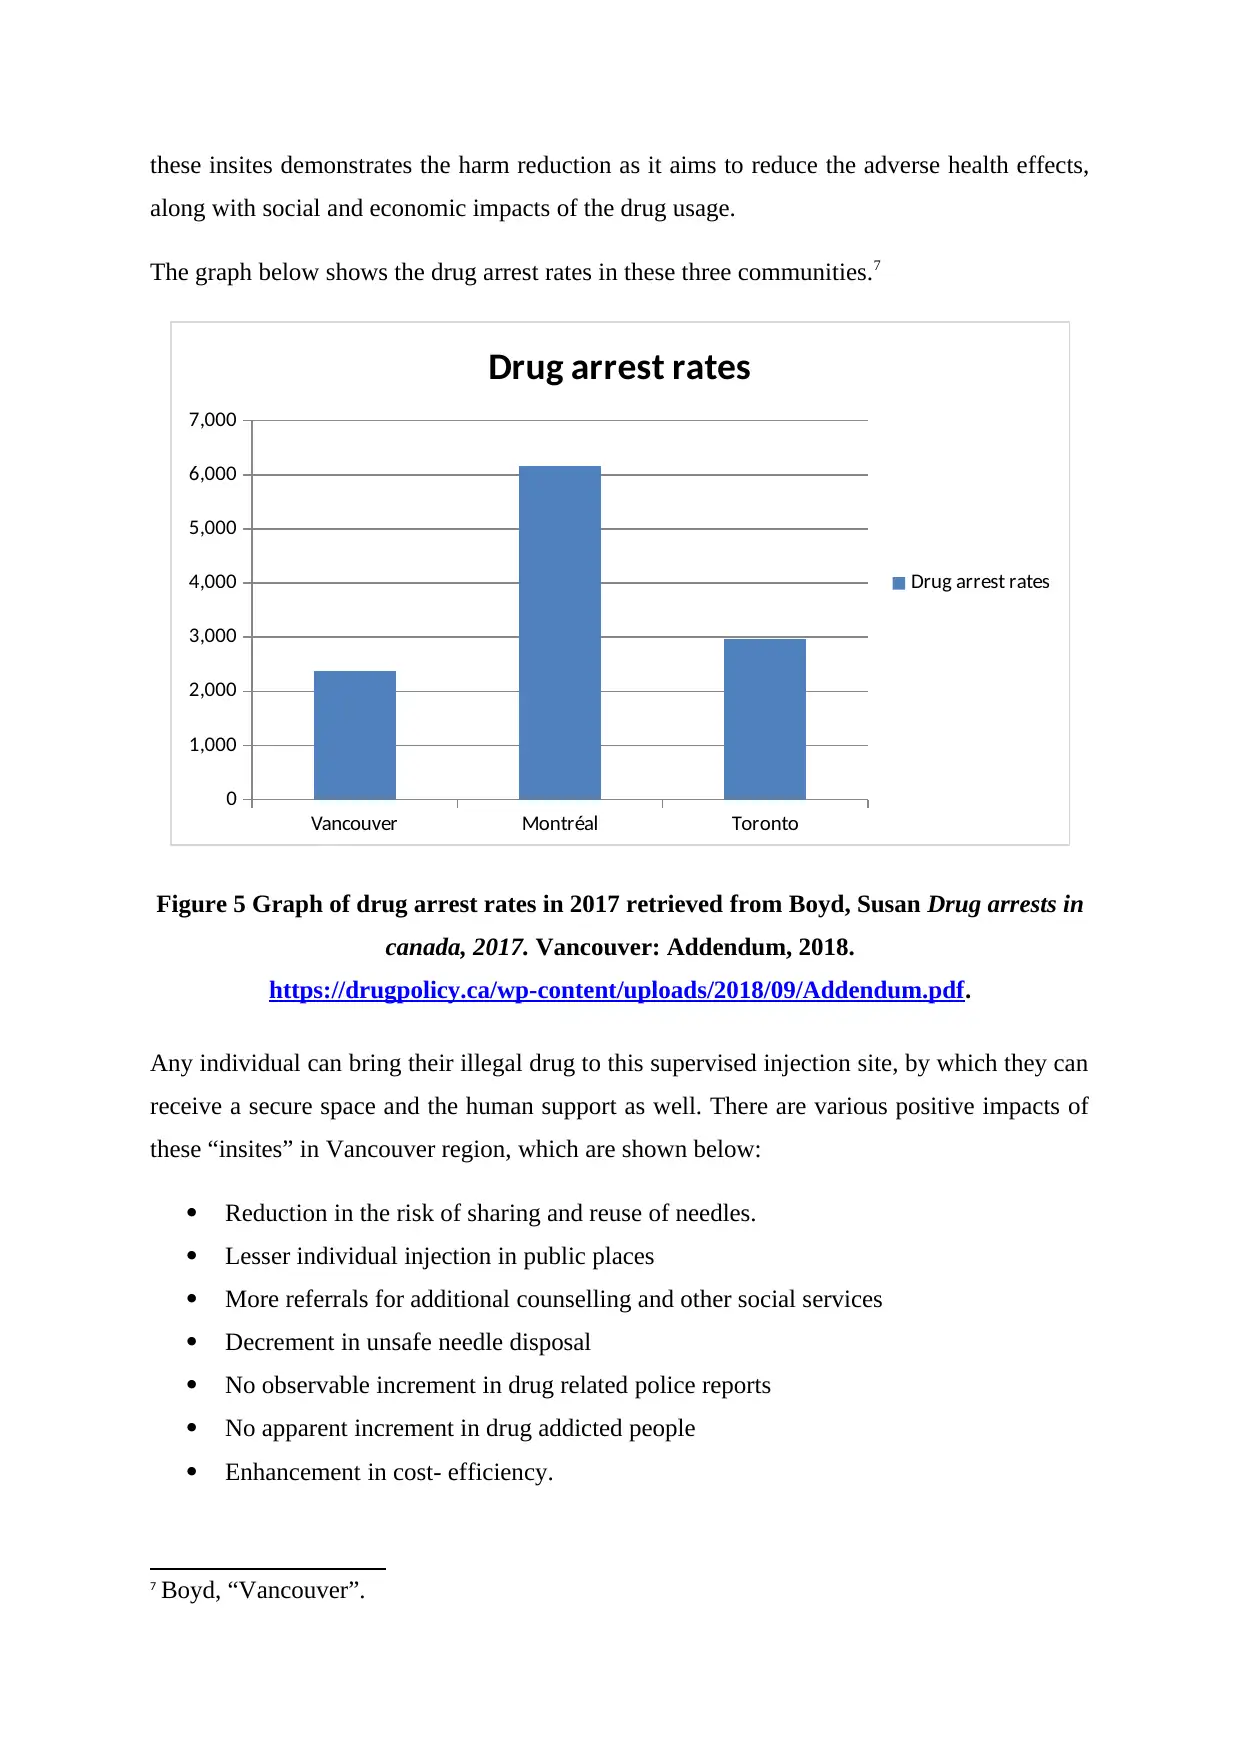
The graph below shows the drug arrest rates in these three communities.7
Vancouver Montréal Toronto
0
1,000
2,000
3,000
4,000
5,000
6,000
7,000
Drug arrest rates
Drug arrest rates
Figure 5 Graph of drug arrest rates in 2017 retrieved from Boyd, Susan Drug arrests in
canada, 2017. Vancouver: Addendum, 2018.
https://drugpolicy.ca/wp-content/uploads/2018/09/Addendum.pdf.
Any individual can bring their illegal drug to this supervised injection site, by which they can
receive a secure space and the human support as well. There are various positive impacts of
these “insites” in Vancouver region, which are shown below:
Reduction in the risk of sharing and reuse of needles.
Lesser individual injection in public places
More referrals for additional counselling and other social services
Decrement in unsafe needle disposal
No observable increment in drug related police reports
No apparent increment in drug addicted people
Enhancement in cost- efficiency.
7 Boyd, “Vancouver”.
along with social and economic impacts of the drug usage.
The graph below shows the drug arrest rates in these three communities.7
Vancouver Montréal Toronto
0
1,000
2,000
3,000
4,000
5,000
6,000
7,000
Drug arrest rates
Drug arrest rates
Figure 5 Graph of drug arrest rates in 2017 retrieved from Boyd, Susan Drug arrests in
canada, 2017. Vancouver: Addendum, 2018.
https://drugpolicy.ca/wp-content/uploads/2018/09/Addendum.pdf.
Any individual can bring their illegal drug to this supervised injection site, by which they can
receive a secure space and the human support as well. There are various positive impacts of
these “insites” in Vancouver region, which are shown below:
Reduction in the risk of sharing and reuse of needles.
Lesser individual injection in public places
More referrals for additional counselling and other social services
Decrement in unsafe needle disposal
No observable increment in drug related police reports
No apparent increment in drug addicted people
Enhancement in cost- efficiency.
7 Boyd, “Vancouver”.
Paraphrase This Document
Need a fresh take? Get an instant paraphrase of this document with our AI Paraphraser
In terms of prevented cases amount over last ten years, this facility has an estimation of
$20,100 for every case of HIV, and $444,500 for hepatitis C.
These savings are even greater, when it referred to MMT and safe injection practices usage.
The estimated number of prevented cases for HIV and Hepatitis C were 1517 and 68,
respectively.8
In terms of Mortality rates:
To accomplish the major intentions and the supplementary aims of the study, four indicators
from 2011 Wellbeing Toronto indicators were chosen from the data dashboards for
contrasting against the landscape ecology metrics. These chosen indicators related with the
home prices, assaults, Walk Score and premature mortality.9
Region Life expectancy rate of
Men
Life expectancy rate of
Women
Vancouver 80.4 84.6
Toronto 80.5 84.5
Montreal 80.4 84.2
Table.2 Life expectancy rates in different provinces10
Housing data:
In terms of availability:
By using the House price index, two distinct market regimes are introduced for housing data.
These regimes are a bull market regime and a bear market regime. In these regimes, bull
market regimes shows a longer period of rise in the prices and bear market regime shows a
longer period for prices fall. These two market regimes are obtained from the data-based
algorithm. The degree of synchronization is estimated by using Candelon method. This
method allows for an imperfect degree of multivariate synchronization between the market
cycles.
In conclusion, there is a small degree of synchronization for interest rates with the housing
markets in three largest Canadian metros such as, Vancouver, Toronto, and Montreal. These
communities show a lowest degree of synchronisation as 0.15.11
In terms of affordability:
8 Morris, “Situation tables”.
9 Shaker, “Showcasing” 1-24.
10 Shumanty, “Report”.
11 Ntantamis, “ measuring”.
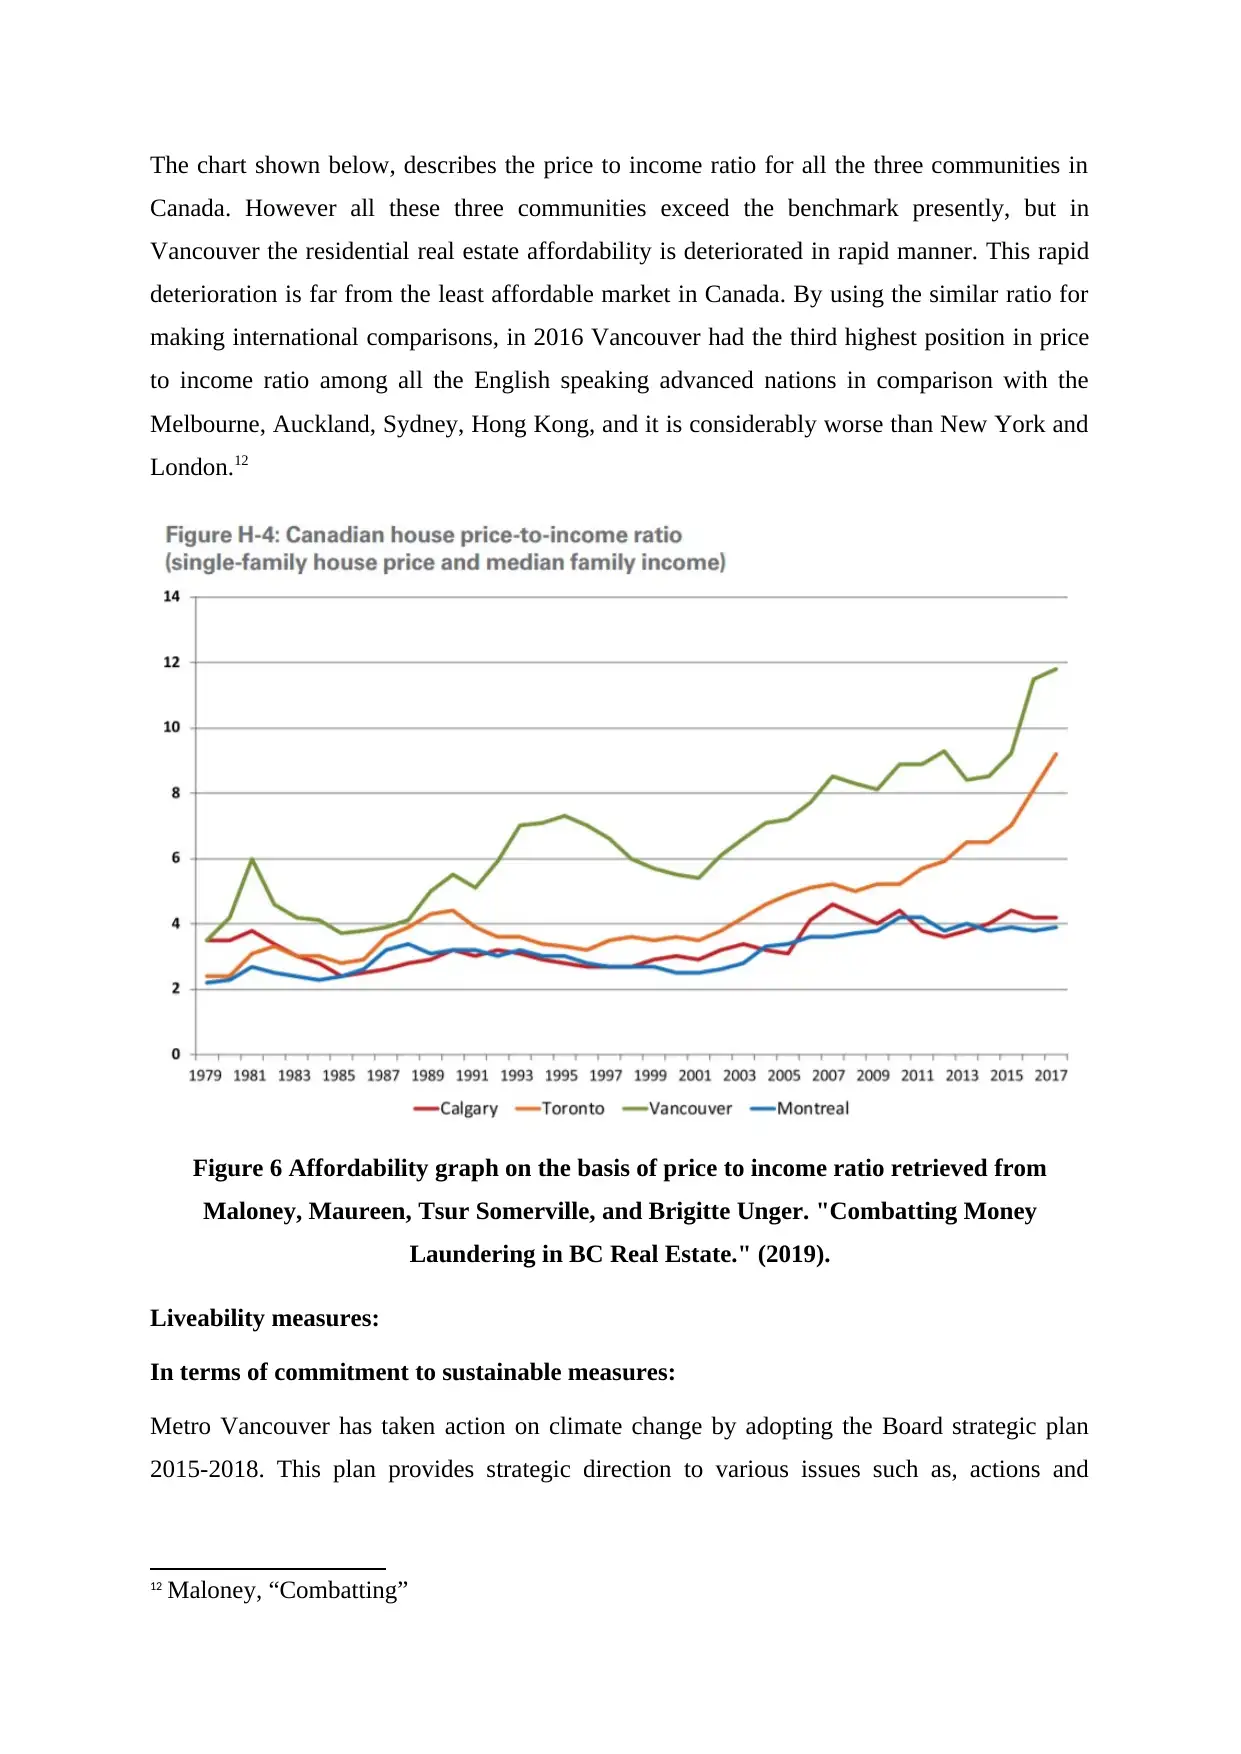
The chart shown below, describes the price to income ratio for all the three communities in
Canada. However all these three communities exceed the benchmark presently, but in
Vancouver the residential real estate affordability is deteriorated in rapid manner. This rapid
deterioration is far from the least affordable market in Canada. By using the similar ratio for
making international comparisons, in 2016 Vancouver had the third highest position in price
to income ratio among all the English speaking advanced nations in comparison with the
Melbourne, Auckland, Sydney, Hong Kong, and it is considerably worse than New York and
London.12
Figure 6 Affordability graph on the basis of price to income ratio retrieved from
Maloney, Maureen, Tsur Somerville, and Brigitte Unger. "Combatting Money
Laundering in BC Real Estate." (2019).
Liveability measures:
In terms of commitment to sustainable measures:
Metro Vancouver has taken action on climate change by adopting the Board strategic plan
2015-2018. This plan provides strategic direction to various issues such as, actions and
12 Maloney, “Combatting”
strategies into all Metro Vancouver functions for adapting and mitigating the climate change
and develop a regional climate action plan.
Additionally, the climate action plan of Metro Vancouver includes an action of establishing
an internal price for GHG emissions at a stag which would encourage the lower GHG
emitting projects”.
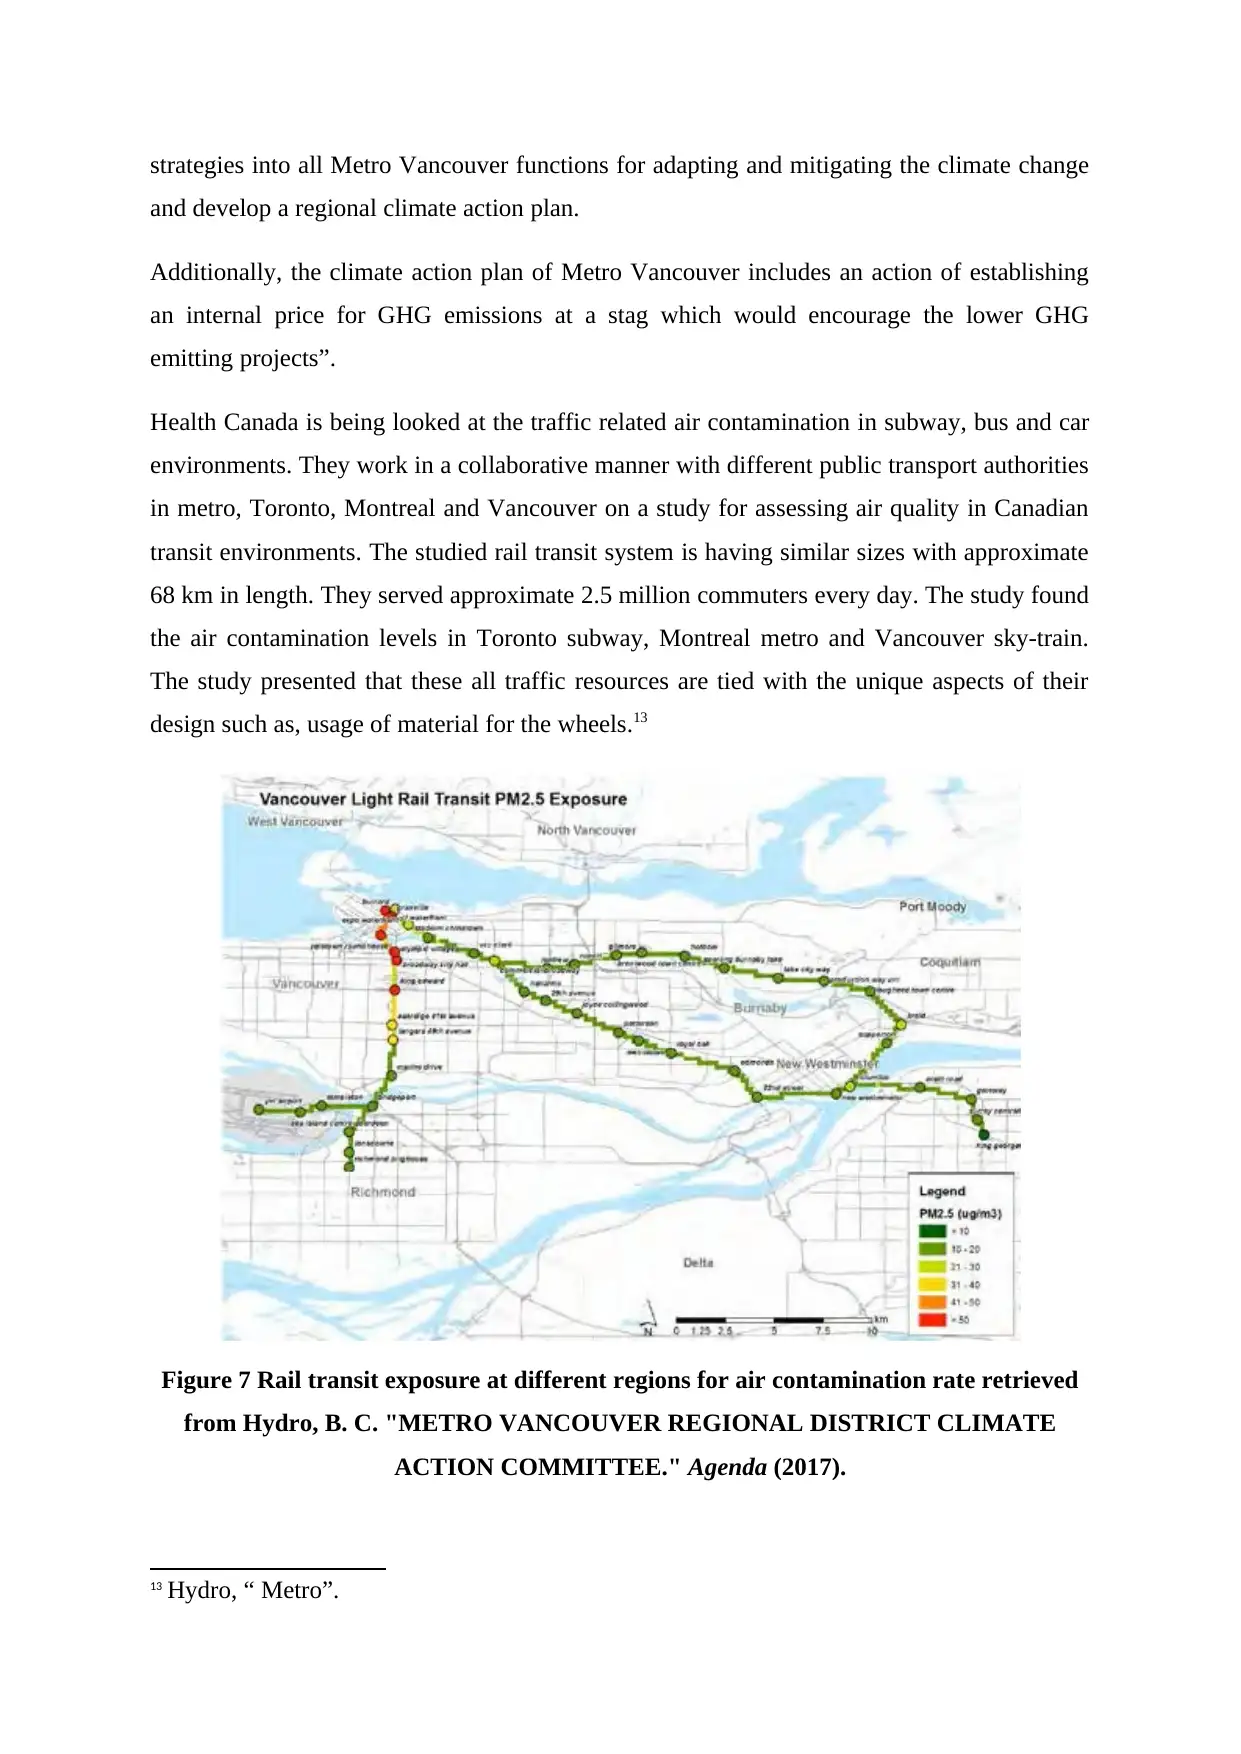
Health Canada is being looked at the traffic related air contamination in subway, bus and car
environments. They work in a collaborative manner with different public transport authorities
in metro, Toronto, Montreal and Vancouver on a study for assessing air quality in Canadian
transit environments. The studied rail transit system is having similar sizes with approximate
68 km in length. They served approximate 2.5 million commuters every day. The study found
the air contamination levels in Toronto subway, Montreal metro and Vancouver sky-train.
The study presented that these all traffic resources are tied with the unique aspects of their
design such as, usage of material for the wheels.13
Figure 7 Rail transit exposure at different regions for air contamination rate retrieved
from Hydro, B. C. "METRO VANCOUVER REGIONAL DISTRICT CLIMATE
ACTION COMMITTEE." Agenda (2017).
13 Hydro, “ Metro”.
and develop a regional climate action plan.
Additionally, the climate action plan of Metro Vancouver includes an action of establishing
an internal price for GHG emissions at a stag which would encourage the lower GHG
emitting projects”.
Health Canada is being looked at the traffic related air contamination in subway, bus and car
environments. They work in a collaborative manner with different public transport authorities
in metro, Toronto, Montreal and Vancouver on a study for assessing air quality in Canadian
transit environments. The studied rail transit system is having similar sizes with approximate
68 km in length. They served approximate 2.5 million commuters every day. The study found
the air contamination levels in Toronto subway, Montreal metro and Vancouver sky-train.
The study presented that these all traffic resources are tied with the unique aspects of their
design such as, usage of material for the wheels.13
Figure 7 Rail transit exposure at different regions for air contamination rate retrieved
from Hydro, B. C. "METRO VANCOUVER REGIONAL DISTRICT CLIMATE
ACTION COMMITTEE." Agenda (2017).
13 Hydro, “ Metro”.
Secure Best Marks with AI Grader
Need help grading? Try our AI Grader for instant feedback on your assignments.
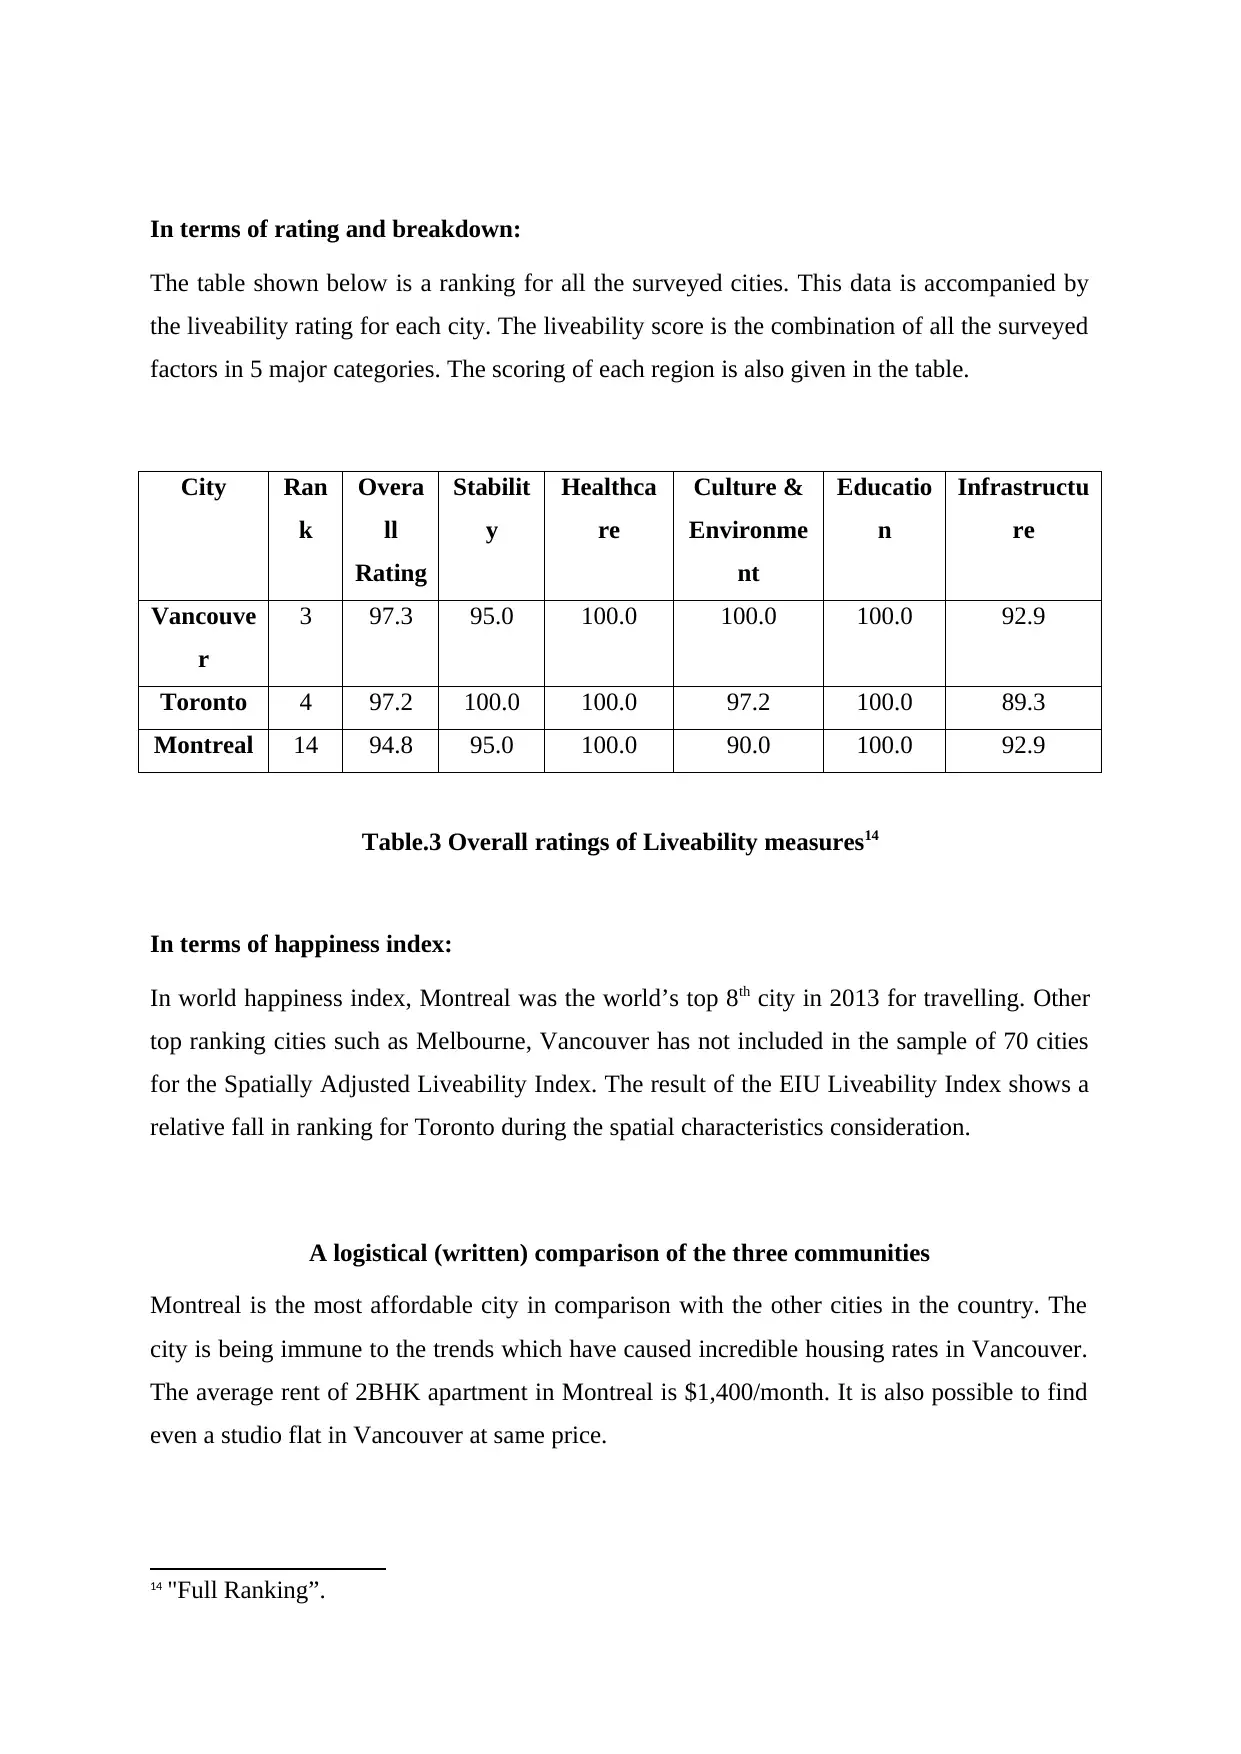
In terms of rating and breakdown:
The table shown below is a ranking for all the surveyed cities. This data is accompanied by
the liveability rating for each city. The liveability score is the combination of all the surveyed
factors in 5 major categories. The scoring of each region is also given in the table.
City Ran
k
Overa
ll
Rating
Stabilit
y
Healthca
re
Culture &
Environme
nt
Educatio
n
Infrastructu
re
Vancouve
r
3 97.3 95.0 100.0 100.0 100.0 92.9
Toronto 4 97.2 100.0 100.0 97.2 100.0 89.3
Montreal 14 94.8 95.0 100.0 90.0 100.0 92.9
Table.3 Overall ratings of Liveability measures14
In terms of happiness index:
In world happiness index, Montreal was the world’s top 8th city in 2013 for travelling. Other
top ranking cities such as Melbourne, Vancouver has not included in the sample of 70 cities
for the Spatially Adjusted Liveability Index. The result of the EIU Liveability Index shows a
relative fall in ranking for Toronto during the spatial characteristics consideration.
A logistical (written) comparison of the three communities
Montreal is the most affordable city in comparison with the other cities in the country. The
city is being immune to the trends which have caused incredible housing rates in Vancouver.
The average rent of 2BHK apartment in Montreal is $1,400/month. It is also possible to find
even a studio flat in Vancouver at same price.
14 "Full Ranking”.
Secondly the car insurance is really expensive in Vancouver. It could be easily around 300$
in a month. The car insurance in Montreal is very low as 75-80$ for a month. The expenses
such as food and public transit are very high in Vancouver.
The average home price in Toronto is 710,000$, while it is 349,000$ in Montreal. The
cheapest home in Toronto is priced at an average of 200000$. In Montreal, the average home
price can be as low as 80,000$.
Recommendation and rationale for most Liveable community
The rationale for most liveable community has shown on the basis of Economist’s Global
Liveability Index. This data shows the world’s 10 most liveable cities. Somehow, the
Montreal city didn’t come in this group. On the basis of top 10 Canadian contingents,
Vancouver finished at sixth position and Toronto is on seventh position.
Cities has scored on the basis of five main parameters as, stability (25%), health care (20%),
culture and environment (25%), education (10%) and infrastructure (20%).
Montreal has finished at the position of 131st. hence I can say that Vancouver is the most
liveable community in Canada.
As per 2019 liveability ranking for all the cities, Toronto is in top 19th rank for amenities and
commute, Montreal is on 296th rank for amenities and commute, and Vancouver is on 112th
rank for amenities and commute.15
Conclusion
An enhancing number of policy makers, residents and planners want their community to be
more liveable that is more capable to provide high quality of life to their residents. Green
mobility approach for example, biking, walking and public transit can have invaluable
contribution for making our communities more liveable.
Green mobility options can make different parameters to be possible for residents such as,
high density housing, sustainable modes of transport and mixed-use buildings and
neighbourhoods. This can be done by designed, planned, combined and managed the
community in strategic manner.
15 "Canada's Best”

This approach can also enhance the opportunities for residents to socialise and exercise,
which makes them physically and mentally active and fit. As the green mobility can also have
the positive impact on the environment quality in the communities so it makes possible for
resident to breathe in fresh air in comparison with the residents, who lives in communities
where the usage of automobiles is very high.
Improvements in well-being and health of the residents can further lead to the substantial
savings in the cost of health care for them separately and their community.
Paraphrase This Document
Need a fresh take? Get an instant paraphrase of this document with our AI Paraphraser
References
Benoit D Which city would be better, vancouver, montreal or toronto? [document on the
Internet]: Quora; 2016 [cited 13 March 2020]. Available from:
https://www.quora.com/Which-city-would-be-better-Vancouver-Montreal-or-Toronto
Boyd, Susan Drug arrests in canada, 2017. Vancouver: Addendum, 2018.
https://drugpolicy.ca/wp-content/uploads/2018/09/Addendum.pdf.
"Canada's Best Communities To Live In 2019: Full Ranking Of 415 Cities".
2019. Macleans.Ca. https://www.macleans.ca/best-communities-canada-2019-full-ranking-
tool/.
Delmendo Lalaine c , 2019. " Is canada’s amazing house price boom coming to an end? "
Global property guide. https://www.globalpropertyguide.com/North-America/Canada/Price-
History. '
"Full Ranking With Rating And Category Breakdown". 2015. Media.Heraldsun.Com.Au.
https://media.heraldsun.com.au/files/liveability.pdf.
Hydro, B. C. "METRO VANCOUVER REGIONAL DISTRICT CLIMATE ACTION
COMMITTEE." Agenda (2017).
Laouénan, Morgane, and Roland Rathelot. "Ethnic discrimination on an online marketplace
of vacation rental." (2017).
Ma, Yu, and Guiwen Bai. "FUNDAMENTALS AFFECTING CANADIAN HOUSING
MARKET." (2017).
Maloney, Maureen, Tsur Somerville, and Brigitte Unger. "Combatting Money Laundering in
BC Real Estate." (2019).
Morris, Victoria. "Situation tables as the new crime prevention: theoretical underpinnings,
strengths, weaknesses, and best practices." PhD diss., 2018.
Murdie, Robert A. "Diversity and concentration in Canadian immigration: trends in Toronto,
Montréal and Vancouver, 1971–2006." (2011).

Ntantamis, Christos. "Measuring the Synchronization of Bull and Bear Markets in Canadian
Housing Prices (Preliminary version)." (2016).
Shaker, Richard r., Joseph. Aversa, , Victoria. Papp, , Bryant m. Serre, et al. " Showcasing
relationships between neighborhood design and wellbeing toronto indicators ." Sustainability
12, no. 3 (2020):1-24.
Shumanty Rufteen , 2018. " Report on the demographic situation in canada mortality:
overview, 2014 to 2016 " Statistics canada.
https://www150.statcan.gc.ca/n1/pub/91-209-x/2018001/article/54957-eng.htm.
1 out of 15
Related Documents

Your All-in-One AI-Powered Toolkit for Academic Success.
+13062052269
info@desklib.com
Available 24*7 on WhatsApp / Email
![[object Object]](/_next/static/media/star-bottom.7253800d.svg)
Unlock your academic potential
© 2024 | Zucol Services PVT LTD | All rights reserved.