Livestock Greenhouse Gas Emission and Impact of Economic Policies
VerifiedAdded on 2023/06/12
|7
|2262
|131
AI Summary
This research essay discusses the contribution of livestock in greenhouse gas emission, externality analysis and impact on efficient market equilibrium, and policies to reduce GHG emissions from the livestock. It highlights the negative externality of GHG emissions and the impact on efficient market equilibrium. It also suggests policies such as livestock methane tax on producers, non-price policy on producers and introduction of new technology, and increased consumption of substitute of livestock meat to reduce GHG emissions.
Contribute Materials
Your contribution can guide someone’s learning journey. Share your
documents today.
Running head: ECONOMICS
Research essay on Livestock Greenhouse Gas Emission and Impact of Economic Policies
Name of the Student:
Name of the University:
Author note:
Research essay on Livestock Greenhouse Gas Emission and Impact of Economic Policies
Name of the Student:
Name of the University:
Author note:
Secure Best Marks with AI Grader
Need help grading? Try our AI Grader for instant feedback on your assignments.
1ECONOMICS
Section 1
Contribution of livestock in greenhouse gas emission
It is a surprising fact that livestock produce more greenhouse gases than driving cars. As per a
report by the Food and Agriculture Organization of the United Nations (Fao.org, 2017), it has been found
that the livestock sector produces more greenhouse gas emissions 18% more than the transport sector.
Hence, they have marked the livestock sector as a major threat to the environment. Herrero (2018) also
highlighted in his report in The Conversation that livestock farming contributes around 6 billion tonnes of
the greenhouse gases in the environment every year. It is a very concerning issue as the greenhouse
gases, that is, carbon dioxide, nitrous oxide and methane, are hugely responsible for global warming.
Apart from energy sector, industries and transport sector, the livestock sector has also entered into the list
of sources that emit the harmful greenhouse gases to the atmosphere (Gerber et al., 2013).
In Australia, the direct greenhouse gas emissions from the livestock sector accounts for almost
70% of the total emissions from agricultural sector, and 11% of the total emission of the nation (). Thus,
the livestock sector holds the third position among the largest source of greenhouse gases in Australia,
following the energy and transport sector. This sector produces 56% methane (CH4) and 73% nitrous
oxide (N2O) of the total emissions of Australia (Agric.wa.gov.au., 2017). On the other hand, according to
FAO (2017), the global emission of greenhouse gases from the livestock was about 6.53 gigatonnes of
carbon di-oxide (CO2) per year for 2005 reference period. This was about 15.5% of all anthropogenic
GHG emission, which was around 42 gigatonnes in total for the same period. The transport sector in
comparison produced 6.45 gigatonnes of CO2 equivalent. However, the emission of nitrous oxide is far
more than that of CO2 emission from the livestock. It accounts for almost 30% of the total emissions by
the livestock (knoema.com, 2018).
Section 2
Externality analysis and impact on efficient market equilibrium
Economic efficiency or efficient market equilibrium refers to a situation in the market, in which it is
impossible to make one person better off without making another worse off (Jarrow & Larsson, 2012). In
terms of production of goods and services, it can be said that, a market becomes efficient only when the
optimal level of goods and services are produced with a given amount of resources, and no extra unit of
output can be produced without increasing the units of inputs (Stiglitz & Rosengard, 2015). Thus, in
efficient market, optimal allocation of resources happens.
However, there are few obstacles, which prevent the markets from achieving efficiency and
externalities are one of them. Externalities are the benefits and costs, not borne by the person or
organization conducting the economic activity, and are granted to or imposed on others in the society
(Rezai, Foley & Taylor, 2016). There are positive and negative externalities. The greenhouse gas
emission is a negative externality, as it is created from economic activities and contributes largely in
global warming, which is not good for the society and the environment. The cost to the society in this case
2ECONOMICS
PMC
SMC
PMB = SMB
Price,
MCs,
MBs
Q1 Q* Quantity
Deadweight loss
P1
P*
Negative externality
per unit
E*
E1 A
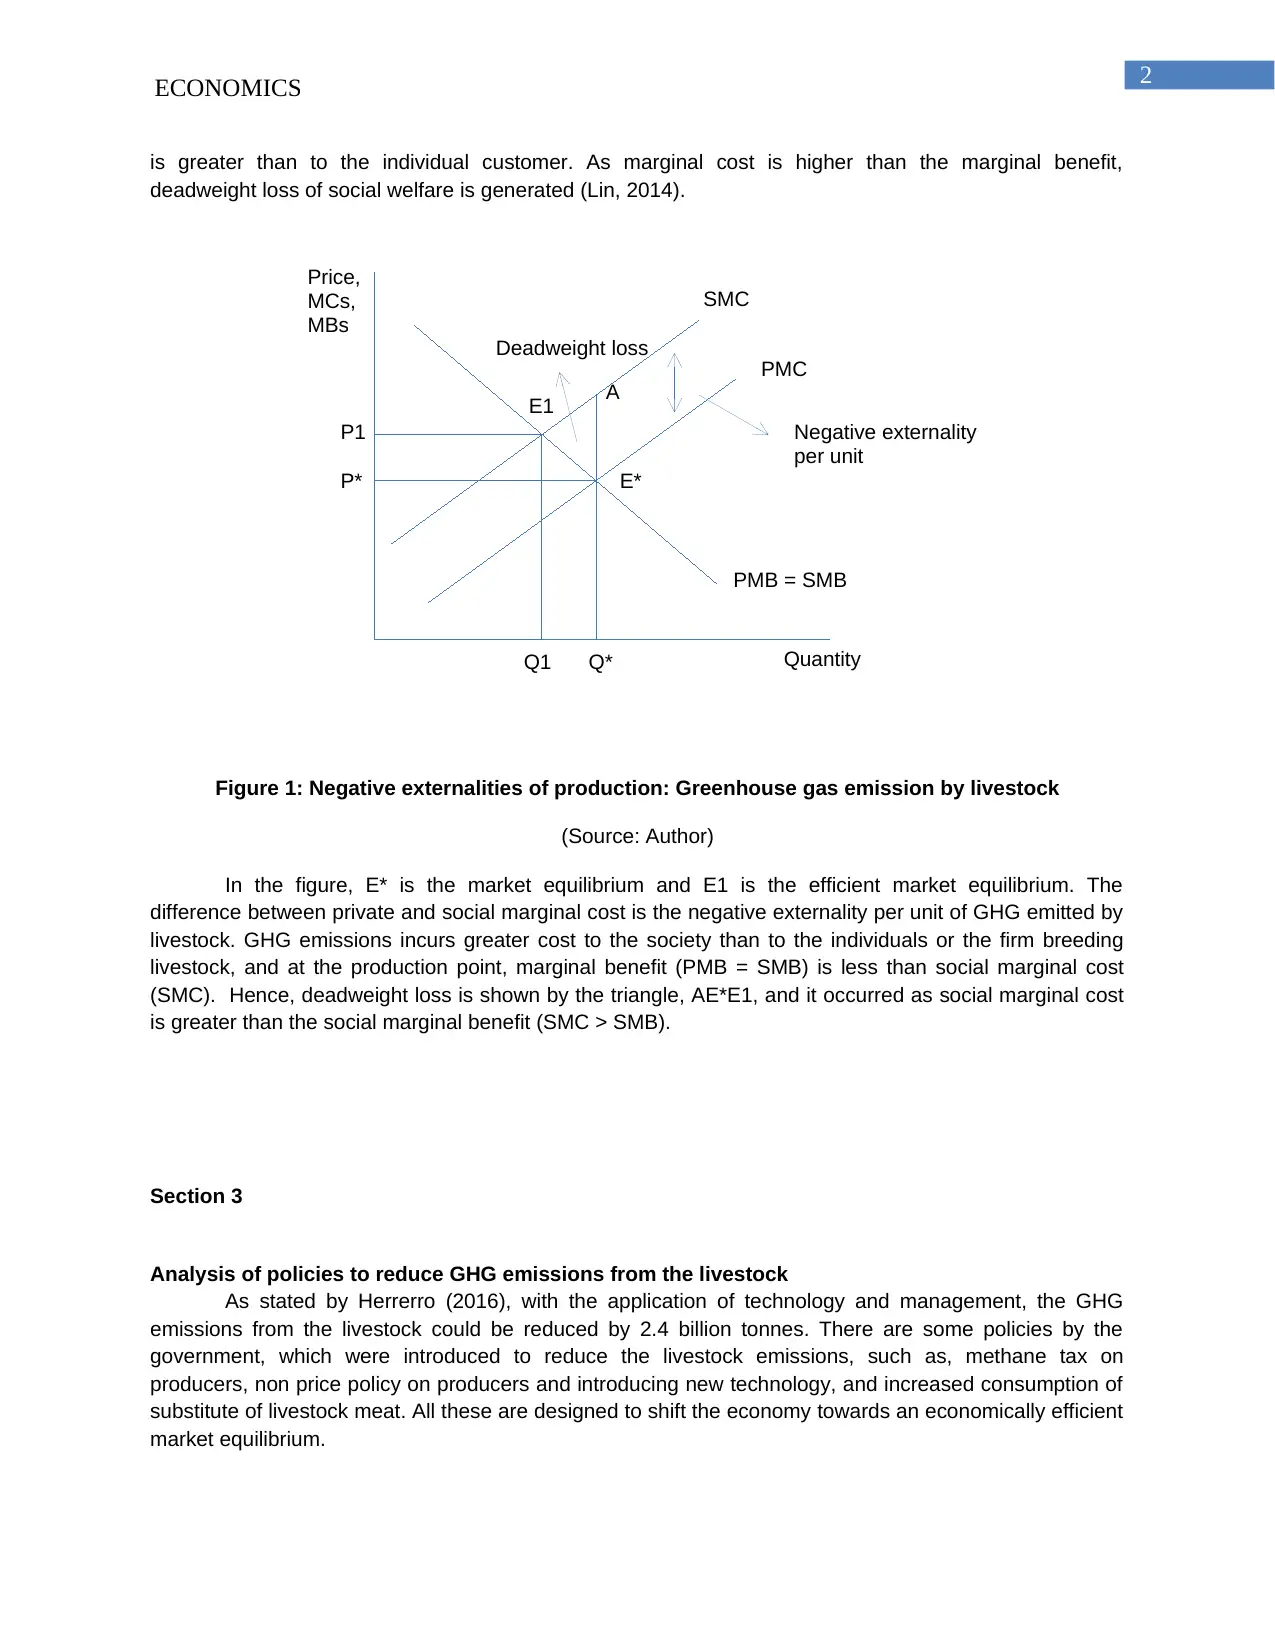
is greater than to the individual customer. As marginal cost is higher than the marginal benefit,
deadweight loss of social welfare is generated (Lin, 2014).
Figure 1: Negative externalities of production: Greenhouse gas emission by livestock
(Source: Author)
In the figure, E* is the market equilibrium and E1 is the efficient market equilibrium. The
difference between private and social marginal cost is the negative externality per unit of GHG emitted by
livestock. GHG emissions incurs greater cost to the society than to the individuals or the firm breeding
livestock, and at the production point, marginal benefit (PMB = SMB) is less than social marginal cost
(SMC). Hence, deadweight loss is shown by the triangle, AE*E1, and it occurred as social marginal cost
is greater than the social marginal benefit (SMC > SMB).
Section 3
Analysis of policies to reduce GHG emissions from the livestock
As stated by Herrerro (2016), with the application of technology and management, the GHG
emissions from the livestock could be reduced by 2.4 billion tonnes. There are some policies by the
government, which were introduced to reduce the livestock emissions, such as, methane tax on
producers, non price policy on producers and introducing new technology, and increased consumption of
substitute of livestock meat. All these are designed to shift the economy towards an economically efficient
market equilibrium.
PMC
SMC
PMB = SMB
Price,
MCs,
MBs
Q1 Q* Quantity
Deadweight loss
P1
P*
Negative externality
per unit
E*
E1 A
is greater than to the individual customer. As marginal cost is higher than the marginal benefit,
deadweight loss of social welfare is generated (Lin, 2014).
Figure 1: Negative externalities of production: Greenhouse gas emission by livestock
(Source: Author)
In the figure, E* is the market equilibrium and E1 is the efficient market equilibrium. The
difference between private and social marginal cost is the negative externality per unit of GHG emitted by
livestock. GHG emissions incurs greater cost to the society than to the individuals or the firm breeding
livestock, and at the production point, marginal benefit (PMB = SMB) is less than social marginal cost
(SMC). Hence, deadweight loss is shown by the triangle, AE*E1, and it occurred as social marginal cost
is greater than the social marginal benefit (SMC > SMB).
Section 3
Analysis of policies to reduce GHG emissions from the livestock
As stated by Herrerro (2016), with the application of technology and management, the GHG
emissions from the livestock could be reduced by 2.4 billion tonnes. There are some policies by the
government, which were introduced to reduce the livestock emissions, such as, methane tax on
producers, non price policy on producers and introducing new technology, and increased consumption of
substitute of livestock meat. All these are designed to shift the economy towards an economically efficient
market equilibrium.
3ECONOMICS
Private cost before tax
Social and private cost after
tax
Demand
Price
QE QM Quantity
Market
equilibrium after
tax = efficient
equilibrium
PE
PM Market equilibrium
before tax
Tax on methane
emission by livestock
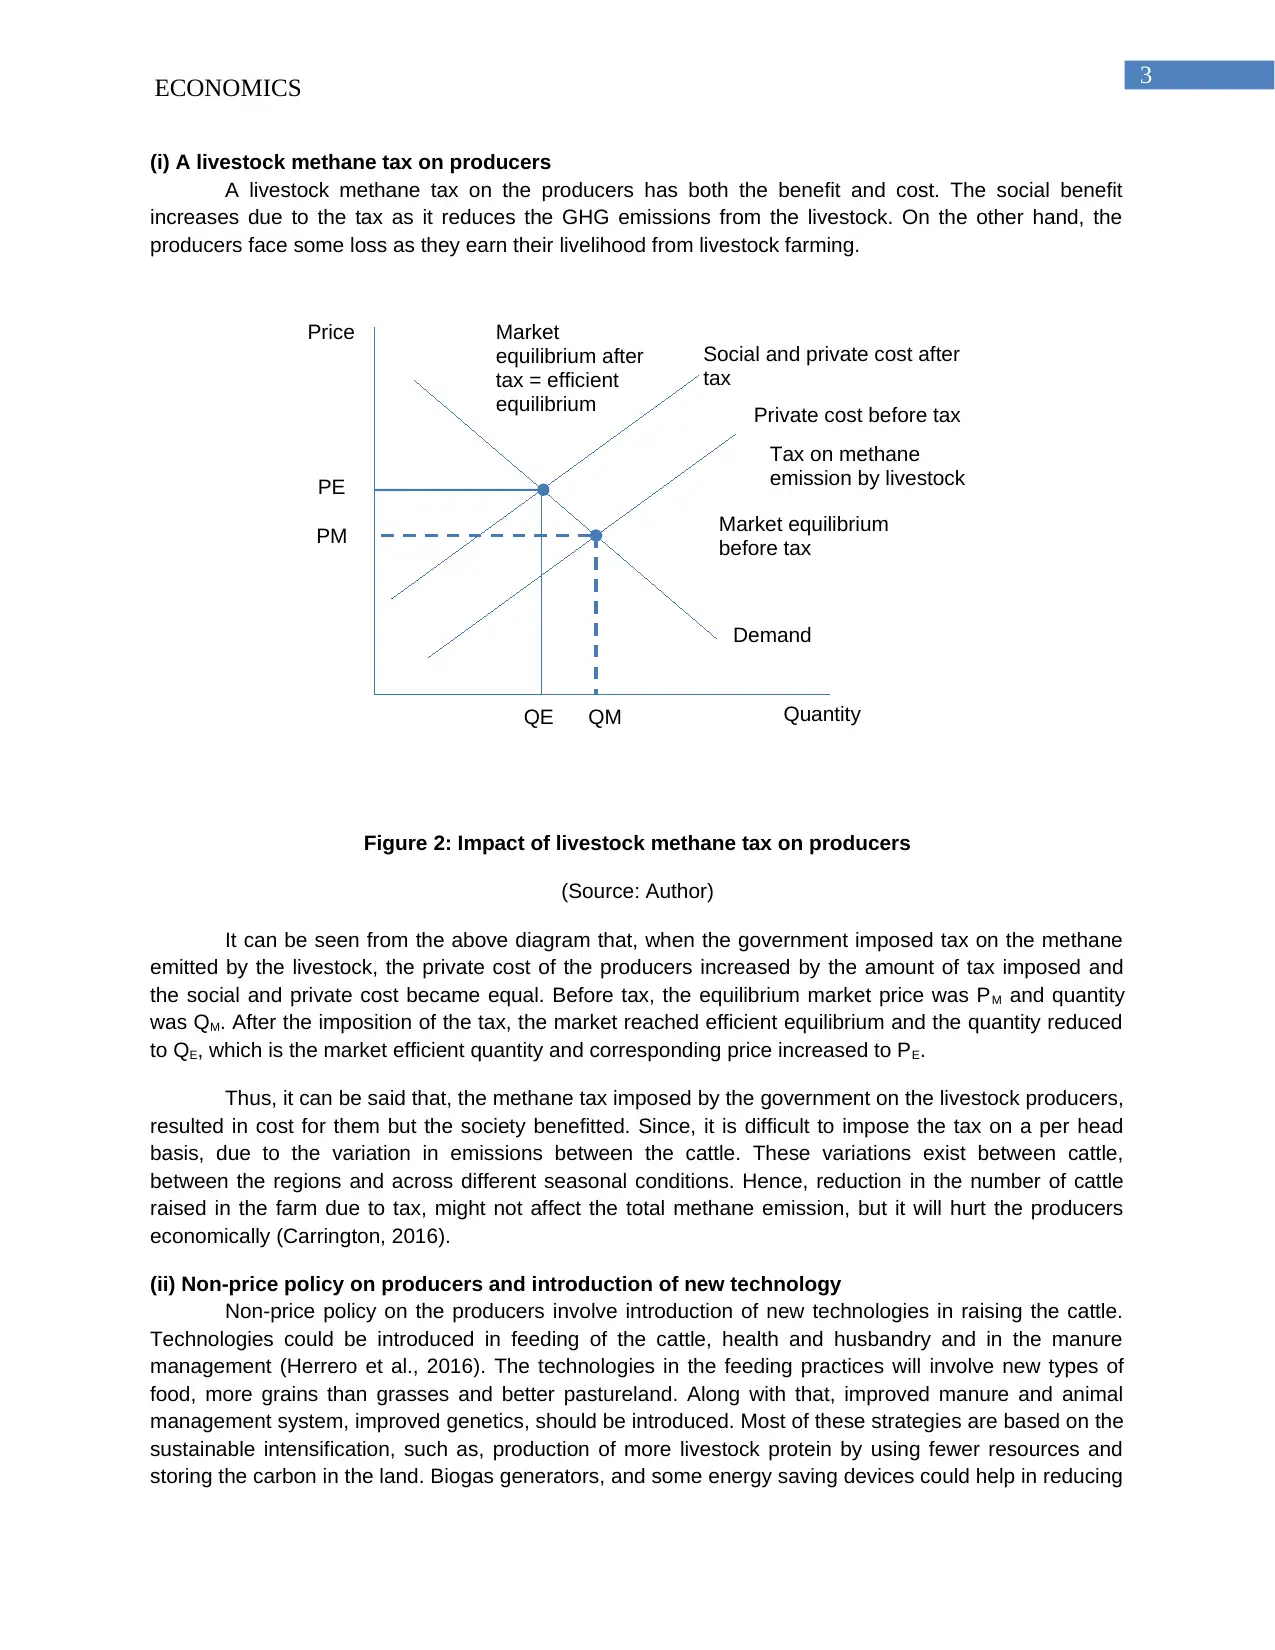
(i) A livestock methane tax on producers
A livestock methane tax on the producers has both the benefit and cost. The social benefit
increases due to the tax as it reduces the GHG emissions from the livestock. On the other hand, the
producers face some loss as they earn their livelihood from livestock farming.
Figure 2: Impact of livestock methane tax on producers
(Source: Author)
It can be seen from the above diagram that, when the government imposed tax on the methane
emitted by the livestock, the private cost of the producers increased by the amount of tax imposed and
the social and private cost became equal. Before tax, the equilibrium market price was PM and quantity
was QM. After the imposition of the tax, the market reached efficient equilibrium and the quantity reduced
to QE, which is the market efficient quantity and corresponding price increased to PE.
Thus, it can be said that, the methane tax imposed by the government on the livestock producers,
resulted in cost for them but the society benefitted. Since, it is difficult to impose the tax on a per head
basis, due to the variation in emissions between the cattle. These variations exist between cattle,
between the regions and across different seasonal conditions. Hence, reduction in the number of cattle
raised in the farm due to tax, might not affect the total methane emission, but it will hurt the producers
economically (Carrington, 2016).
(ii) Non-price policy on producers and introduction of new technology
Non-price policy on the producers involve introduction of new technologies in raising the cattle.
Technologies could be introduced in feeding of the cattle, health and husbandry and in the manure
management (Herrero et al., 2016). The technologies in the feeding practices will involve new types of
food, more grains than grasses and better pastureland. Along with that, improved manure and animal
management system, improved genetics, should be introduced. Most of these strategies are based on the
sustainable intensification, such as, production of more livestock protein by using fewer resources and
storing the carbon in the land. Biogas generators, and some energy saving devices could help in reducing
Private cost before tax
Social and private cost after
tax
Demand
Price
QE QM Quantity
Market
equilibrium after
tax = efficient
equilibrium
PE
PM Market equilibrium
before tax
Tax on methane
emission by livestock
(i) A livestock methane tax on producers
A livestock methane tax on the producers has both the benefit and cost. The social benefit
increases due to the tax as it reduces the GHG emissions from the livestock. On the other hand, the
producers face some loss as they earn their livelihood from livestock farming.
Figure 2: Impact of livestock methane tax on producers
(Source: Author)
It can be seen from the above diagram that, when the government imposed tax on the methane
emitted by the livestock, the private cost of the producers increased by the amount of tax imposed and
the social and private cost became equal. Before tax, the equilibrium market price was PM and quantity
was QM. After the imposition of the tax, the market reached efficient equilibrium and the quantity reduced
to QE, which is the market efficient quantity and corresponding price increased to PE.
Thus, it can be said that, the methane tax imposed by the government on the livestock producers,
resulted in cost for them but the society benefitted. Since, it is difficult to impose the tax on a per head
basis, due to the variation in emissions between the cattle. These variations exist between cattle,
between the regions and across different seasonal conditions. Hence, reduction in the number of cattle
raised in the farm due to tax, might not affect the total methane emission, but it will hurt the producers
economically (Carrington, 2016).
(ii) Non-price policy on producers and introduction of new technology
Non-price policy on the producers involve introduction of new technologies in raising the cattle.
Technologies could be introduced in feeding of the cattle, health and husbandry and in the manure
management (Herrero et al., 2016). The technologies in the feeding practices will involve new types of
food, more grains than grasses and better pastureland. Along with that, improved manure and animal
management system, improved genetics, should be introduced. Most of these strategies are based on the
sustainable intensification, such as, production of more livestock protein by using fewer resources and
storing the carbon in the land. Biogas generators, and some energy saving devices could help in reducing
Secure Best Marks with AI Grader
Need help grading? Try our AI Grader for instant feedback on your assignments.
4ECONOMICS
the GHG emissions from the livestock by around 30% as those are more efficient and reduce energy
waste (Tran, 2013). Thus, the new technologies of production would benefit the society at large.
However, the cost of developing or adopting the new technologies is high for the small and
medium scale farmers raising the livestock. Hence, the government should provide large mitigations
benefits and abatement subsidies that would help the farmers to balance their cost of production of
livestock by adopting new technology.
(iii) Increased consumption of livestock meat substitutes
Herrero (2018) states that, eating less livestock meat around the world could result in reduction of
GHG emissions up to 5-6 billion tonnes. This indicates that human behavior should be influenced. This
would be a huge challenge to the world as it involves a dietary change. However, it is found that Europe
has been developing alternative protein sources as the consumers are turning towards more healthier
and environmentally friendly food. The food makers are also working to invent and innovate for producing
substitutes of livestock meat. The meat substitute market across the world is expected to grow by almost
84% by 2020 and Europe is the biggest market for meat substitutes, contributing 39% of the global sales
(Askew, 2017).
Another report by Oswald (2017) shows that, the scientists are inventing steaks that are grown in
the lab, and blood made from plants to make substitutes for the livestock meat. Many companies, such
as, Beyond Meat and Tyson, with a 5% stake in it, have put money and effort for making plant based
burger patties. They do not grow the fake meat in the lab, but they use specific combination of proteins
from the plants for creating surprisingly burger patty that looks like meat.
Hence, it can be said that Australian government should take measures in encouraging the food
companies in making alternative meat. This will have a positive impact on the environment, but will have a
negative impact of the cattle producers.
5ECONOMICS
References
Agric.wa.gov.au. (2017). How Australia accounts for agricultural greenhouse gas emissions | Agriculture
and Food. Agric.wa.gov.au. Retrieved 28 April 2018, from https://www.agric.wa.gov.au/climate-
change/how-australia-accounts-agricultural-greenhouse-gas-emissions
Askew, K. (2017). Europe leads in innovation as meat-free demand grows. foodnavigator.com. Retrieved
28 April 2018, from https://www.foodnavigator.com/Article/2017/08/24/Europe-leads-in-
innovation-as-meat-free-demand-grows
Carrington, D. (2016). Tax meat and dairy to cut emissions and save lives, study urges. the Guardian.
Retrieved 28 April 2018, from https://www.theguardian.com/environment/2016/nov/07/tax-meat-
and-dairy-to-cut-emissions-and-save-lives-study-urges
Fao.org. (2017). FAO - News Article: Key facts and findings. Fao.org. Retrieved 28 April 2018, from
http://www.fao.org/news/story/en/item/197623/icode/
Gerber, P.J., Steinfeld, H., Henderson, B., Mottet, A., Opio, C., Dijkman, J., Falcucci, A. and Tempio, G.
(2013). Tackling climate change through livestock – A global assessment of emissions and
mitigation opportunities. Food and Agriculture Organization of the United Nations (FAO), Rome.
Retrieved from http://www.fao.org/docrep/018/i3437e/i3437e.pdf
Herrero, M. (2016). To reduce greenhouse gases from cows and sheep, we need to look at the big
picture. The Conversation. Retrieved 28 April 2018, from https://theconversation.com/to-reduce-
greenhouse-gases-from-cows-and-sheep-we-need-to-look-at-the-big-picture-56509
Herrero, M., Henderson, B., Havlík, P., Thornton, P. K., Conant, R. T., Smith, P., . . . Stehfest, E. (2016).
Greenhouse gas mitigation potentials in the livestock sector. Nature Climate Change, 6, 452. doi:
10.1038/nclimate2925. Retrieved from https://www.nature.com/articles/nclimate2925
Jarrow, R. A., & Larsson, M. (2012). The meaning of market efficiency. Mathematical Finance, 22(1), 1-
30.
knoema.com. (2018). Global Greenhouse Gas Emissions from Livestock. Knoema. Retrieved 28 April
2018, from https://knoema.com/infographics/maodxhb/global-greenhouse-gas-emissions-from-
livestock
Lin, S. A. (Ed.). (2014). Theory and measurement of economic externalities. Academic Press.
Oswald, E. (2017). From lab-grown steaks to plant-based blood, science is taking the animal out of
meat. Digital Trends. Retrieved 28 April 2018, from https://www.digitaltrends.com/features/the-
future-of-food-meat-alternatives/
Rezai, A., Foley, D. K., & Taylor, L. (2016). Global warming and economic externalities. In The
Economics of the Global Environment (pp. 447-470). Springer, Cham.
6ECONOMICS
Stiglitz, J. E., & Rosengard, J. K. (2015). Economics of the Public Sector: Fourth International Student
Edition. WW Norton & Company.
Tran, M. (2013). Greenhouse gas emissions from livestock can be cut by 30%, says FAO. the Guardian.
Retrieved 28 April 2018, from
https://www.theguardian.com/global-development/2013/sep/26/greenhouse-gas-emissions-
livestock
1 out of 7
Related Documents


Your All-in-One AI-Powered Toolkit for Academic Success.
+13062052269
info@desklib.com
Available 24*7 on WhatsApp / Email
![[object Object]](/_next/static/media/star-bottom.7253800d.svg)
Unlock your academic potential
© 2024 | Zucol Services PVT LTD | All rights reserved.