Deflection Analysis and Bending Moment of Reinforced Concrete Beams
VerifiedAdded on 2022/09/05
|30
|937
|47
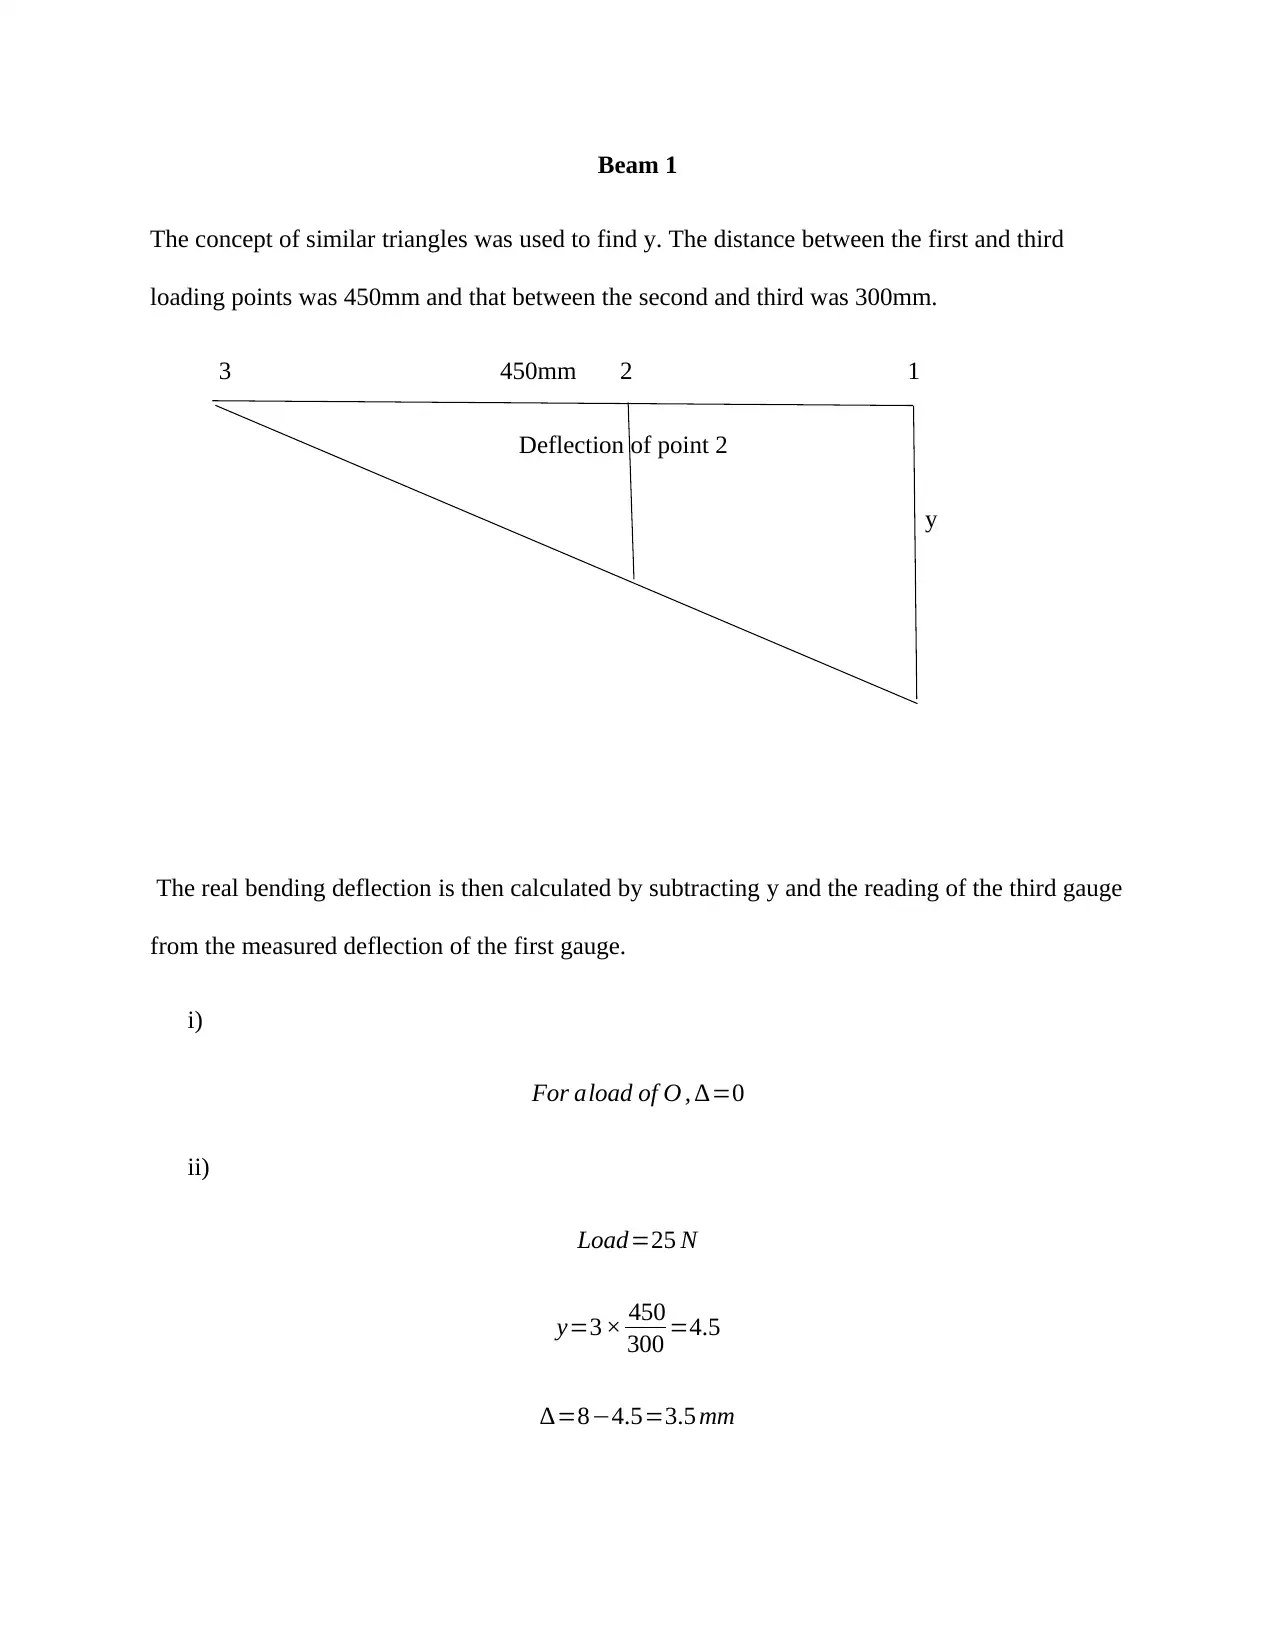
Practical Assignment
AI Summary
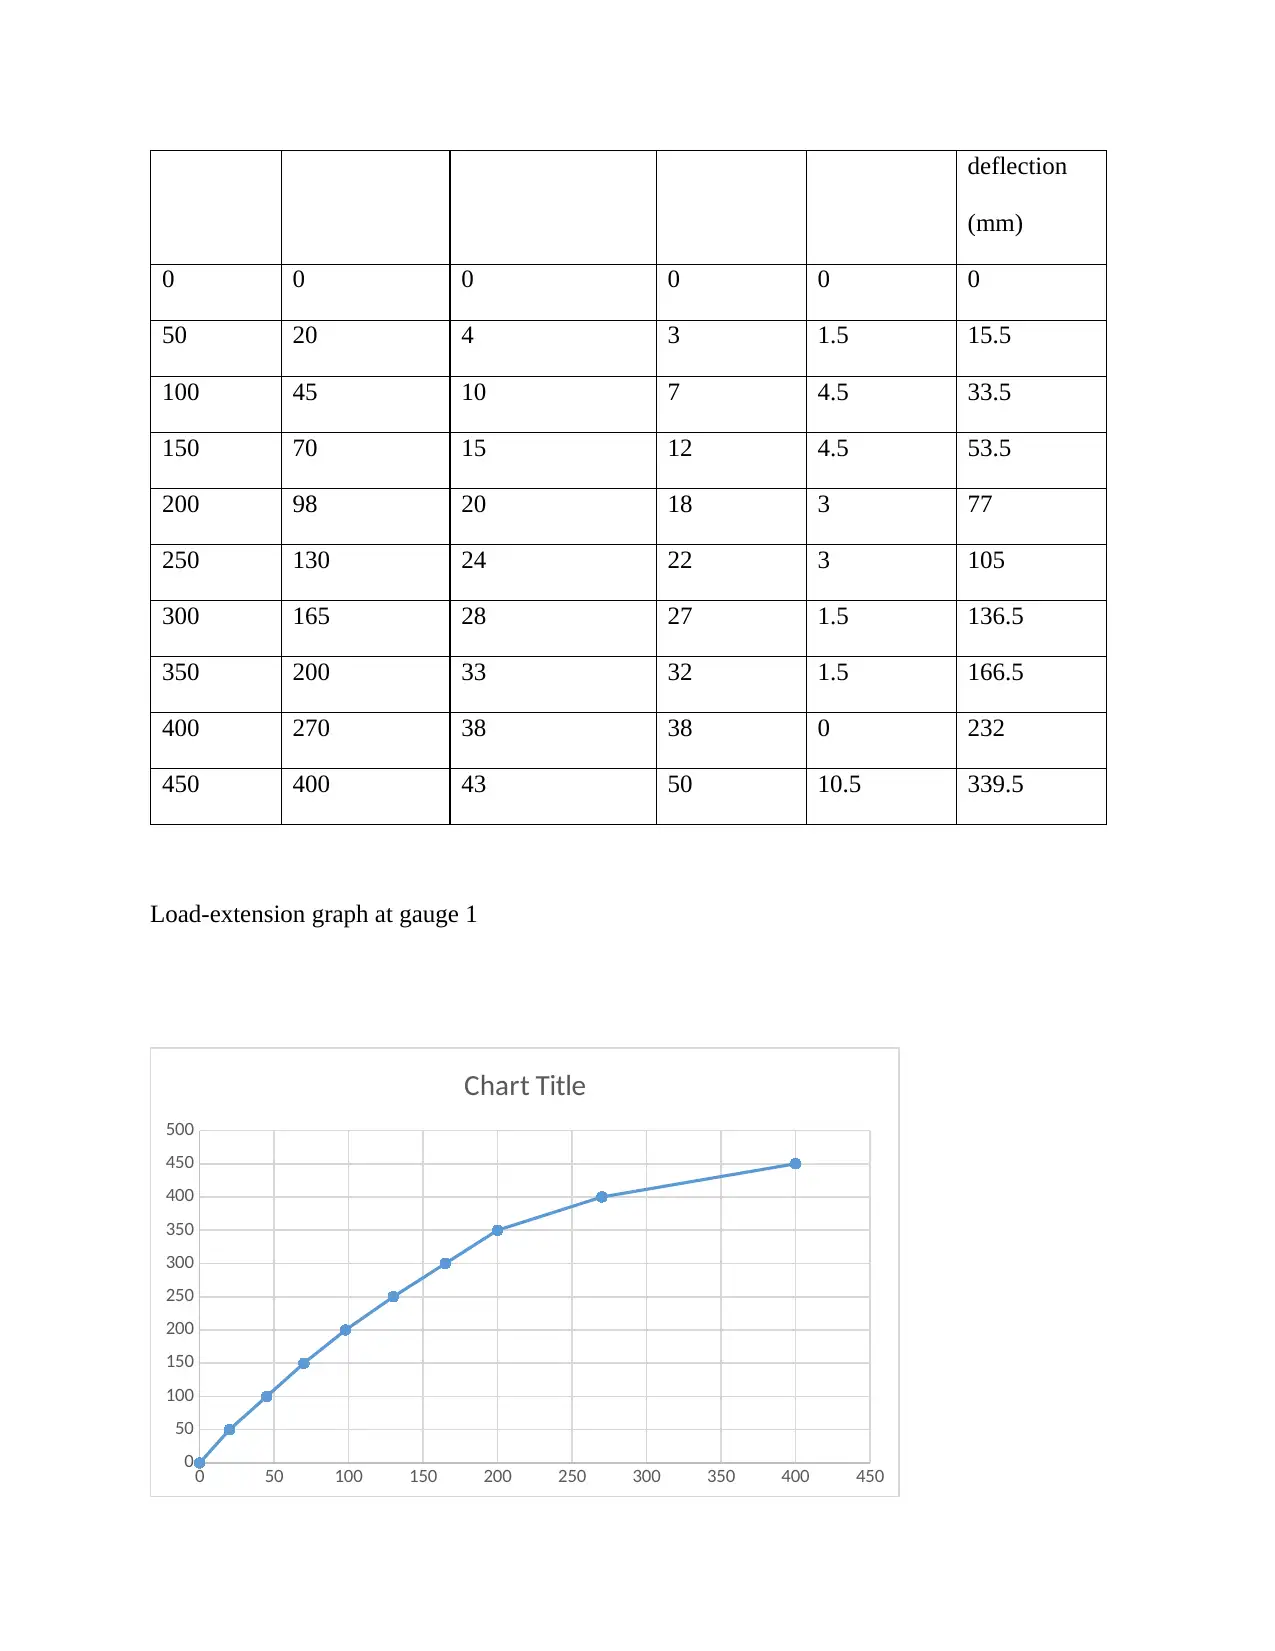
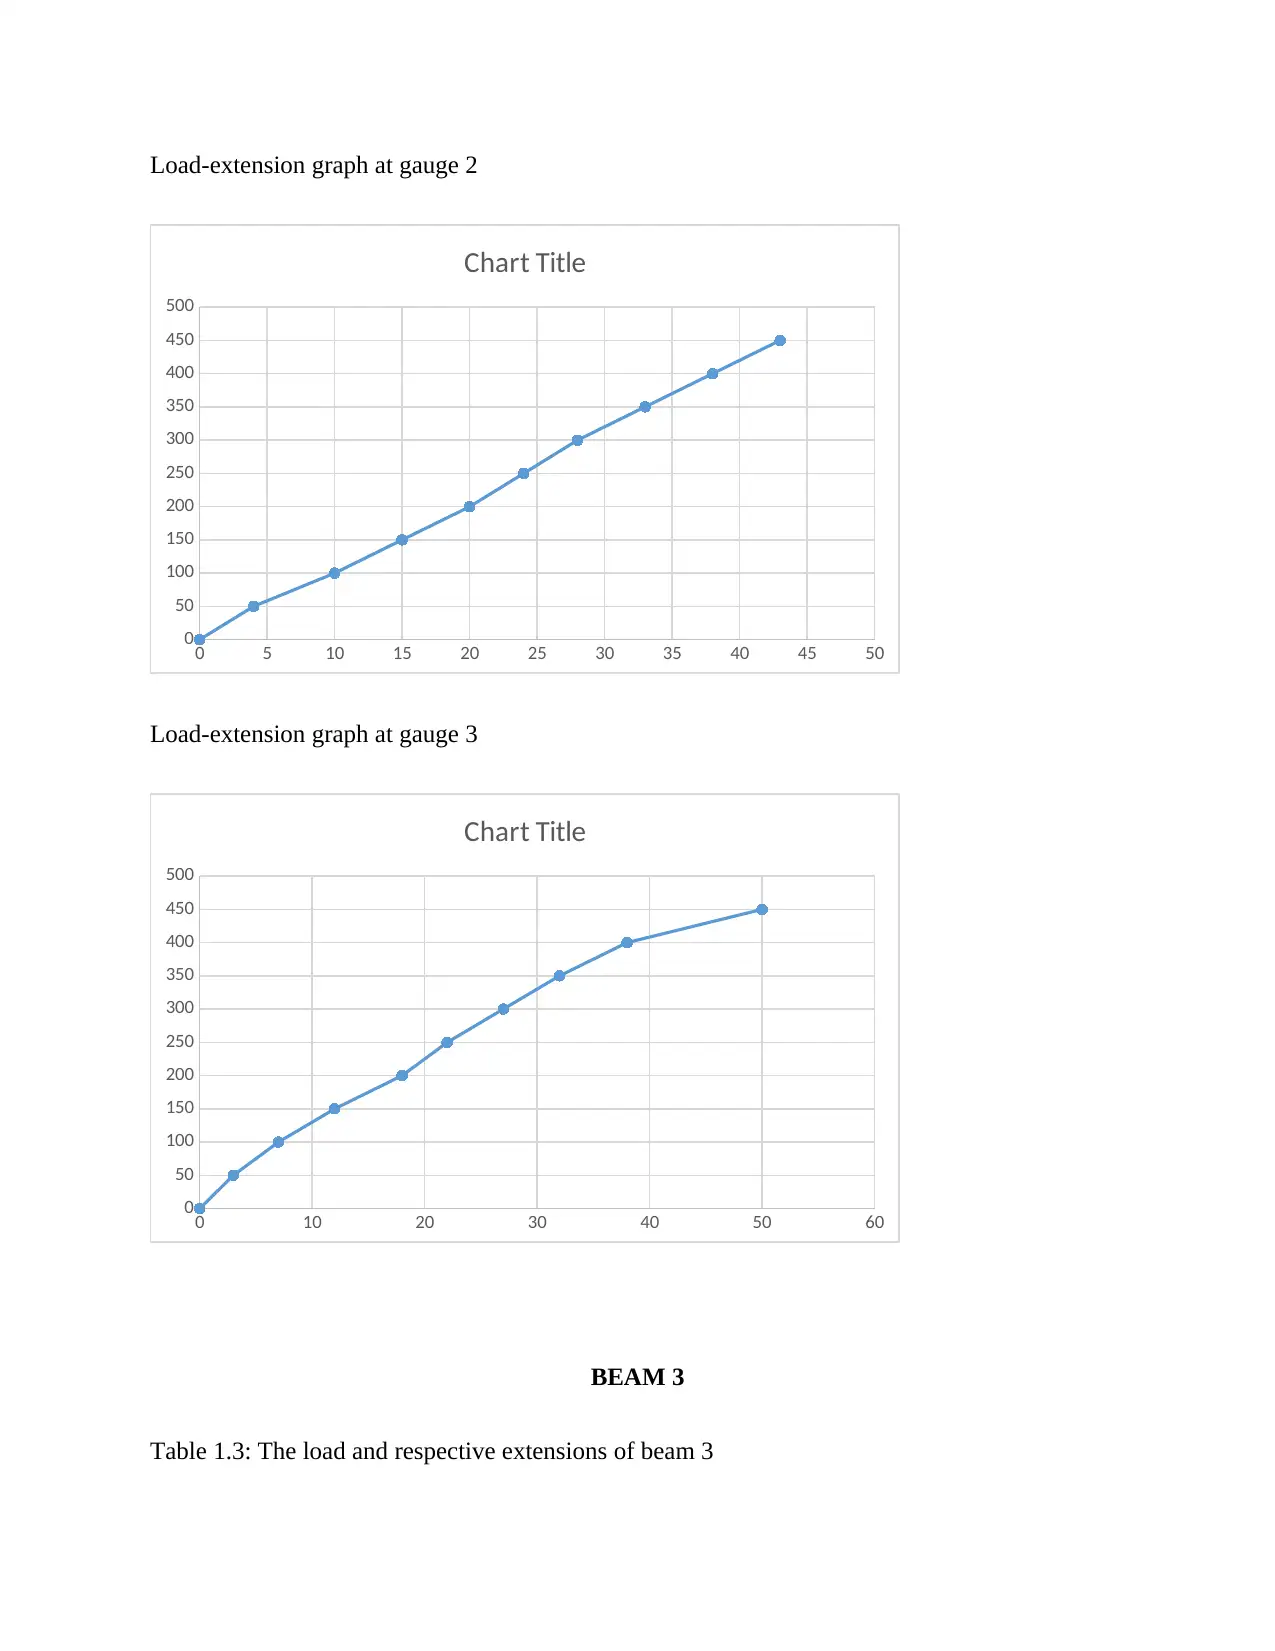
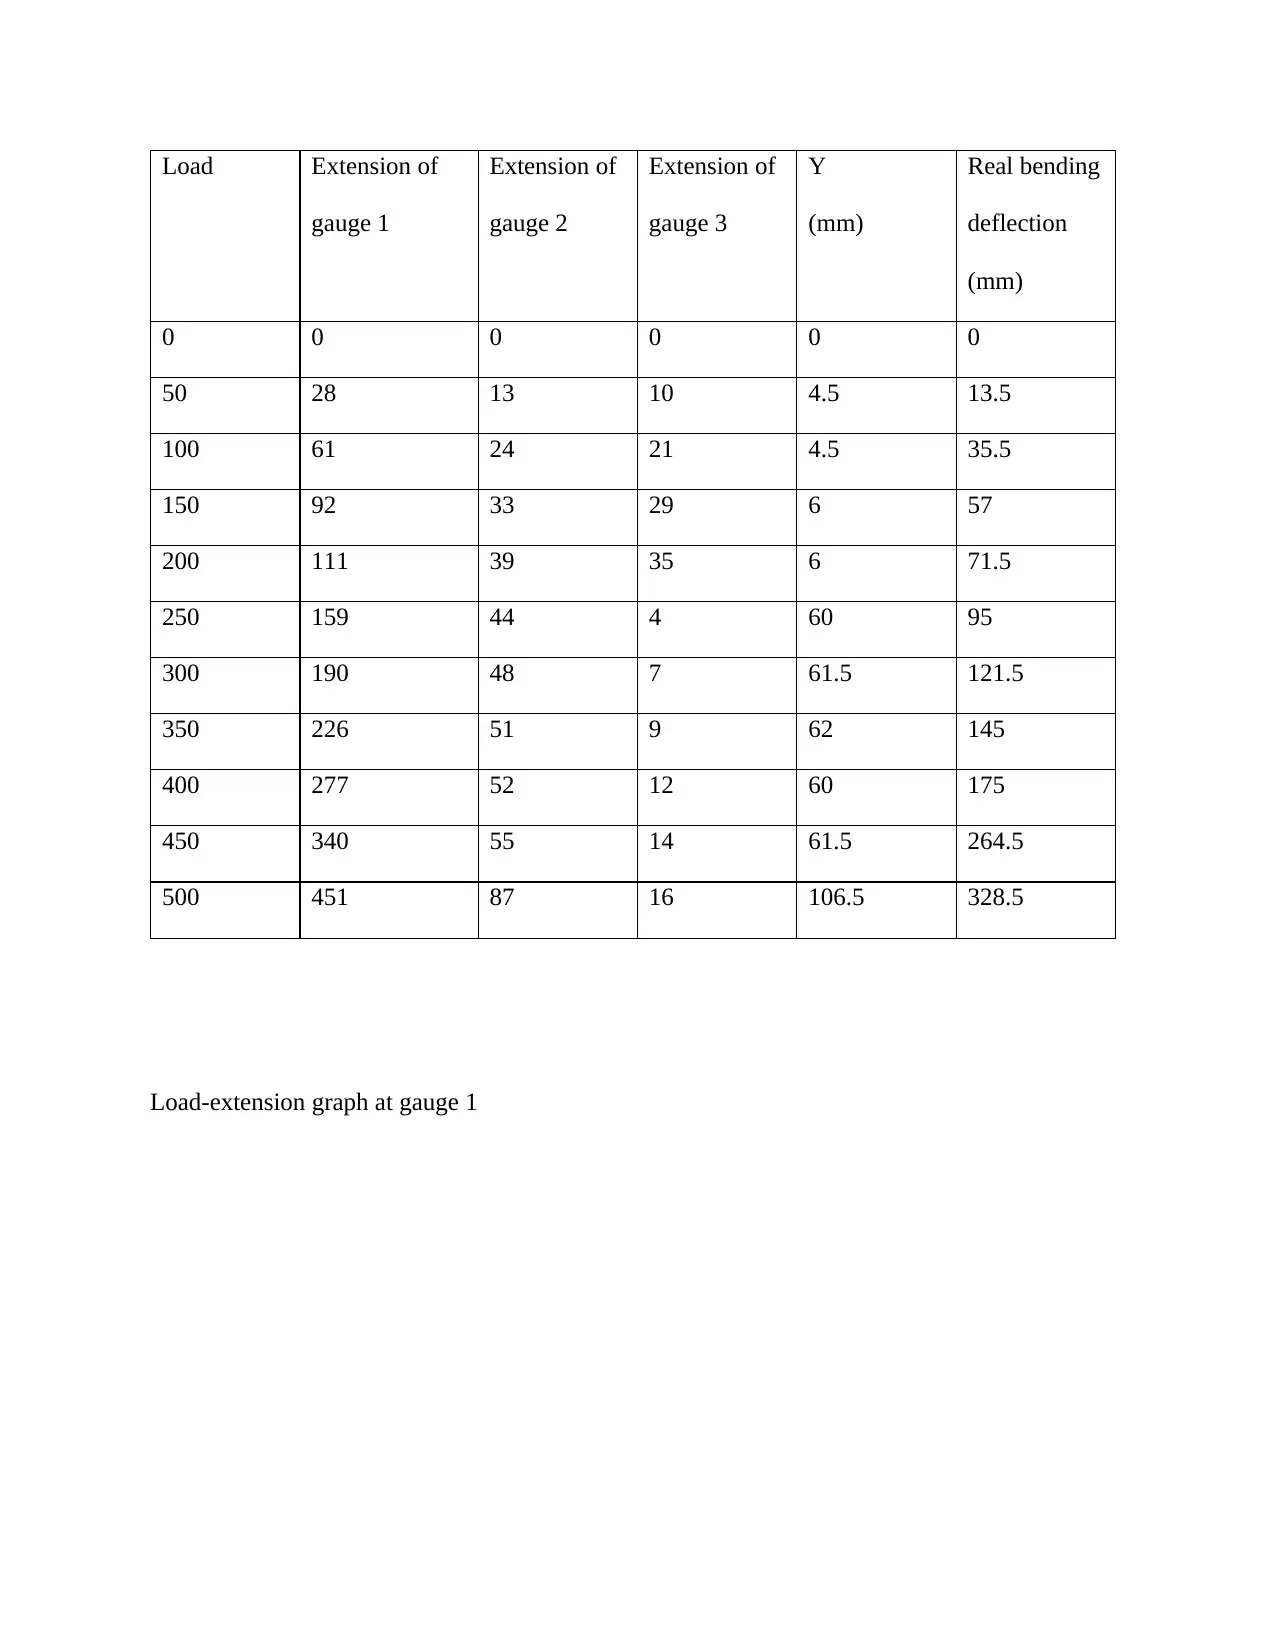
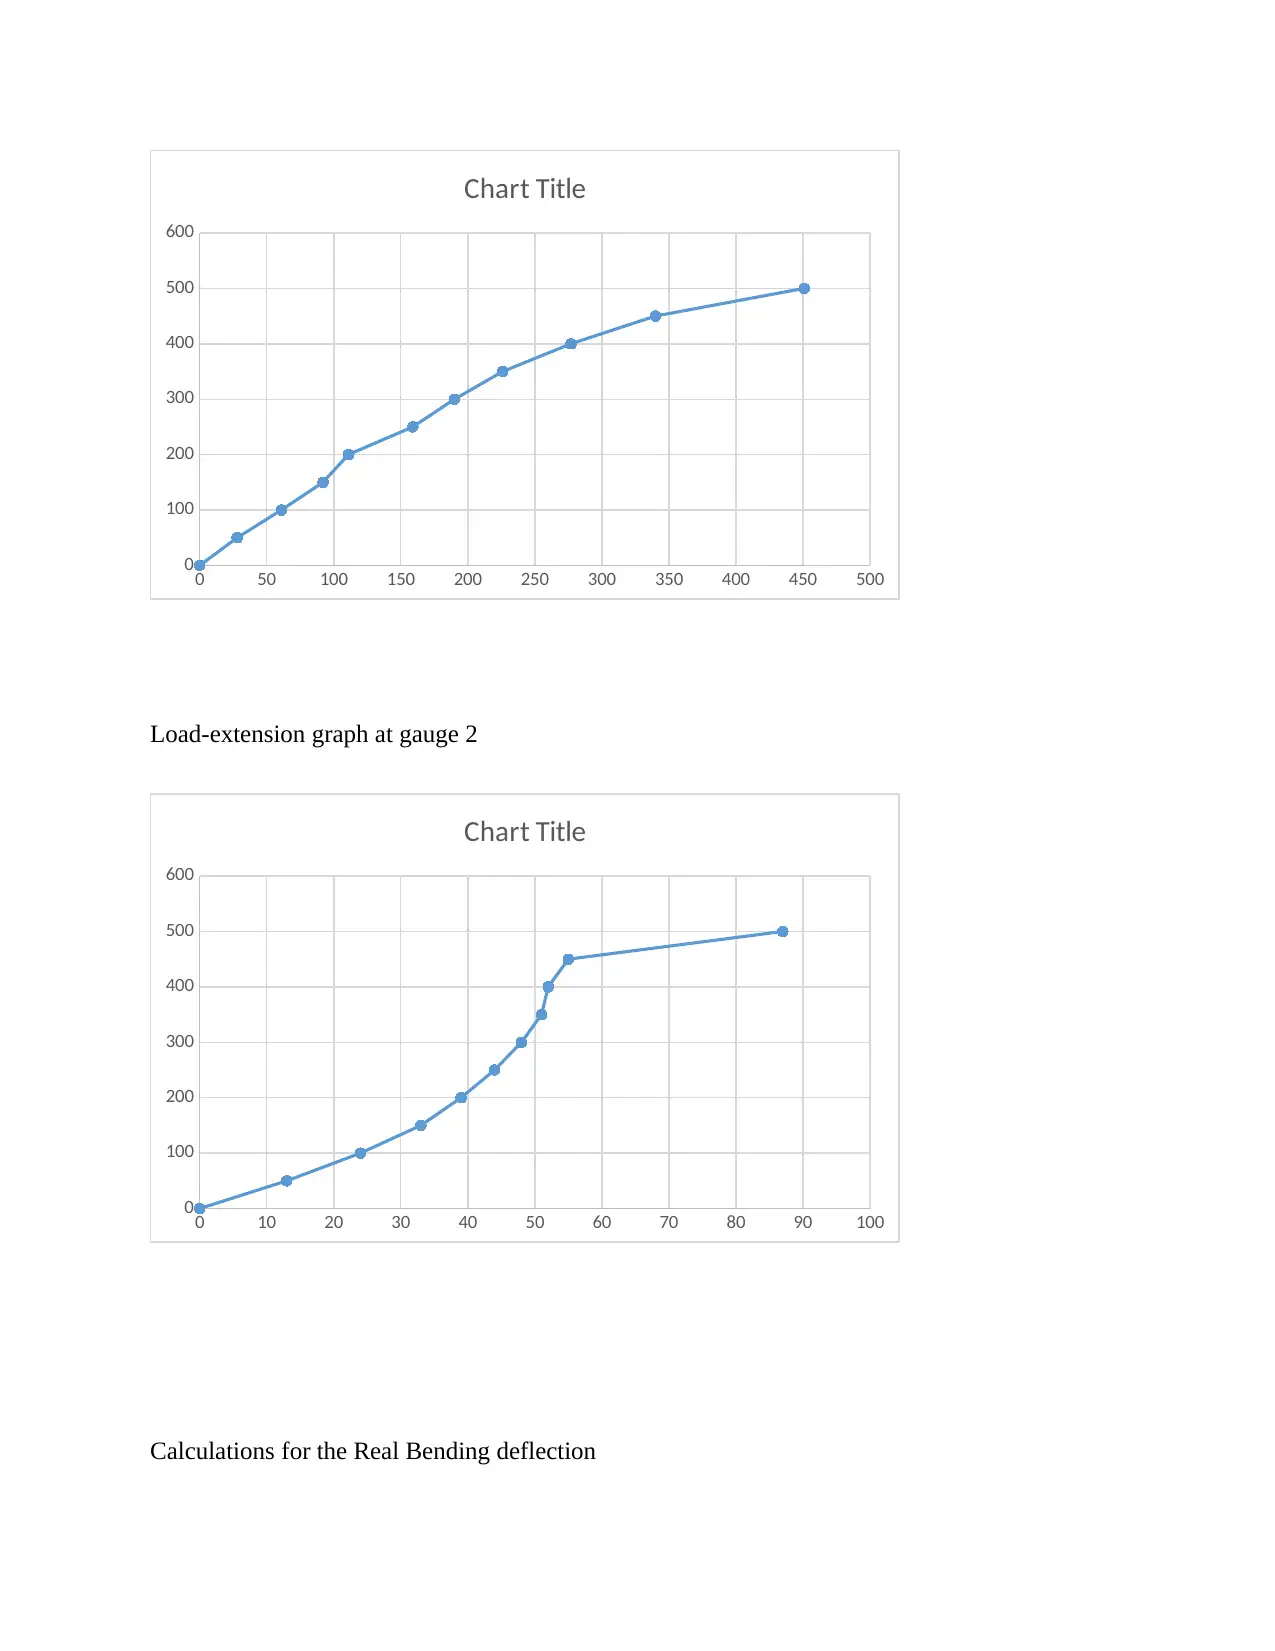
This assignment presents an experimental analysis of the load-extension characteristics and real bending deflection of reinforced concrete beams. The student has conducted tests on three beams (Beam 1, Beam 2, and Beam 3) with varying reinforcement configurations. The assignment includes detailed tables of load, gauge extensions, and calculated real bending deflections. Load-extension graphs for each gauge on each beam are also included. Calculations for real bending deflection are provided, utilizing the concept of similar triangles. Furthermore, the bending moment calculations are presented, taking into account the reaction force and distance from the gauge, with a calibration factor for the load incorporated. The analysis provides a comprehensive understanding of beam behavior under load, including the relationship between load, deflection, and bending moment.
1 out of 30
Related Documents


Your All-in-One AI-Powered Toolkit for Academic Success.
+13062052269
info@desklib.com
Available 24*7 on WhatsApp / Email
![[object Object]](/_next/static/media/star-bottom.7253800d.svg)
Copyright © 2020–2026 A2Z Services. All Rights Reserved. Developed and managed by ZUCOL.