Ask a question from expert
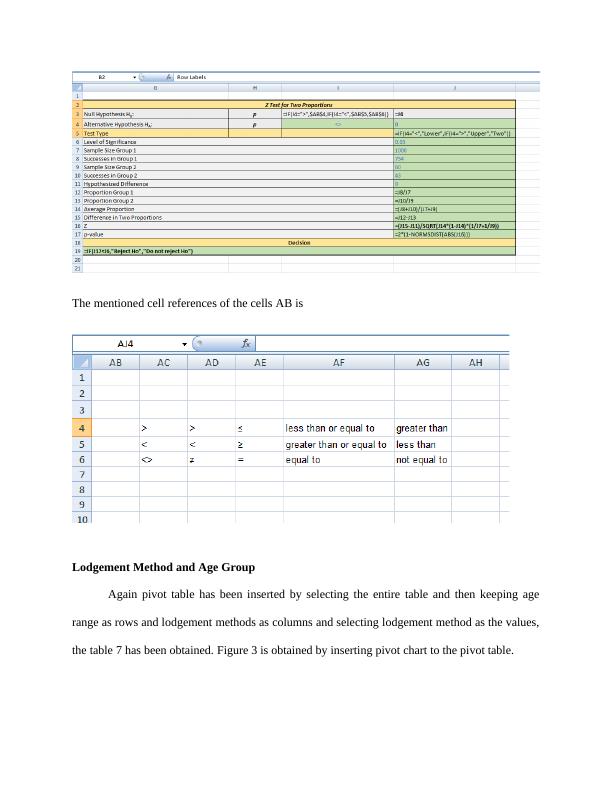
Lodgement Method and Age Group
4 Pages415 Words85 Views
Added on 2020-05-16
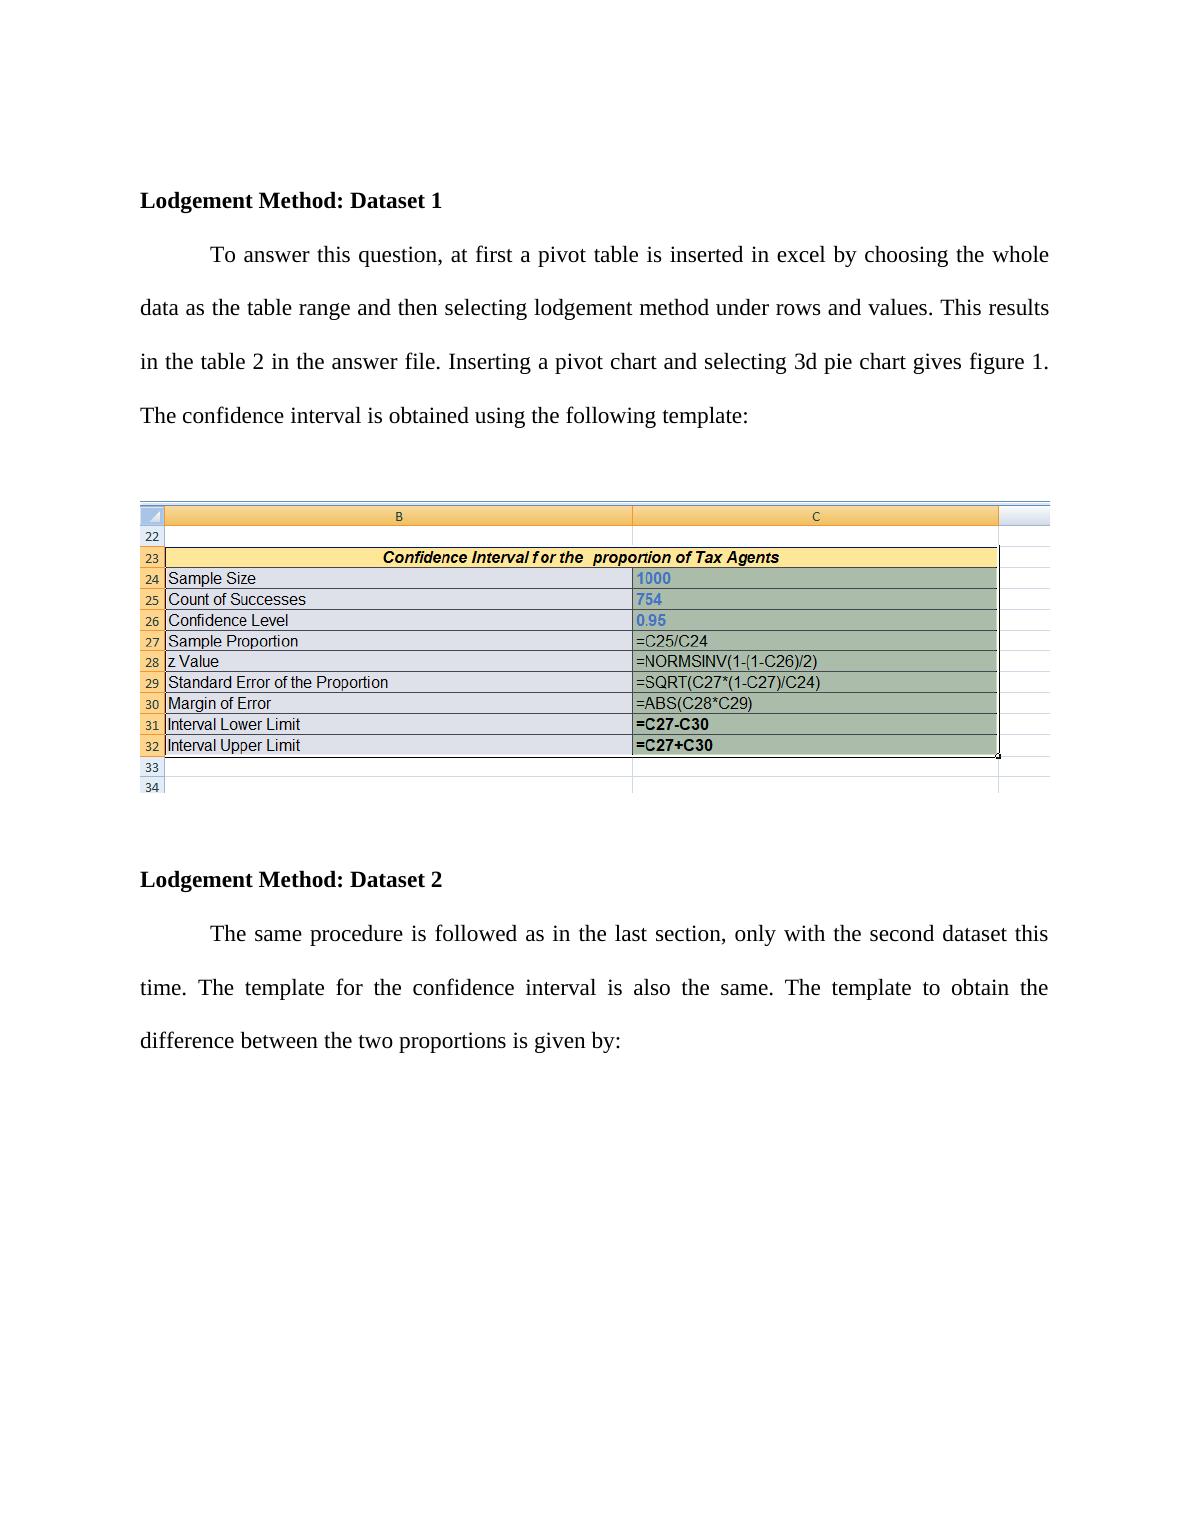
Lodgement Method and Age Group
Added on 2020-05-16
BookmarkShareRelated Documents
End of preview
Want to access all the pages? Upload your documents or become a member.
Statistics and Data Analysis Assignment
|5
|1044
|39
BUS708 Statistical Modelling Assignment - DOC
|13
|2594
|72
BUS708, Statistics and Data Analysis | Study
|13
|2166
|214
Chi-Square Test of Association and T-Test for Breastfeeding Duration
|15
|2438
|408
Setting up – Task 0
|5
|962
|407
Pivot Table: A Statistical Tool for Summarizing Data in a Tabular Structure
|4
|422
|88