Financial Ratio Analysis of M&S Plc
VerifiedAdded on 2020/01/16
|10
|1963
|234
AI Summary
This assignment presents a comprehensive analysis of the financial performance of M&S Plc in 2016 using various financial ratios. The analysis compares M&S's performance with its competitors, highlighting its strengths and weaknesses. Key areas examined include profitability, liquidity, solvency, and efficiency. The report concludes with recommendations for M&S to improve its financial position.
Contribute Materials
Your contribution can guide someone’s learning journey. Share your
documents today.

Finance
Secure Best Marks with AI Grader
Need help grading? Try our AI Grader for instant feedback on your assignments.
Table of Contents
INTRODUCTION......................................................................................................................3
Analyzing financial performance of M&S in against to Debenhams Plc..............................3
Weaknesses of ratio analysis..................................................................................................8
RECOMMENDATIONS...........................................................................................................8
REFERENCES.........................................................................................................................10
INTRODUCTION
Financial statement analysis may be served as a monetary tool which helps company
in getting information about its performance level. In this regard, by doing ratio analysis
business unit can obtain information about its profitability, liquidity and solvency aspect. The
present report is based on M&S Plc which is one the largest retail business organization of
UK. In this, the present report will shed light on M&S Plc’s financial performance in against
to its competitors such as Debenhams Plc.
Analyzing financial performance of M&S in against to Debenhams Plc
Ratio analysis of M&S Plc and Debenhams Plc is enumerated below:
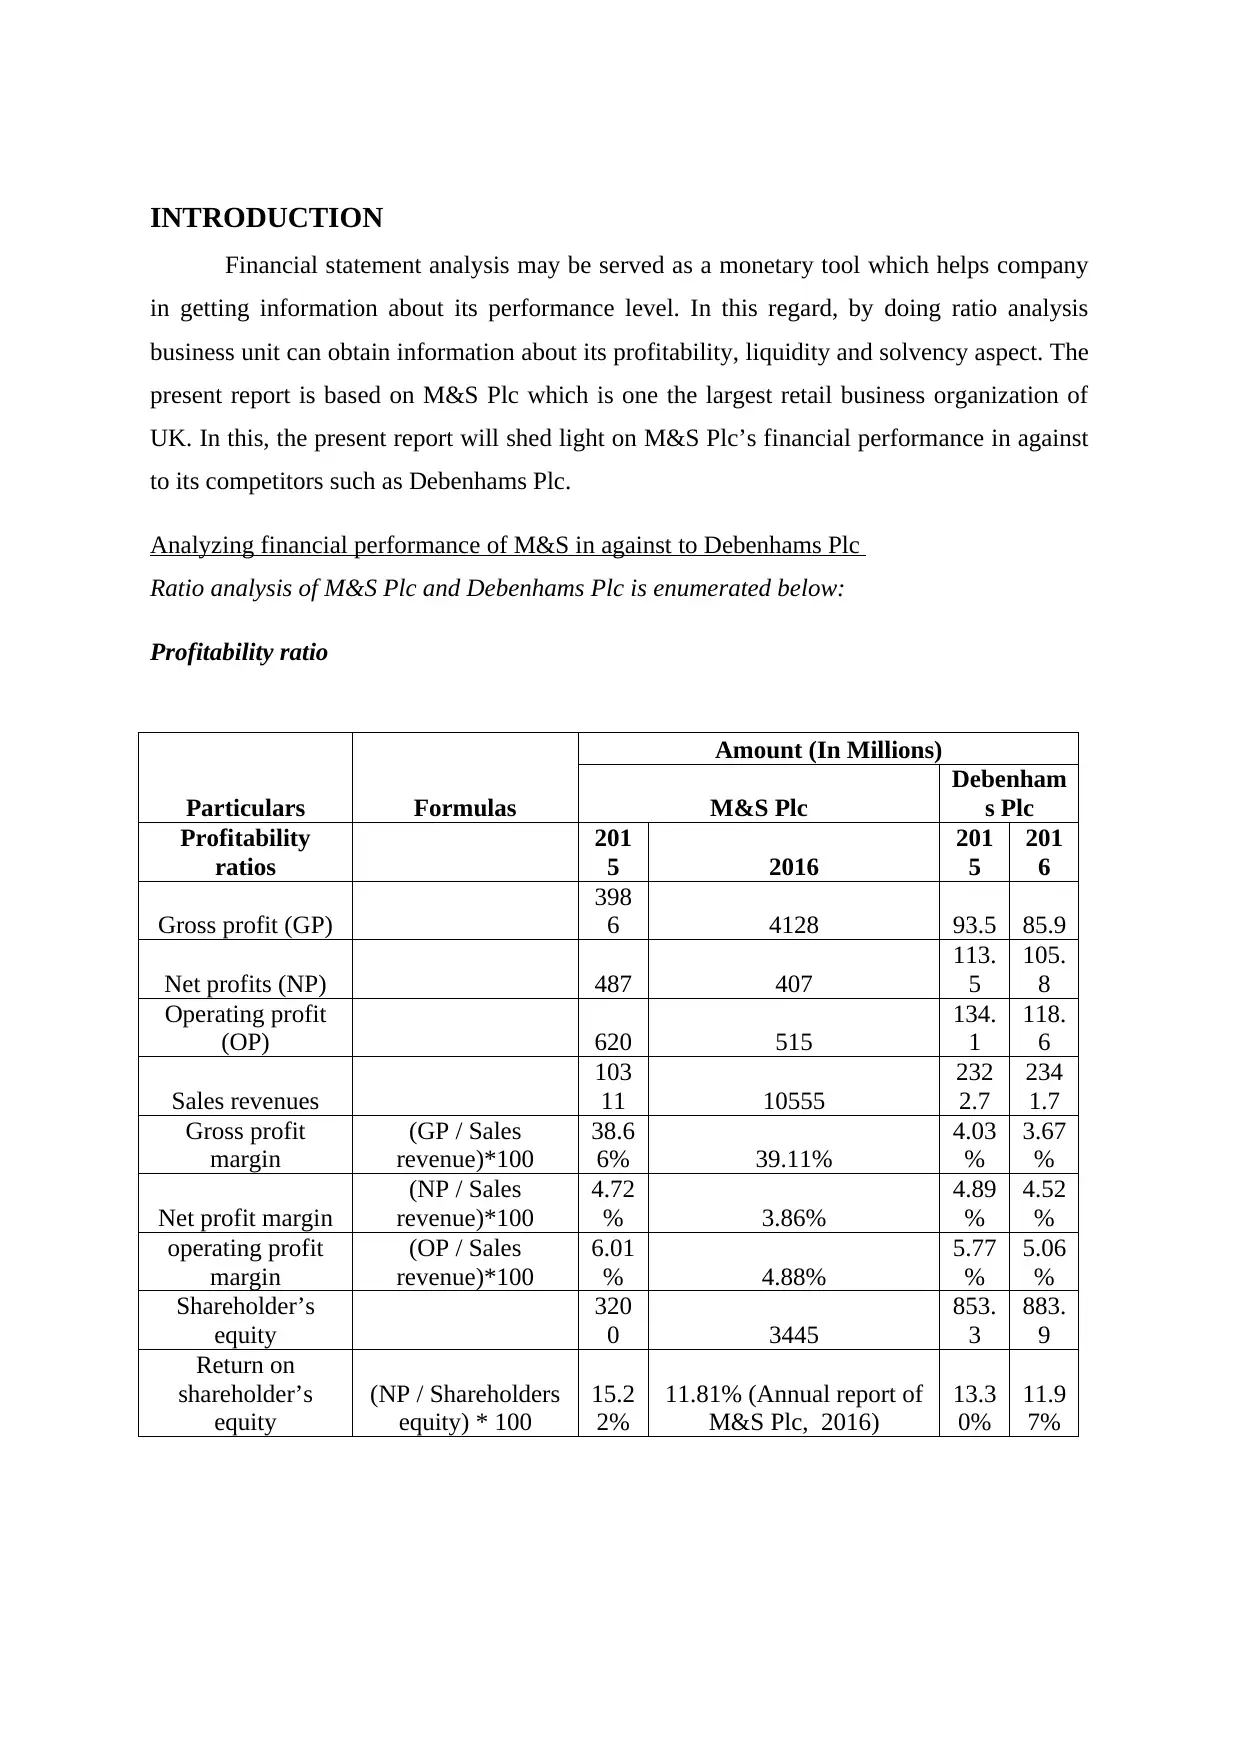
Profitability ratio
Particulars Formulas
Amount (In Millions)
M&S Plc
Debenham
s Plc
Profitability
ratios
201
5 2016
201
5
201
6
Gross profit (GP)
398
6 4128 93.5 85.9
Net profits (NP) 487 407
113.
5
105.
8
Operating profit
(OP) 620 515
134.
1
118.
6
Sales revenues
103
11 10555
232
2.7
234
1.7
Gross profit
margin
(GP / Sales
revenue)*100
38.6
6% 39.11%
4.03
%
3.67
%
Net profit margin
(NP / Sales
revenue)*100
4.72
% 3.86%
4.89
%
4.52
%
operating profit
margin
(OP / Sales
revenue)*100
6.01
% 4.88%
5.77
%
5.06
%
Shareholder’s
equity
320
0 3445
853.
3
883.
9
Return on
shareholder’s
equity
(NP / Shareholders
equity) * 100
15.2
2%
11.81% (Annual report of
M&S Plc, 2016)
13.3
0%
11.9
7%
Financial statement analysis may be served as a monetary tool which helps company
in getting information about its performance level. In this regard, by doing ratio analysis
business unit can obtain information about its profitability, liquidity and solvency aspect. The
present report is based on M&S Plc which is one the largest retail business organization of
UK. In this, the present report will shed light on M&S Plc’s financial performance in against
to its competitors such as Debenhams Plc.
Analyzing financial performance of M&S in against to Debenhams Plc
Ratio analysis of M&S Plc and Debenhams Plc is enumerated below:
Profitability ratio
Particulars Formulas
Amount (In Millions)
M&S Plc
Debenham
s Plc
Profitability
ratios
201
5 2016
201
5
201
6
Gross profit (GP)
398
6 4128 93.5 85.9
Net profits (NP) 487 407
113.
5
105.
8
Operating profit
(OP) 620 515
134.
1
118.
6
Sales revenues
103
11 10555
232
2.7
234
1.7
Gross profit
margin
(GP / Sales
revenue)*100
38.6
6% 39.11%
4.03
%
3.67
%
Net profit margin
(NP / Sales
revenue)*100
4.72
% 3.86%
4.89
%
4.52
%
operating profit
margin
(OP / Sales
revenue)*100
6.01
% 4.88%
5.77
%
5.06
%
Shareholder’s
equity
320
0 3445
853.
3
883.
9
Return on
shareholder’s
equity
(NP / Shareholders
equity) * 100
15.2
2%
11.81% (Annual report of
M&S Plc, 2016)
13.3
0%
11.9
7%
(GP / Sales
revenue)*100 (NP / Sales
revenue)*100 (OP / Sales
revenue)*100
Gross profit
margin Net profit
margin operating profit
margin
0.00%
5.00%
10.00%
15.00%
20.00%
25.00%
30.00%
35.00%
40.00%
45.00%
2015 M&S
2015 Debehams Plc
Gross profit
margin Net profit
margin operating profit
margin
0.00%
5.00%
10.00%
15.00%
20.00%
25.00%
30.00%
35.00%
40.00%
45.00%
2016 M&S
2016 Debehams Plc
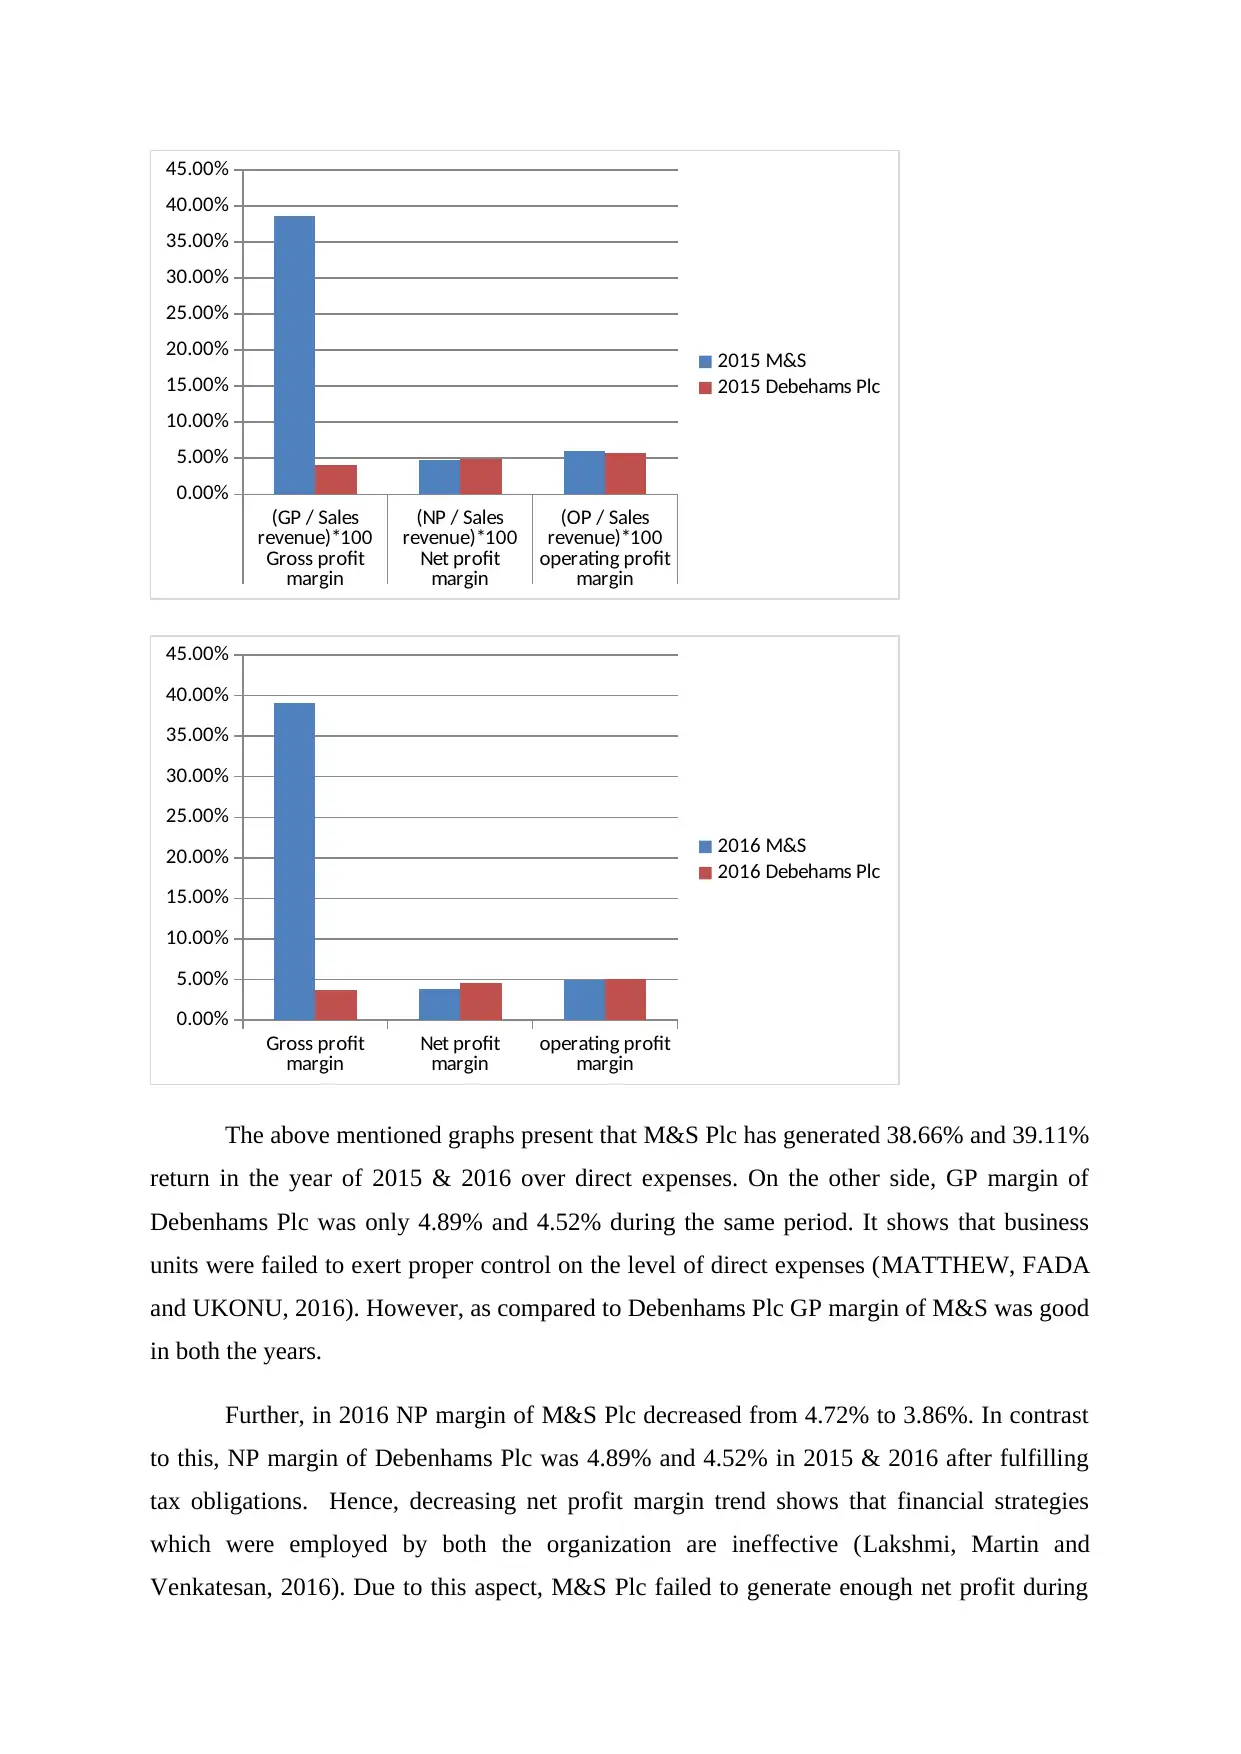
The above mentioned graphs present that M&S Plc has generated 38.66% and 39.11%
return in the year of 2015 & 2016 over direct expenses. On the other side, GP margin of
Debenhams Plc was only 4.89% and 4.52% during the same period. It shows that business
units were failed to exert proper control on the level of direct expenses (MATTHEW, FADA
and UKONU, 2016). However, as compared to Debenhams Plc GP margin of M&S was good
in both the years.
Further, in 2016 NP margin of M&S Plc decreased from 4.72% to 3.86%. In contrast
to this, NP margin of Debenhams Plc was 4.89% and 4.52% in 2015 & 2016 after fulfilling
tax obligations. Hence, decreasing net profit margin trend shows that financial strategies
which were employed by both the organization are ineffective (Lakshmi, Martin and
Venkatesan, 2016). Due to this aspect, M&S Plc failed to generate enough net profit during
revenue)*100 (NP / Sales
revenue)*100 (OP / Sales
revenue)*100
Gross profit
margin Net profit
margin operating profit
margin
0.00%
5.00%
10.00%
15.00%
20.00%
25.00%
30.00%
35.00%
40.00%
45.00%
2015 M&S
2015 Debehams Plc
Gross profit
margin Net profit
margin operating profit
margin
0.00%
5.00%
10.00%
15.00%
20.00%
25.00%
30.00%
35.00%
40.00%
45.00%
2016 M&S
2016 Debehams Plc
The above mentioned graphs present that M&S Plc has generated 38.66% and 39.11%
return in the year of 2015 & 2016 over direct expenses. On the other side, GP margin of
Debenhams Plc was only 4.89% and 4.52% during the same period. It shows that business
units were failed to exert proper control on the level of direct expenses (MATTHEW, FADA
and UKONU, 2016). However, as compared to Debenhams Plc GP margin of M&S was good
in both the years.
Further, in 2016 NP margin of M&S Plc decreased from 4.72% to 3.86%. In contrast
to this, NP margin of Debenhams Plc was 4.89% and 4.52% in 2015 & 2016 after fulfilling
tax obligations. Hence, decreasing net profit margin trend shows that financial strategies
which were employed by both the organization are ineffective (Lakshmi, Martin and
Venkatesan, 2016). Due to this aspect, M&S Plc failed to generate enough net profit during
Secure Best Marks with AI Grader
Need help grading? Try our AI Grader for instant feedback on your assignments.
the period of 2015 and 2016. Hence, by taking into consideration all such aspects it can be
said that profitability aspect of M&S Plc was sound in against to competitor firm.
Return on shareholders’ equity measure entails that in 2016 M&S failed to attain
generate high profit from shareholders equity. Moreover, in the financial year 2016, ROE of
M&S decreased from 15.22% to 11.81%. On the other side, such measure of Debenhams Plc
was showed c
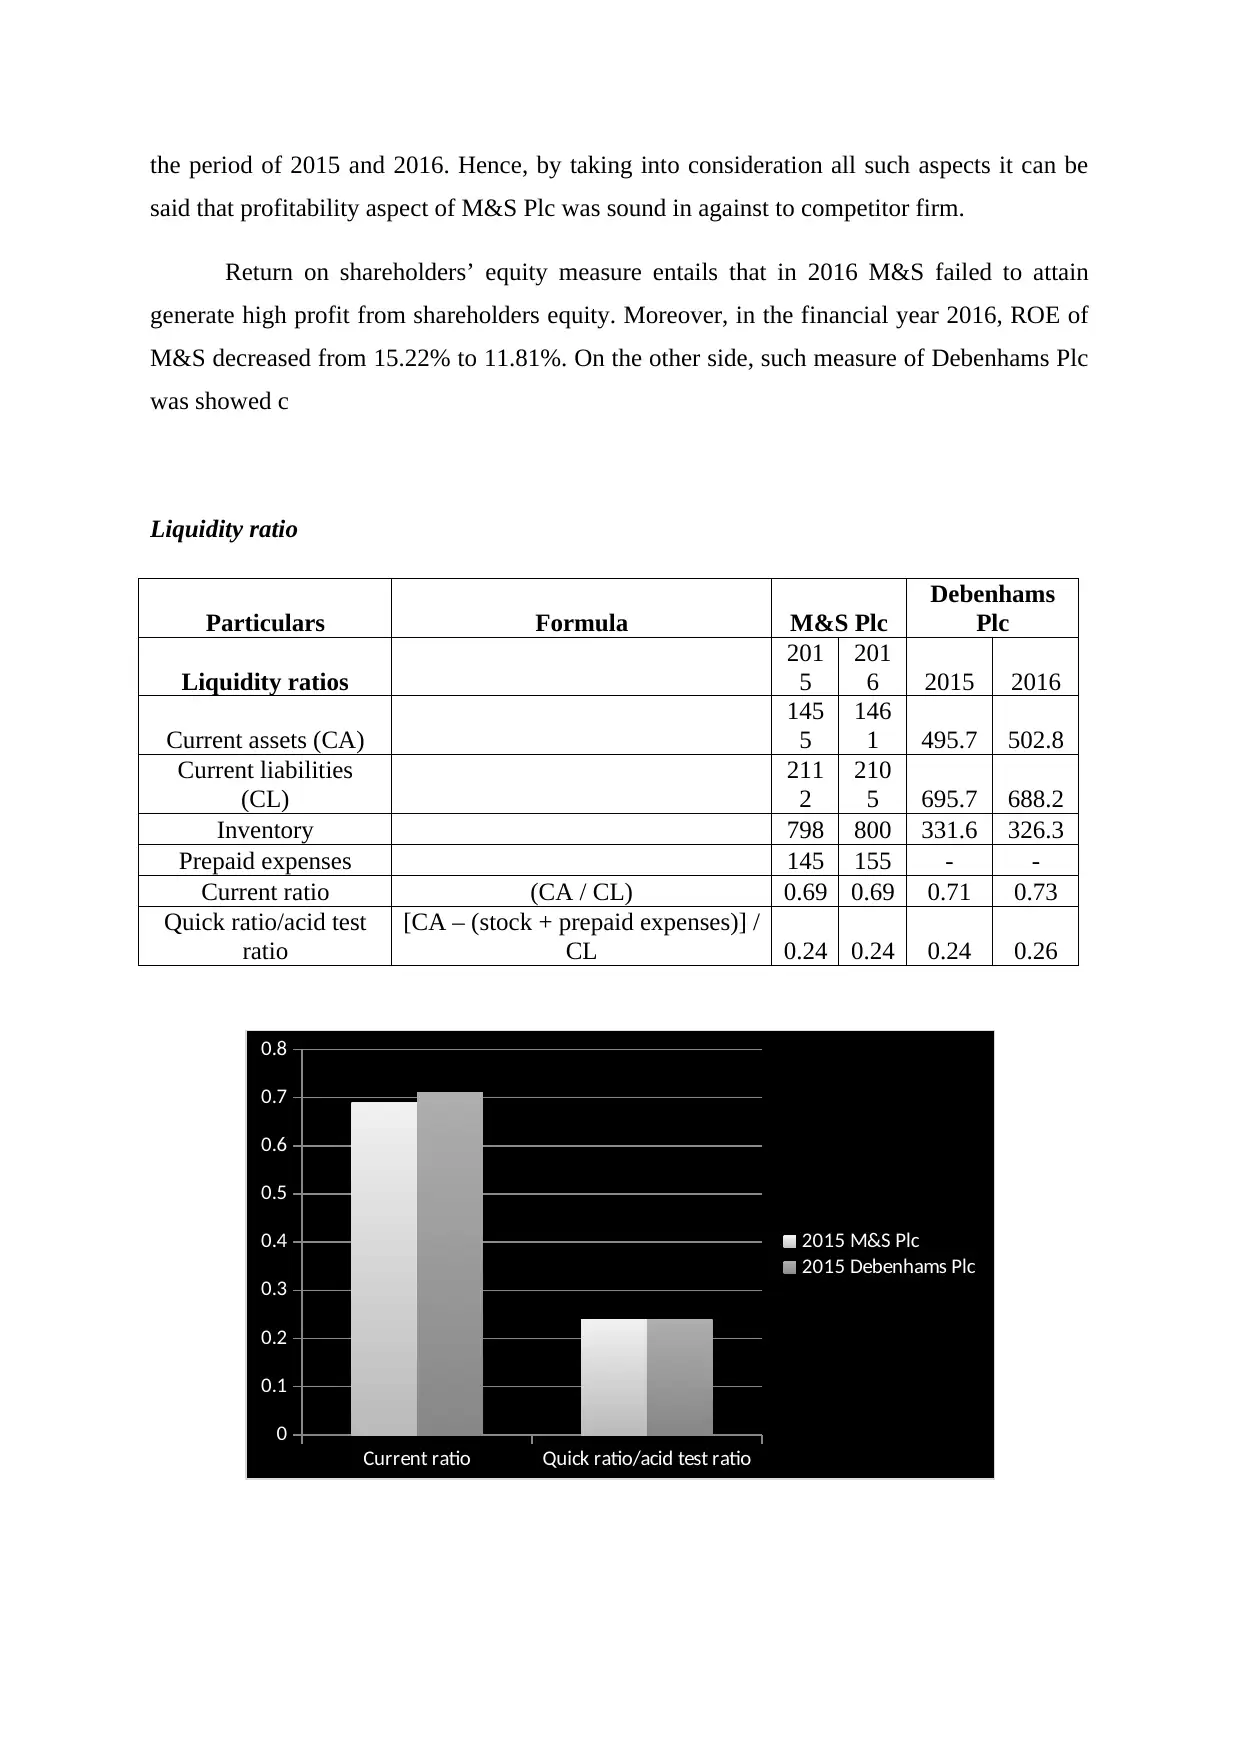
Liquidity ratio
Particulars Formula M&S Plc
Debenhams
Plc
Liquidity ratios
201
5
201
6 2015 2016
Current assets (CA)
145
5
146
1 495.7 502.8
Current liabilities
(CL)
211
2
210
5 695.7 688.2
Inventory 798 800 331.6 326.3
Prepaid expenses 145 155 - -
Current ratio (CA / CL) 0.69 0.69 0.71 0.73
Quick ratio/acid test
ratio
[CA – (stock + prepaid expenses)] /
CL 0.24 0.24 0.24 0.26
Current ratio Quick ratio/acid test ratio
0
0.1
0.2
0.3
0.4
0.5
0.6
0.7
0.8
2015 M&S Plc
2015 Debenhams Plc
said that profitability aspect of M&S Plc was sound in against to competitor firm.
Return on shareholders’ equity measure entails that in 2016 M&S failed to attain
generate high profit from shareholders equity. Moreover, in the financial year 2016, ROE of
M&S decreased from 15.22% to 11.81%. On the other side, such measure of Debenhams Plc
was showed c
Liquidity ratio
Particulars Formula M&S Plc
Debenhams
Plc
Liquidity ratios
201
5
201
6 2015 2016
Current assets (CA)
145
5
146
1 495.7 502.8
Current liabilities
(CL)
211
2
210
5 695.7 688.2
Inventory 798 800 331.6 326.3
Prepaid expenses 145 155 - -
Current ratio (CA / CL) 0.69 0.69 0.71 0.73
Quick ratio/acid test
ratio
[CA – (stock + prepaid expenses)] /
CL 0.24 0.24 0.24 0.26
Current ratio Quick ratio/acid test ratio
0
0.1
0.2
0.3
0.4
0.5
0.6
0.7
0.8
2015 M&S Plc
2015 Debenhams Plc
Current ratio Quick ratio/acid test ratio
0
0.1
0.2
0.3
0.4
0.5
0.6
0.7
0.8
2016 M&S
2016 Debehams
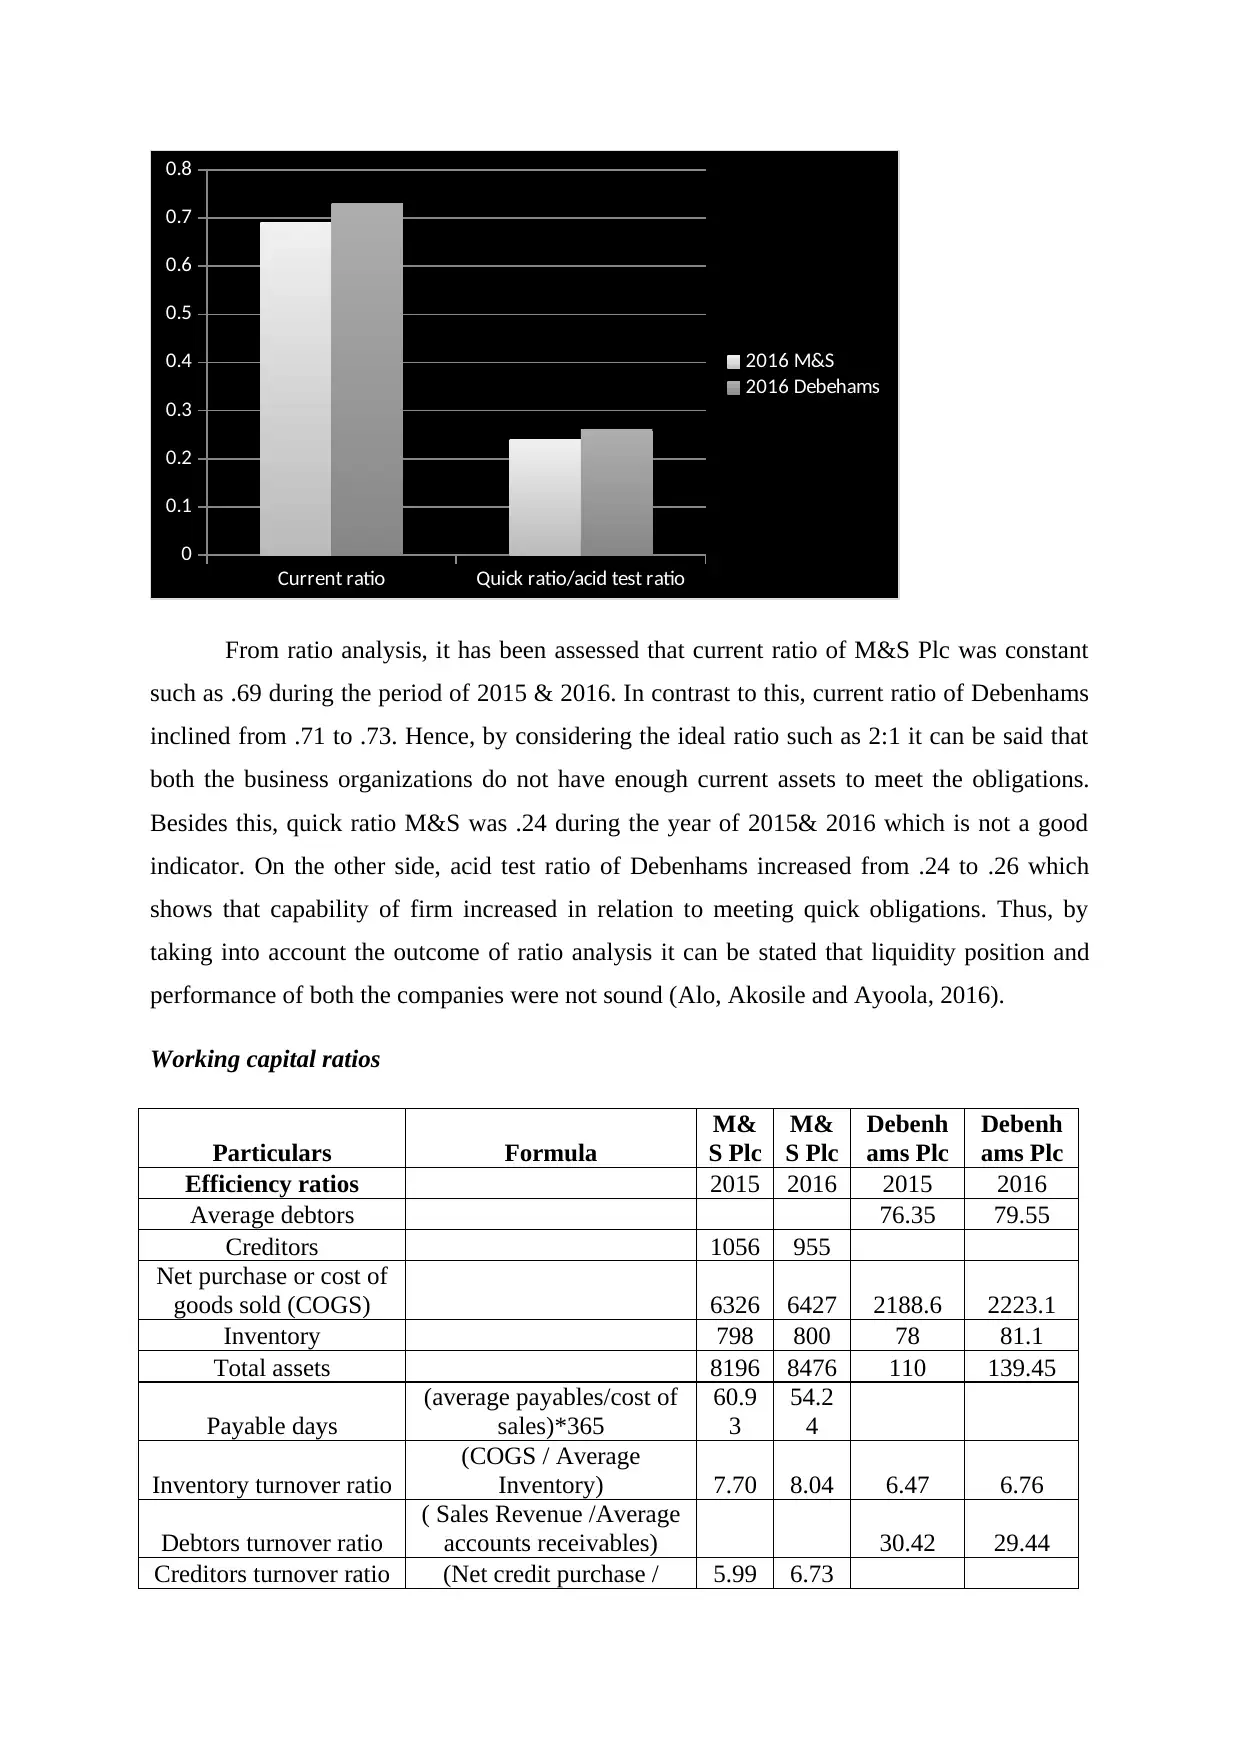
From ratio analysis, it has been assessed that current ratio of M&S Plc was constant
such as .69 during the period of 2015 & 2016. In contrast to this, current ratio of Debenhams
inclined from .71 to .73. Hence, by considering the ideal ratio such as 2:1 it can be said that
both the business organizations do not have enough current assets to meet the obligations.
Besides this, quick ratio M&S was .24 during the year of 2015& 2016 which is not a good
indicator. On the other side, acid test ratio of Debenhams increased from .24 to .26 which
shows that capability of firm increased in relation to meeting quick obligations. Thus, by
taking into account the outcome of ratio analysis it can be stated that liquidity position and
performance of both the companies were not sound (Alo, Akosile and Ayoola, 2016).
Working capital ratios
Particulars Formula
M&
S Plc
M&
S Plc
Debenh
ams Plc
Debenh
ams Plc
Efficiency ratios 2015 2016 2015 2016
Average debtors 76.35 79.55
Creditors 1056 955
Net purchase or cost of
goods sold (COGS) 6326 6427 2188.6 2223.1
Inventory 798 800 78 81.1
Total assets 8196 8476 110 139.45
Payable days
(average payables/cost of
sales)*365
60.9
3
54.2
4
Inventory turnover ratio
(COGS / Average
Inventory) 7.70 8.04 6.47 6.76
Debtors turnover ratio
( Sales Revenue /Average
accounts receivables) 30.42 29.44
Creditors turnover ratio (Net credit purchase / 5.99 6.73
0
0.1
0.2
0.3
0.4
0.5
0.6
0.7
0.8
2016 M&S
2016 Debehams
From ratio analysis, it has been assessed that current ratio of M&S Plc was constant
such as .69 during the period of 2015 & 2016. In contrast to this, current ratio of Debenhams
inclined from .71 to .73. Hence, by considering the ideal ratio such as 2:1 it can be said that
both the business organizations do not have enough current assets to meet the obligations.
Besides this, quick ratio M&S was .24 during the year of 2015& 2016 which is not a good
indicator. On the other side, acid test ratio of Debenhams increased from .24 to .26 which
shows that capability of firm increased in relation to meeting quick obligations. Thus, by
taking into account the outcome of ratio analysis it can be stated that liquidity position and
performance of both the companies were not sound (Alo, Akosile and Ayoola, 2016).
Working capital ratios
Particulars Formula
M&
S Plc
M&
S Plc
Debenh
ams Plc
Debenh
ams Plc
Efficiency ratios 2015 2016 2015 2016
Average debtors 76.35 79.55
Creditors 1056 955
Net purchase or cost of
goods sold (COGS) 6326 6427 2188.6 2223.1
Inventory 798 800 78 81.1
Total assets 8196 8476 110 139.45
Payable days
(average payables/cost of
sales)*365
60.9
3
54.2
4
Inventory turnover ratio
(COGS / Average
Inventory) 7.70 8.04 6.47 6.76
Debtors turnover ratio
( Sales Revenue /Average
accounts receivables) 30.42 29.44
Creditors turnover ratio (Net credit purchase / 5.99 6.73
Average creditors)
Assets turnover ratio (Revenue / Total assets) 1.26 1.25 1.08 1.07
Inventory
turnover ratio Debtors
turnover ratio Creditors
turnover ratio Assets
turnover ratio
0
5
10
15
20
25
30
35
M&S 2015
Debenhams 2015
Inventory
turnover ratio Debtors
turnover ratio Creditors
turnover ratio Assets
turnover ratio
0
5
10
15
20
25
30
35
M&S 2016
Debehams 2016
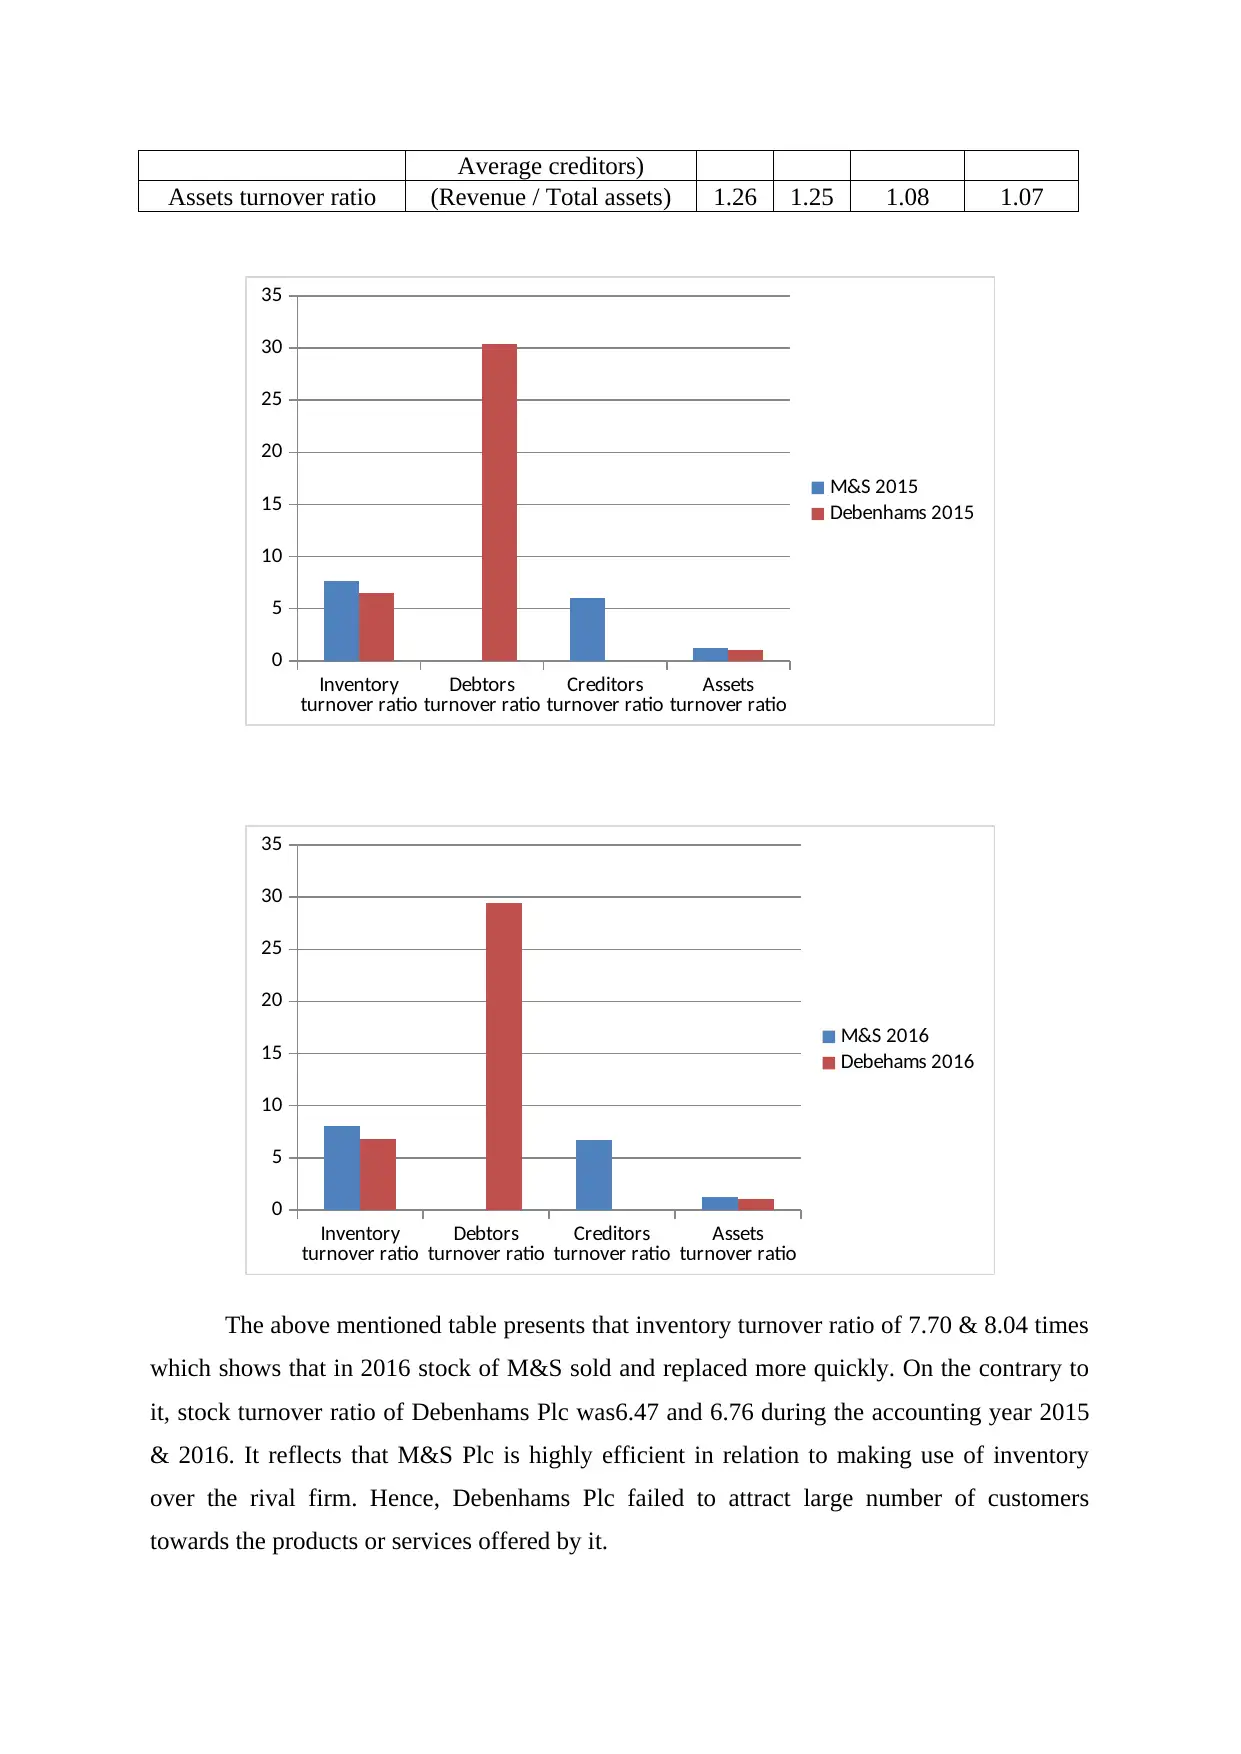
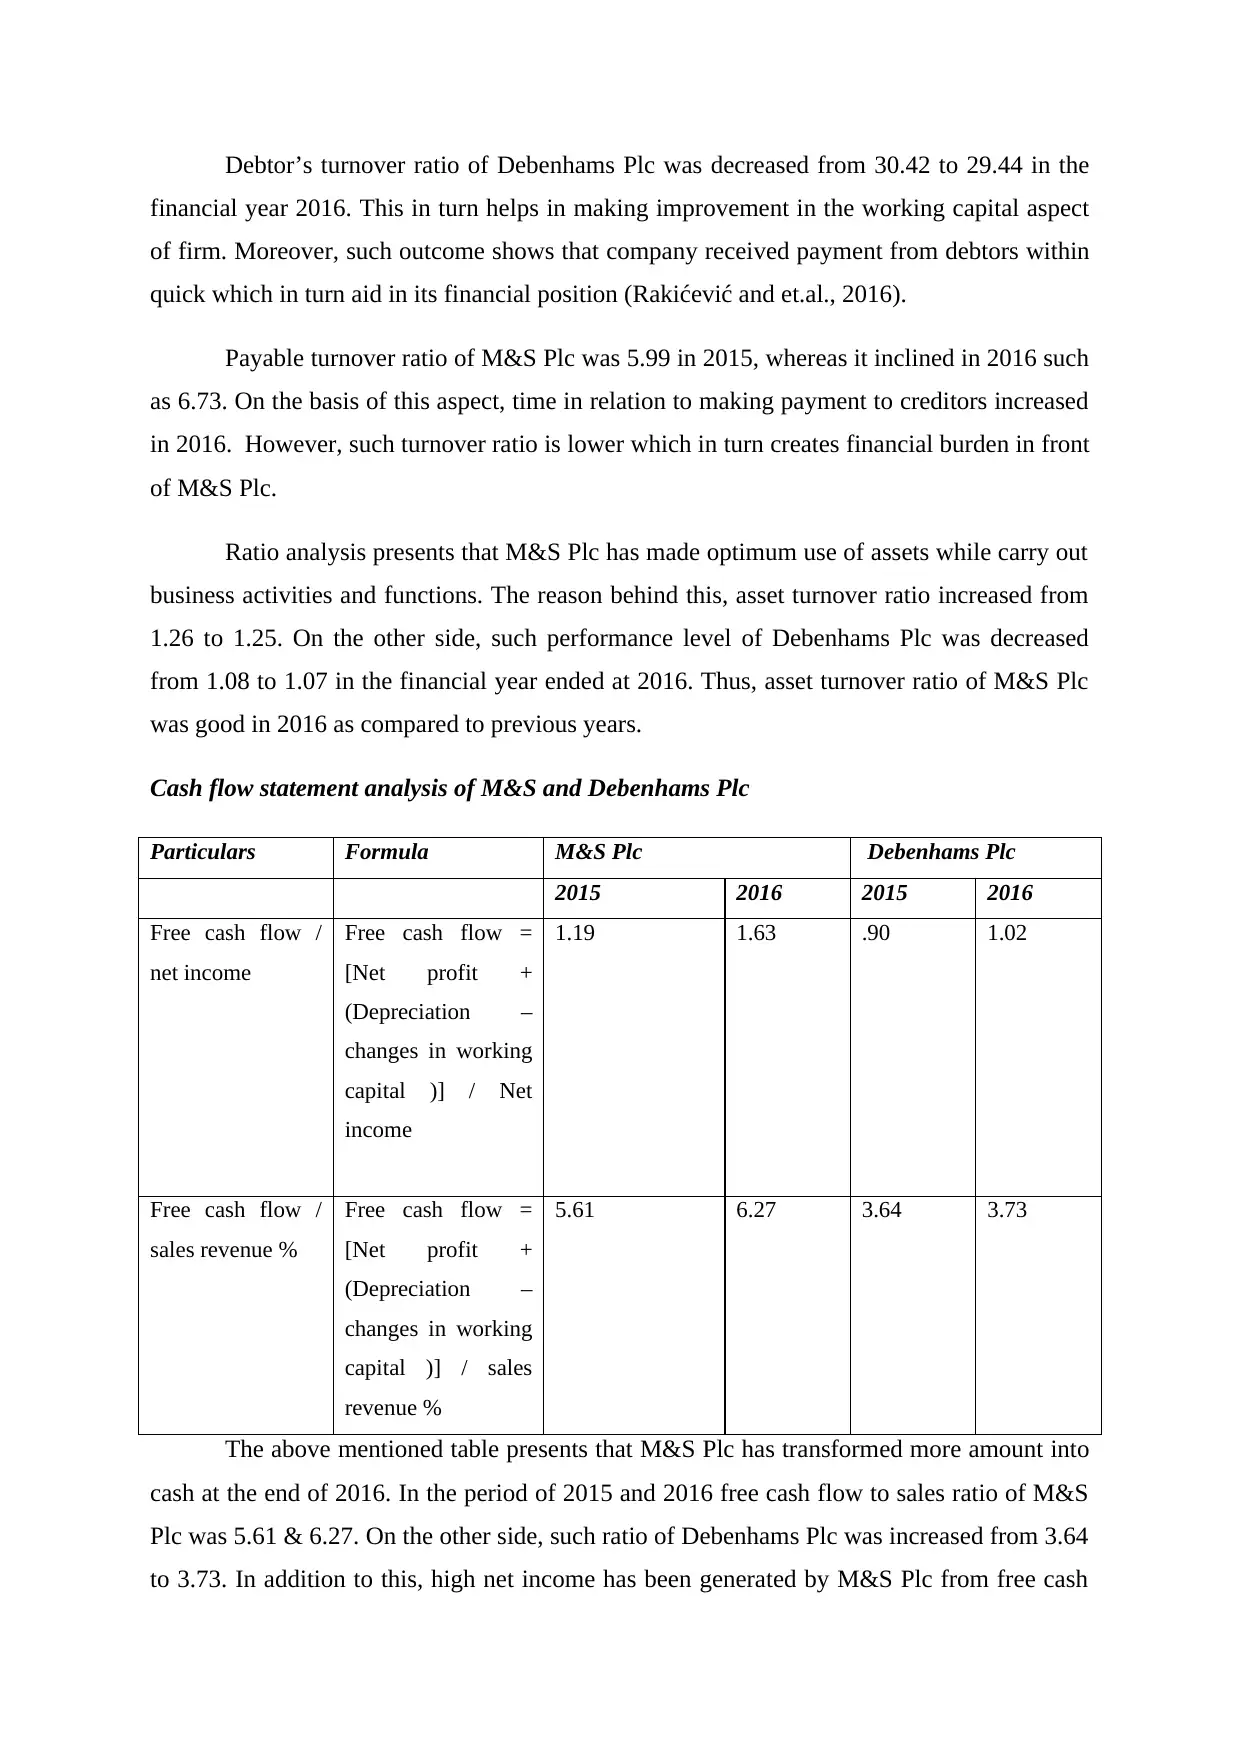
The above mentioned table presents that inventory turnover ratio of 7.70 & 8.04 times
which shows that in 2016 stock of M&S sold and replaced more quickly. On the contrary to
it, stock turnover ratio of Debenhams Plc was6.47 and 6.76 during the accounting year 2015
& 2016. It reflects that M&S Plc is highly efficient in relation to making use of inventory
over the rival firm. Hence, Debenhams Plc failed to attract large number of customers
towards the products or services offered by it.
Assets turnover ratio (Revenue / Total assets) 1.26 1.25 1.08 1.07
Inventory
turnover ratio Debtors
turnover ratio Creditors
turnover ratio Assets
turnover ratio
0
5
10
15
20
25
30
35
M&S 2015
Debenhams 2015
Inventory
turnover ratio Debtors
turnover ratio Creditors
turnover ratio Assets
turnover ratio
0
5
10
15
20
25
30
35
M&S 2016
Debehams 2016
The above mentioned table presents that inventory turnover ratio of 7.70 & 8.04 times
which shows that in 2016 stock of M&S sold and replaced more quickly. On the contrary to
it, stock turnover ratio of Debenhams Plc was6.47 and 6.76 during the accounting year 2015
& 2016. It reflects that M&S Plc is highly efficient in relation to making use of inventory
over the rival firm. Hence, Debenhams Plc failed to attract large number of customers
towards the products or services offered by it.
Paraphrase This Document
Need a fresh take? Get an instant paraphrase of this document with our AI Paraphraser
Debtor’s turnover ratio of Debenhams Plc was decreased from 30.42 to 29.44 in the
financial year 2016. This in turn helps in making improvement in the working capital aspect
of firm. Moreover, such outcome shows that company received payment from debtors within
quick which in turn aid in its financial position (Rakićević and et.al., 2016).
Payable turnover ratio of M&S Plc was 5.99 in 2015, whereas it inclined in 2016 such
as 6.73. On the basis of this aspect, time in relation to making payment to creditors increased
in 2016. However, such turnover ratio is lower which in turn creates financial burden in front
of M&S Plc.
Ratio analysis presents that M&S Plc has made optimum use of assets while carry out
business activities and functions. The reason behind this, asset turnover ratio increased from
1.26 to 1.25. On the other side, such performance level of Debenhams Plc was decreased
from 1.08 to 1.07 in the financial year ended at 2016. Thus, asset turnover ratio of M&S Plc
was good in 2016 as compared to previous years.
Cash flow statement analysis of M&S and Debenhams Plc
Particulars Formula M&S Plc Debenhams Plc
2015 2016 2015 2016
Free cash flow /
net income
Free cash flow =
[Net profit +
(Depreciation –
changes in working
capital )] / Net
income
1.19 1.63 .90 1.02
Free cash flow /
sales revenue %
Free cash flow =
[Net profit +
(Depreciation –
changes in working
capital )] / sales
revenue %
5.61 6.27 3.64 3.73
The above mentioned table presents that M&S Plc has transformed more amount into
cash at the end of 2016. In the period of 2015 and 2016 free cash flow to sales ratio of M&S
Plc was 5.61 & 6.27. On the other side, such ratio of Debenhams Plc was increased from 3.64
to 3.73. In addition to this, high net income has been generated by M&S Plc from free cash
flow in the period of 2016. Hence, by considering all such aspects it can be said cash position
of M&S Plc was sound in comparison to the rival firms.
Weaknesses of ratio analysis
Ratio analysis technique provides deeper insight to the organization about financial
performance of itself as well as in against to competitors. However, there are some
deficiencies which closely influence the significance of ratio analysis. Accounting principles
and standards are highly differing from one company to another (Atoom, Malkawi and Share,
2017). For instance: M&S Plc follows IAS 12 for recognizing the amount of deferred tax,
whereas others are not. Due to this, companies are unable to
RECOMMENDATIONS
It is recommended to M&S Plc to develop highly competent monetary framework for
making control on both direct and indirect expenses. In this regard, by employing
budgetary control techniques business unit can reduce overspending and thereby
would become able to improve its gross and net profit margin.
Further, M&S should make focus on maintaining proper current assets such as stock,
cash, receivables etc. By improving financial capability in relation to meeting
obligations business unit can strengthen its liquidity position to a great extent.
M&S Plc should also make focus on the maintenance of assets which in turn assists
company in enhancing the level of output. Besides this, firm also needs to motivate
personnel to reduce the wastage of assets and thereby fulfill the aims and objectives.
REFERENCES
Books and Journals
Alo, E.A., Akosile, A.I. and Ayoola, A.O., 2016. The Statistical Evaluation of the
Performance of Financial Ratio Analysis in Nigerian Manufacturing Industry: An
Empirical Study of Guinness Nigeria PLC. The International Journal of Business &
Management, 4(1), p.295.
Atoom, R., Malkawi, E. and Share, B.A., 2017. Utilizing Australian Shareholders'
Association (ASA): Fifteen Top Financial Ratios to Evaluate Jordanian Banks'
Performance. Journal of Applied Finance & Banking. 7(1). pp.119-141.
Lakshmi, T .M., Martin, A. and Venkatesan, V. P., 2016. A Genetic Bankrupt Ratio Analysis
Tool Using a Genetic Algorithm to Identify Influencing Financial Ratios. IEEE
Transactions on Evolutionary Computation, 20(1), pp.38-51.
MATTHEW, D. A. A., FADA, A. and UKONU, I. C., 2016. ROLE OF FINANCIAL
RATIO ANALYSIS IN ASSESSING BUSINESS PERFORMANCE IN THE
HOSPITALITY AND TOURISM OPERATIONS. Development. 4(4).
Rakićević, A. and et.al., 2016. DuPont Financial Ratio Analysis Using Logical Aggregation.
In Soft Computing Applications (pp. 727-739). Springer International Publishing.
Online
Annual report of M&S Plc. 2016. Online. Available through: <
http://www.thedrum.com/profile/project/244193/marks-and-spencer-plc-reporting-suite-
2015 >. [Accessed on 28th January 2017].
Key ratios related to the cash flow statement. 2015. Online. Available through:
<https://www.equitymaster.com/detail.asp?date=12/16/2009&story=4&title=Key-ratios-
related-%20to-the-cashflow-statement>. [Accessed on 28th January 2017].
1 out of 10
Related Documents


Your All-in-One AI-Powered Toolkit for Academic Success.
+13062052269
info@desklib.com
Available 24*7 on WhatsApp / Email
![[object Object]](/_next/static/media/star-bottom.7253800d.svg)
Unlock your academic potential
© 2024 | Zucol Services PVT LTD | All rights reserved.