Financial Ratio Analysis: M&S Plc and Debenhams Performance Report
VerifiedAdded on 2020/01/16
|10
|1963
|234
Report
AI Summary
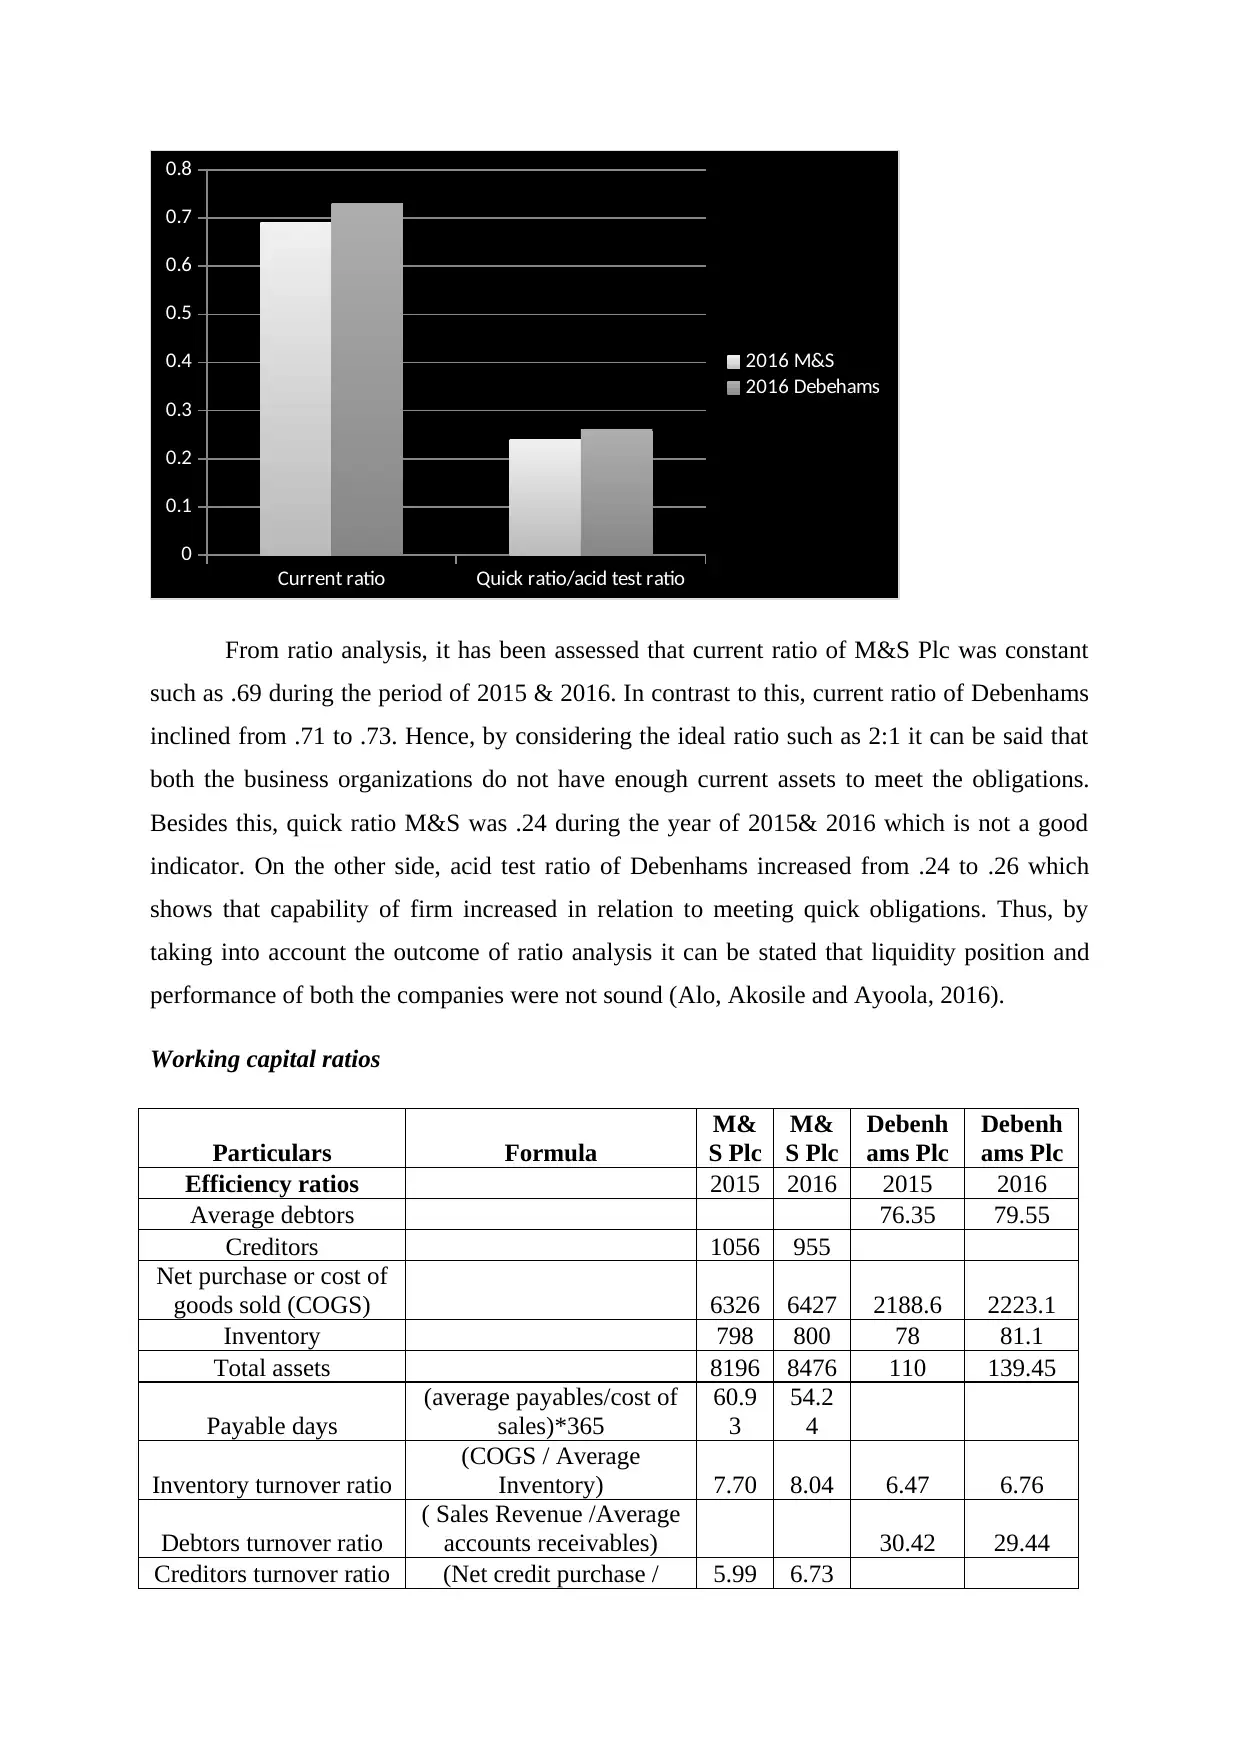
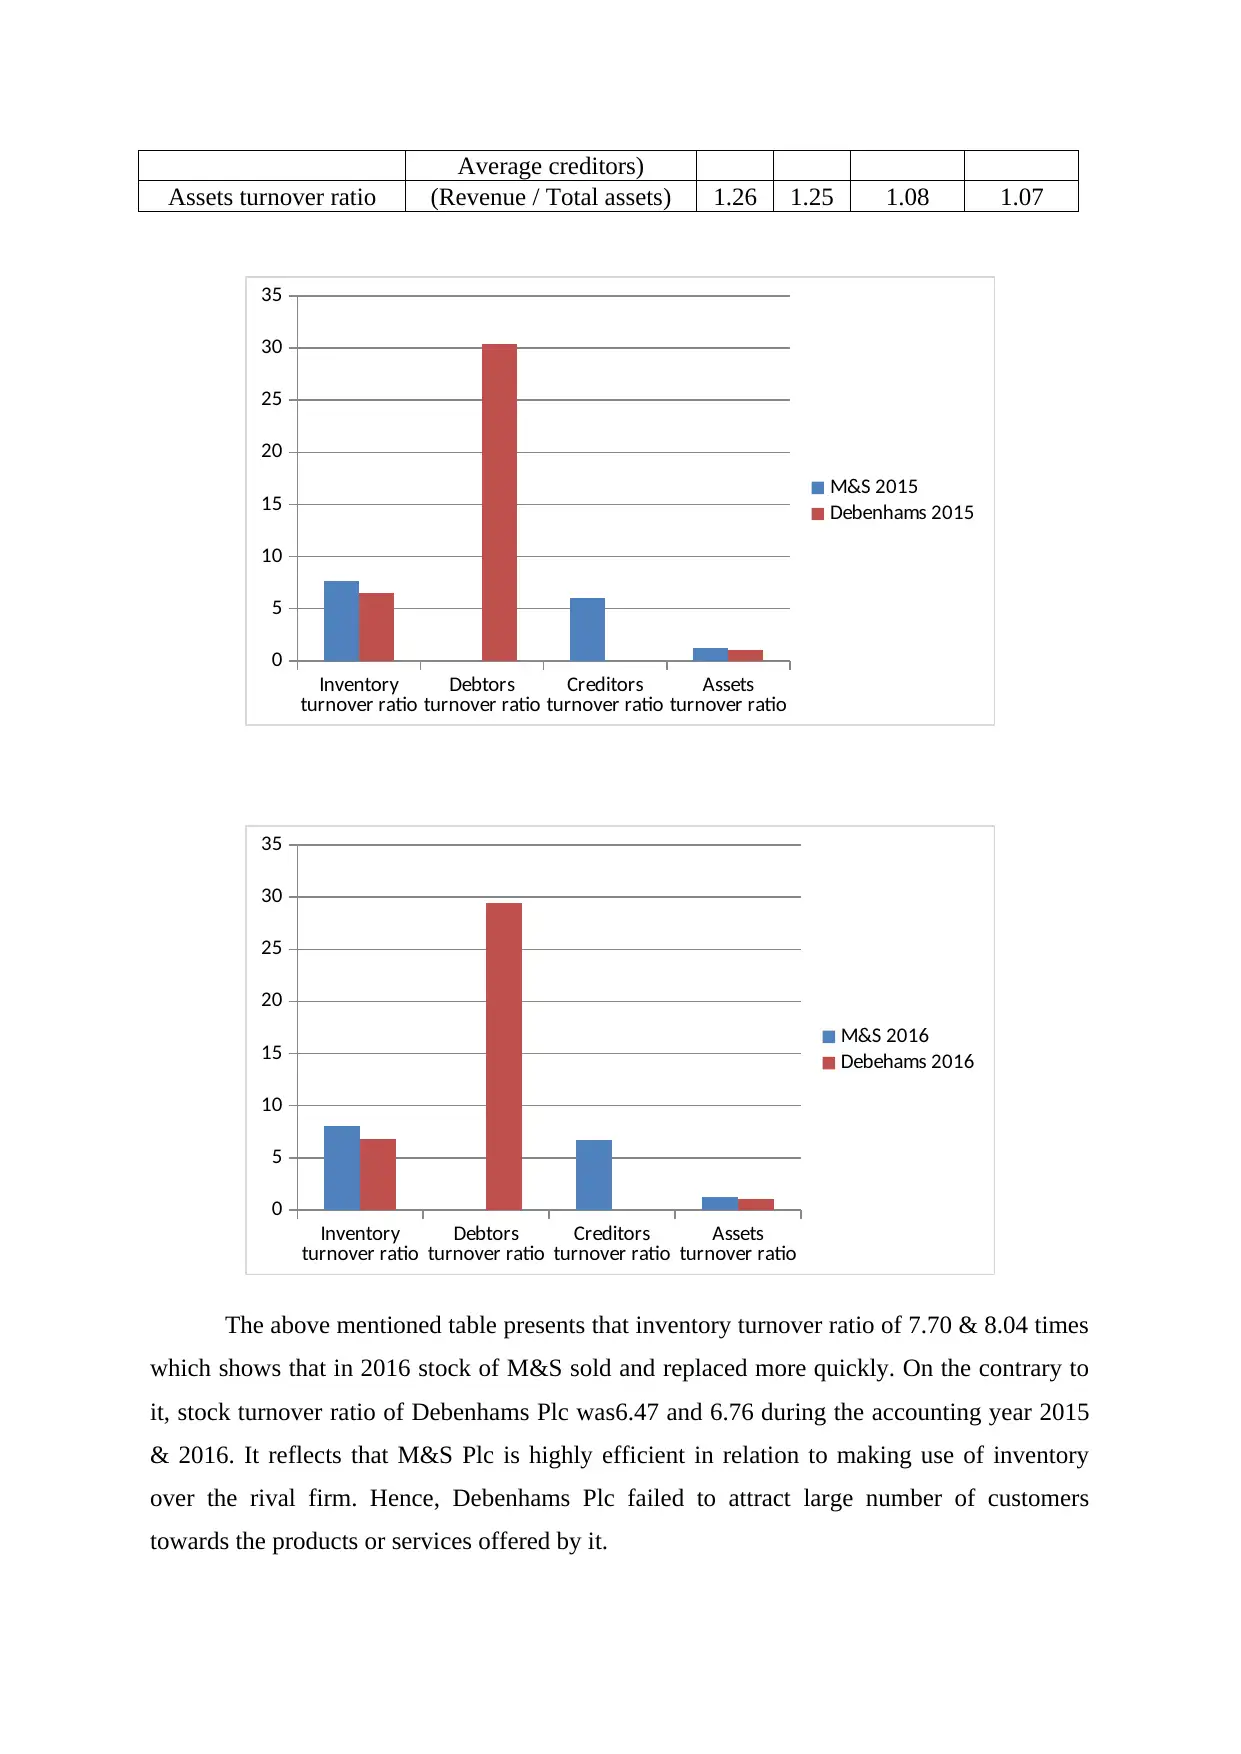
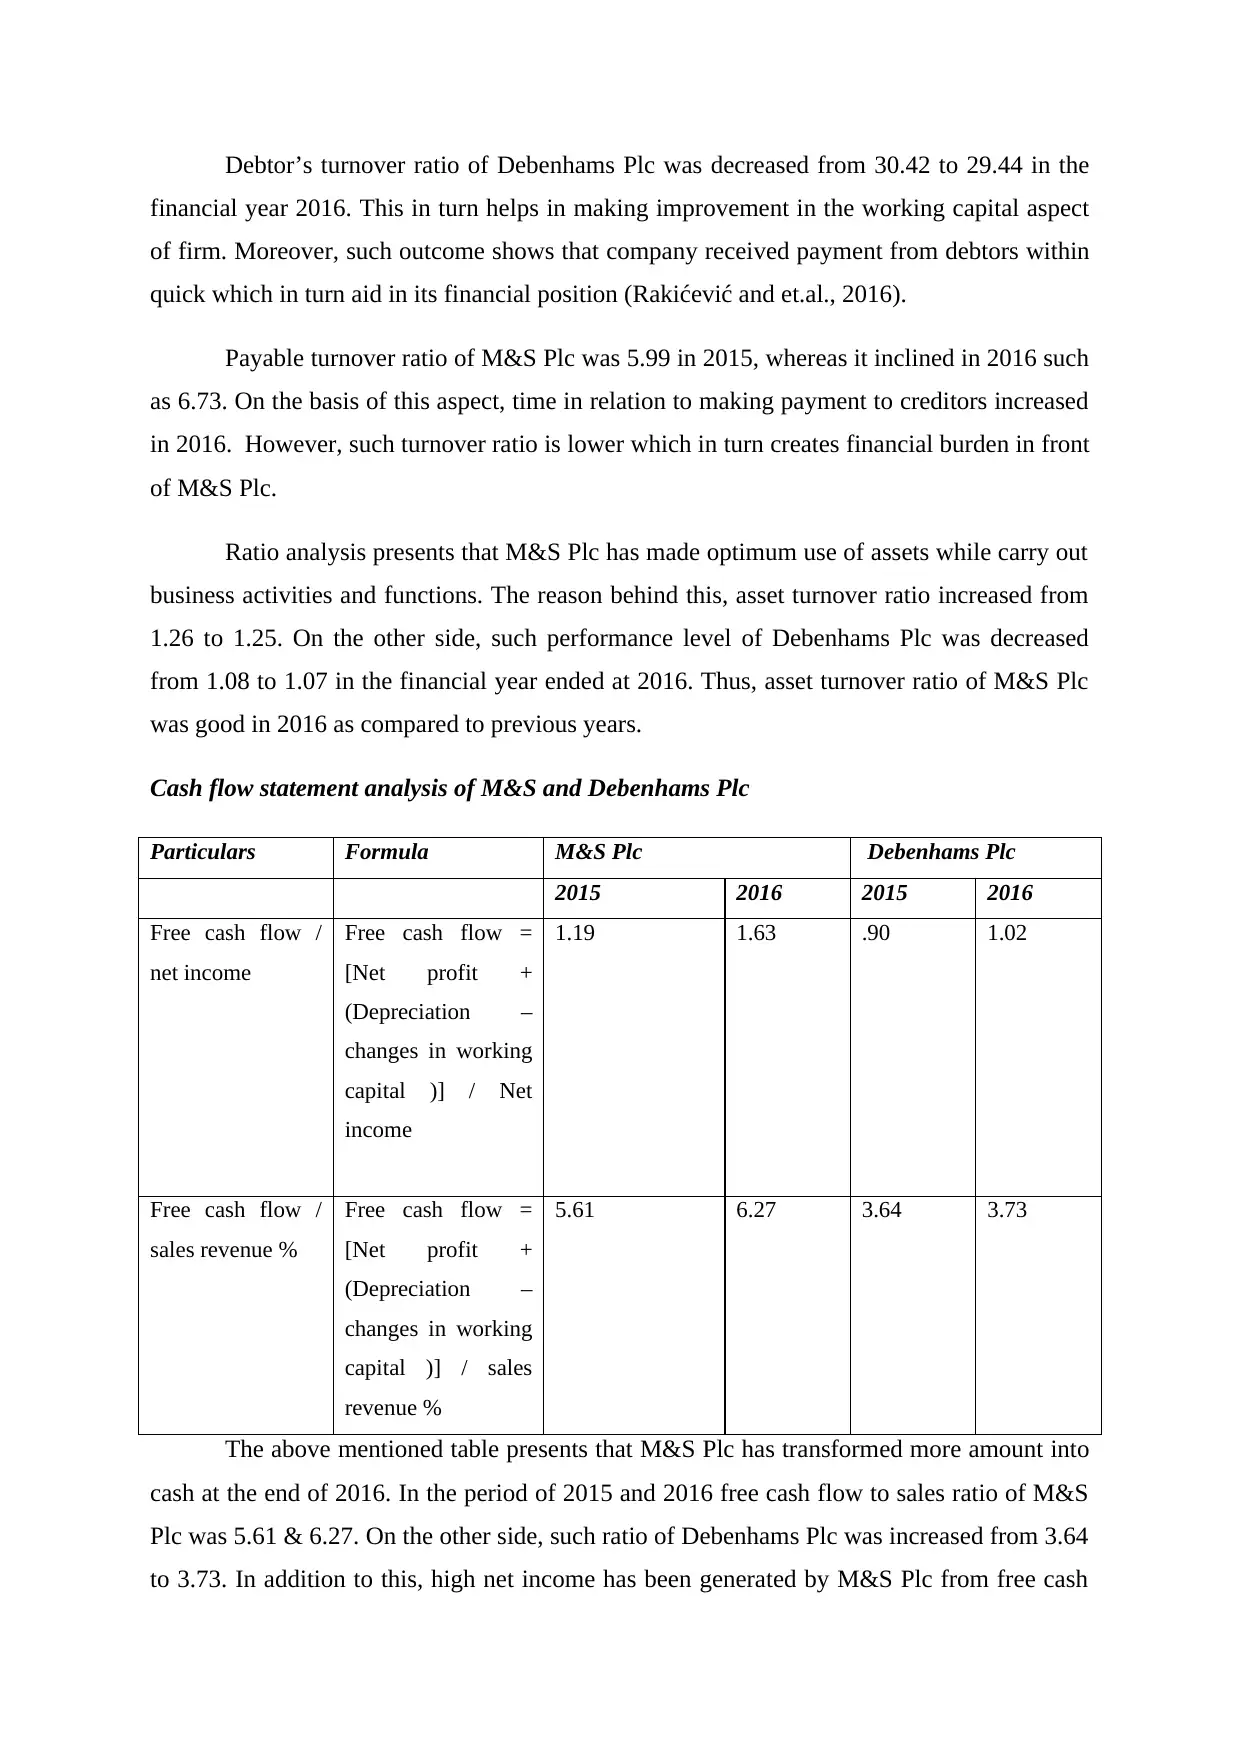
This report presents a comparative financial analysis of Marks & Spencer (M&S) Plc and Debenhams Plc, two major retail businesses in the UK. It employs financial ratio analysis, including profitability, liquidity, and working capital ratios, to evaluate their performance. The analysis covers the years 2015 and 2016, examining gross profit margin, net profit margin, return on equity, current ratio, quick ratio, inventory turnover, and other key metrics. The report also includes a cash flow statement analysis, assessing free cash flow generation. The findings highlight M&S Plc's strengths and weaknesses relative to Debenhams Plc, providing insights into their financial strategies and efficiency. The report concludes with recommendations for M&S Plc to improve its financial performance, such as enhancing cost control, managing current assets effectively, and optimizing asset utilization.

1 out of 10
Related Documents


Your All-in-One AI-Powered Toolkit for Academic Success.
+13062052269
info@desklib.com
Available 24*7 on WhatsApp / Email
![[object Object]](/_next/static/media/star-bottom.7253800d.svg)
Copyright © 2020–2026 A2Z Services. All Rights Reserved. Developed and managed by ZUCOL.