Analysis of Capital Structure and Financial Performance of ANZ Bank
VerifiedAdded on 2023/04/23
|18
|3830
|62
AI Summary
This report presents an analysis of the capital structure and financial performance of ANZ Bank, including debt equity ratio, return on equity ratio, and EPS. It also analyzes the impact of changes in interest rates on the bank's profitability and recommends strategies to improve the bank's financial performance.
Contribute Materials
Your contribution can guide someone’s learning journey. Share your
documents today.

Assessment 3
1
1
Secure Best Marks with AI Grader
Need help grading? Try our AI Grader for instant feedback on your assignments.
Part-A
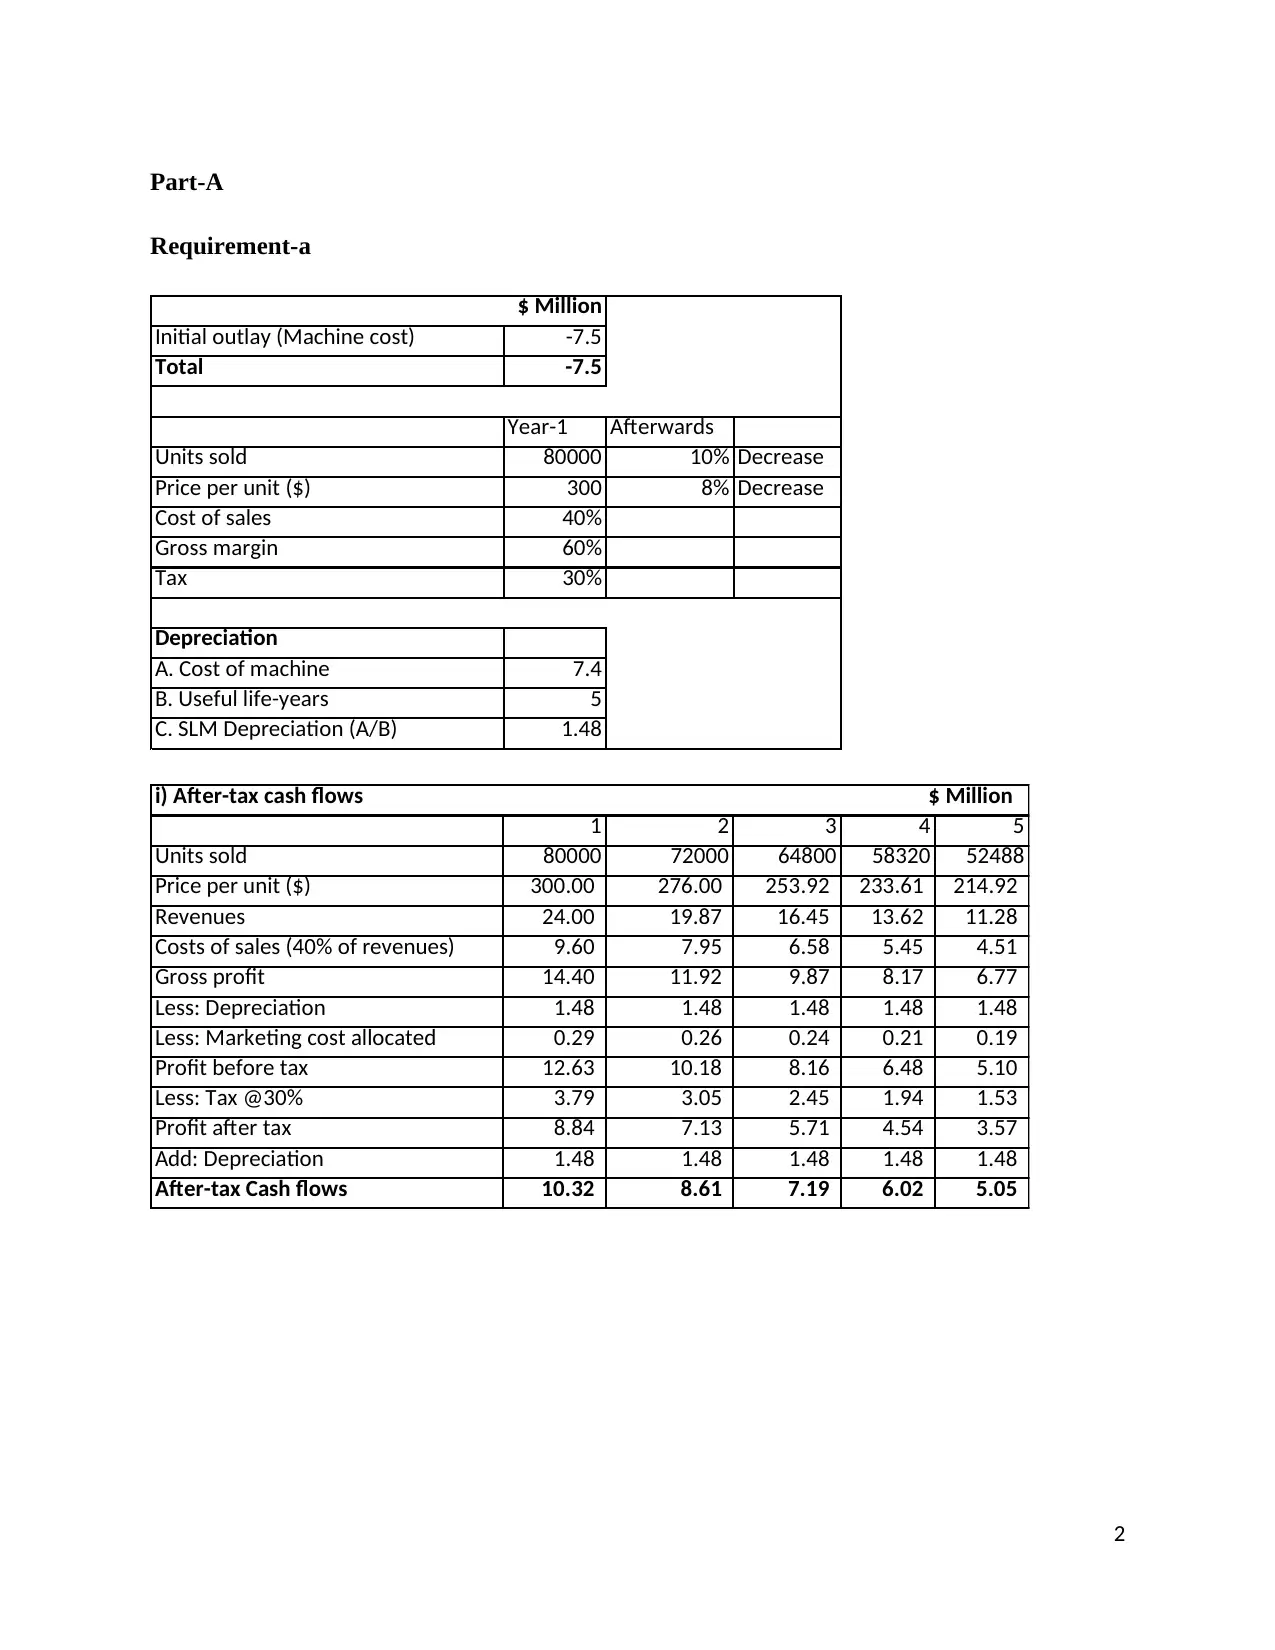
Requirement-a
$ Million
Initial outlay (Machine cost) -7.5
Total -7.5
Year-1 Afterwards
Units sold 80000 10% Decrease
Price per unit ($) 300 8% Decrease
Cost of sales 40%
Gross margin 60%
Tax 30%
Depreciation
A. Cost of machine 7.4
B. Useful life-years 5
C. SLM Depreciation (A/B) 1.48
1 2 3 4 5
Units sold 80000 72000 64800 58320 52488
Price per unit ($) 300.00 276.00 253.92 233.61 214.92
Revenues 24.00 19.87 16.45 13.62 11.28
Costs of sales (40% of revenues) 9.60 7.95 6.58 5.45 4.51
Gross profit 14.40 11.92 9.87 8.17 6.77
Less: Depreciation 1.48 1.48 1.48 1.48 1.48
Less: Marketing cost allocated 0.29 0.26 0.24 0.21 0.19
Profit before tax 12.63 10.18 8.16 6.48 5.10
Less: Tax @30% 3.79 3.05 2.45 1.94 1.53
Profit after tax 8.84 7.13 5.71 4.54 3.57
Add: Depreciation 1.48 1.48 1.48 1.48 1.48
After-tax Cash flows 10.32 8.61 7.19 6.02 5.05
i) After-tax cash flows $ Million
2
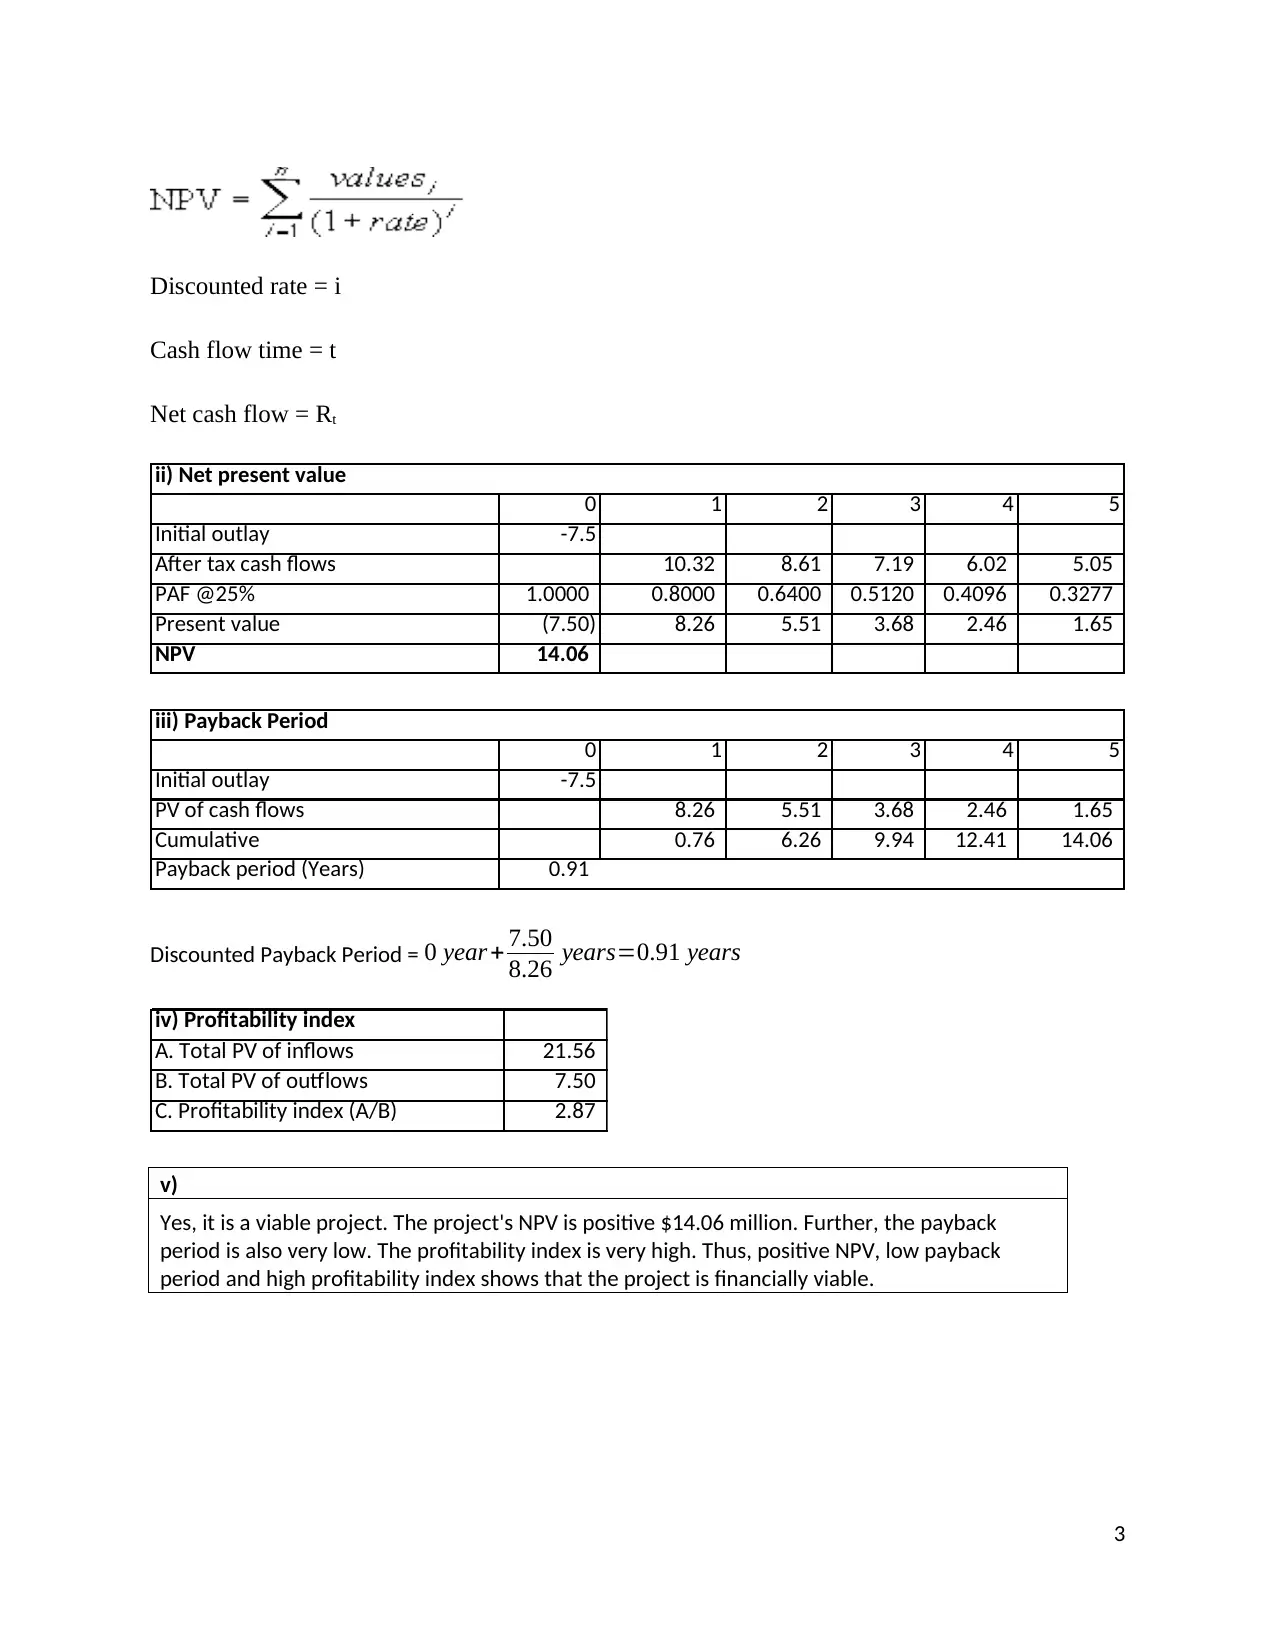
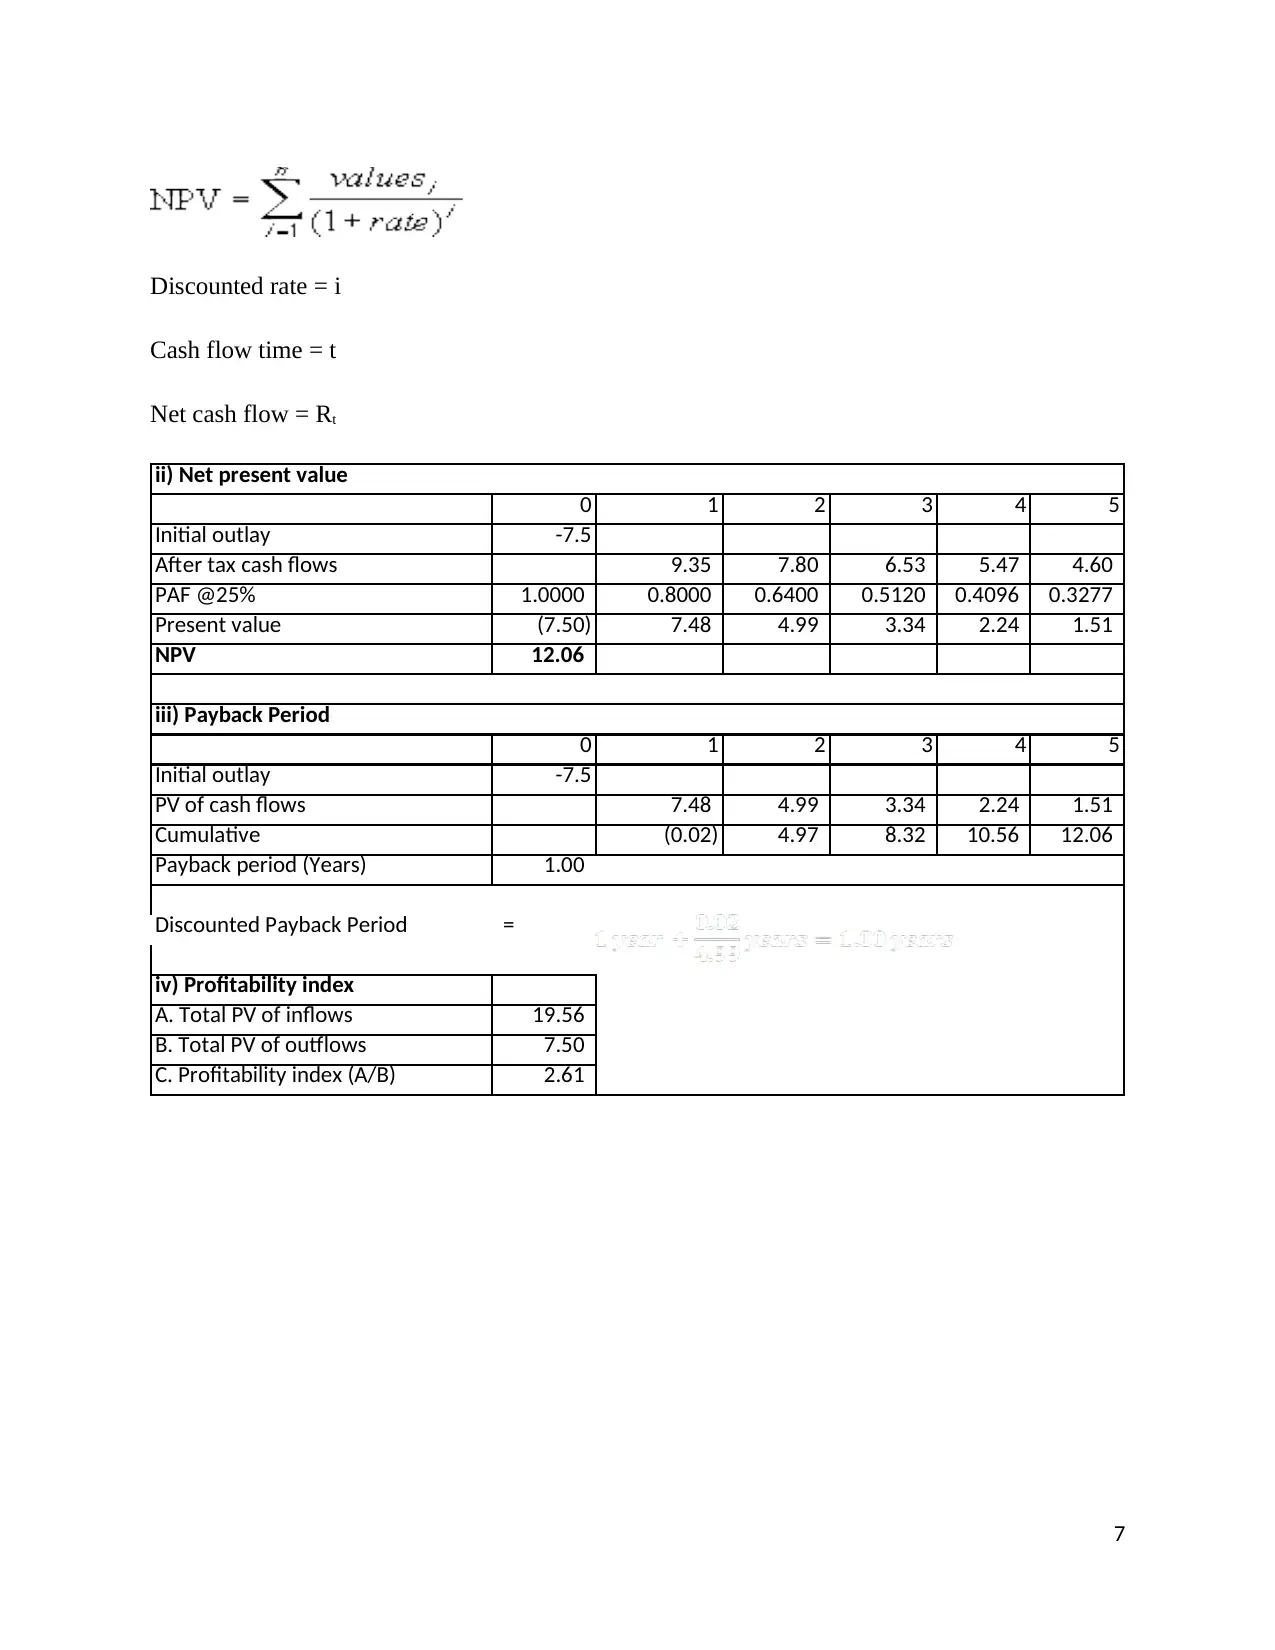
Discounted rate = i
Cash flow time = t
Net cash flow = Rt
0 1 2 3 4 5
Initial outlay -7.5
After tax cash flows 10.32 8.61 7.19 6.02 5.05
PAF @25% 1.0000 0.8000 0.6400 0.5120 0.4096 0.3277
Present value (7.50) 8.26 5.51 3.68 2.46 1.65
NPV 14.06
ii) Net present value
0 1 2 3 4 5
Initial outlay -7.5
PV of cash flows 8.26 5.51 3.68 2.46 1.65
Cumulative 0.76 6.26 9.94 12.41 14.06
Payback period (Years) 0.91
iii) Payback Period
Discounted Payback Period = 0 year+ 7.50
8.26 years=0.91 years
iv) Profitability index
A. Total PV of inflows 21.56
B. Total PV of outflows 7.50
C. Profitability index (A/B) 2.87
v)
Yes, it is a viable project. The project's NPV is positive $14.06 million. Further, the payback
period is also very low. The profitability index is very high. Thus, positive NPV, low payback
period and high profitability index shows that the project is financially viable.
3
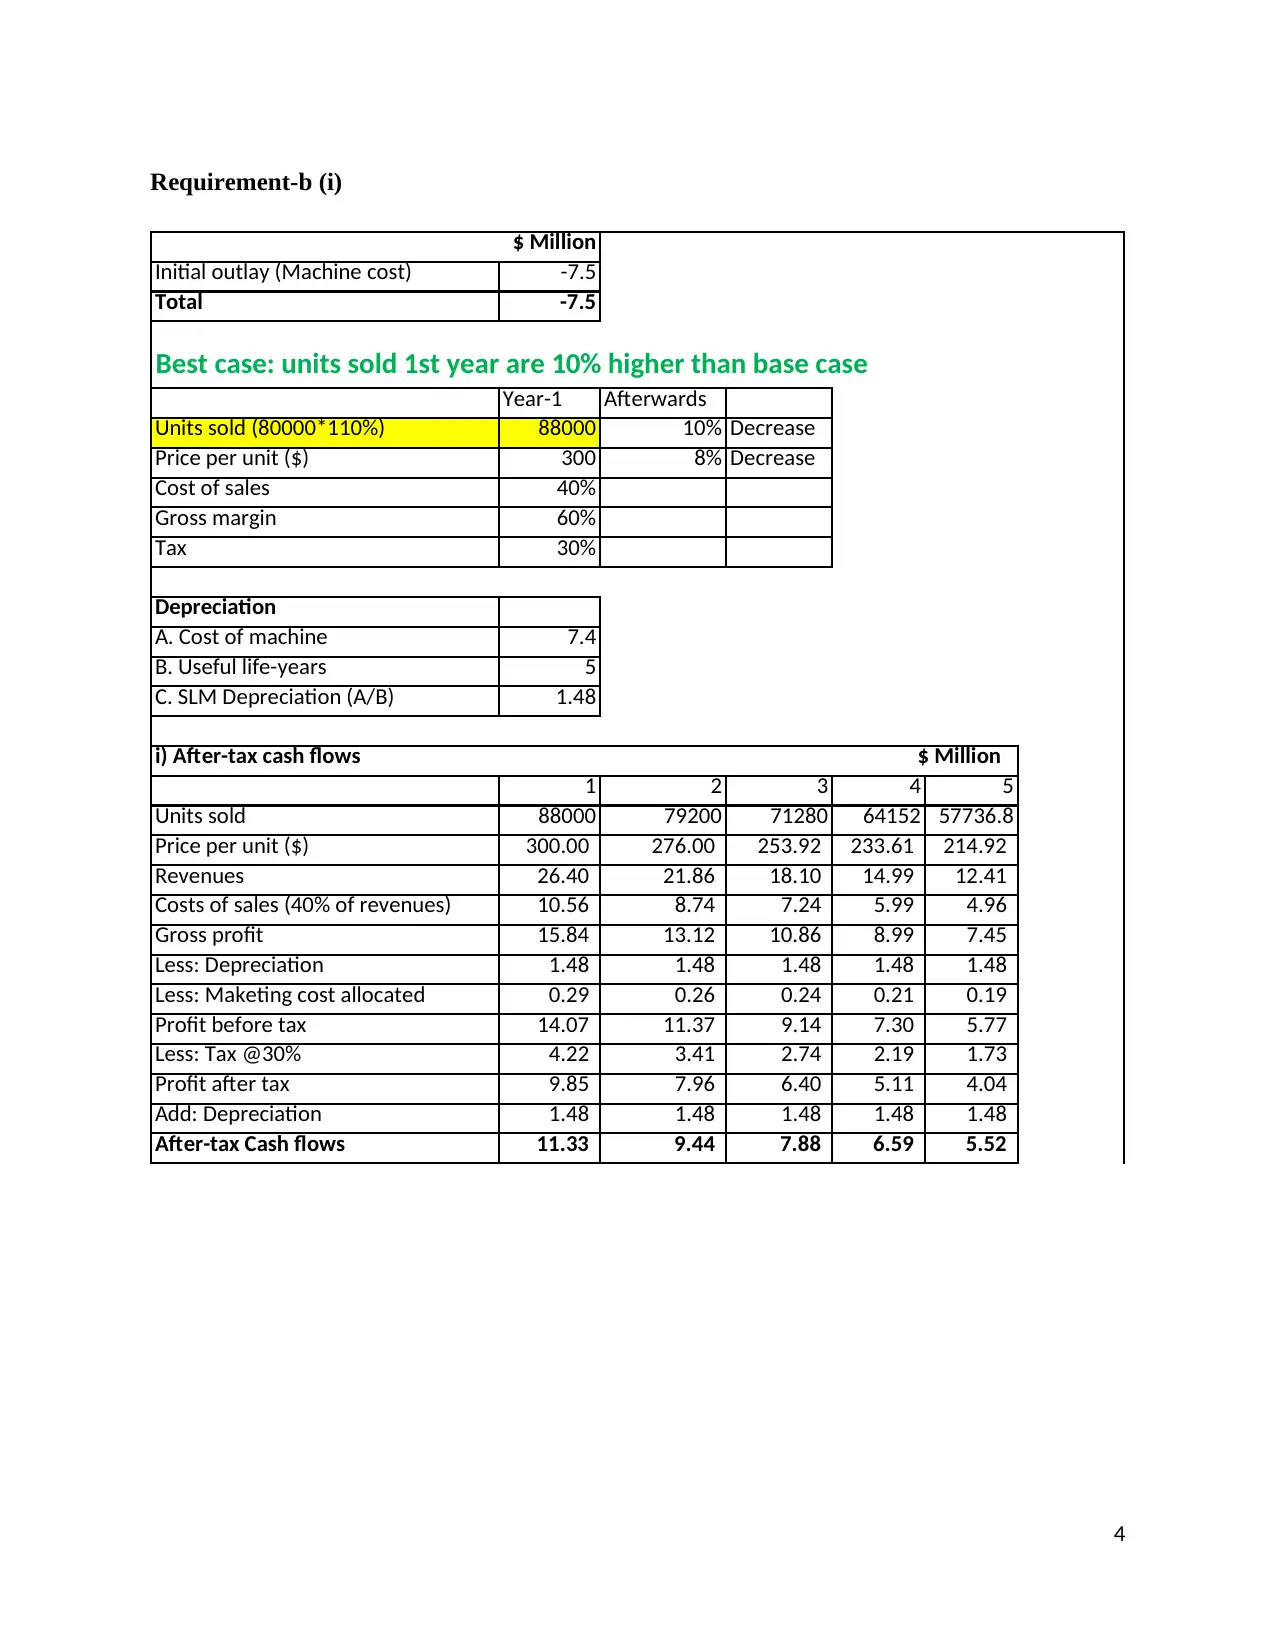
Requirement-b (i)
$ Million
Initial outlay (Machine cost) -7.5
Total -7.5
Best case: units sold 1st year are 10% higher than base case
Year-1 Afterwards
Units sold (80000*110%) 88000 10% Decrease
Price per unit ($) 300 8% Decrease
Cost of sales 40%
Gross margin 60%
Tax 30%
Depreciation
A. Cost of machine 7.4
B. Useful life-years 5
C. SLM Depreciation (A/B) 1.48
1 2 3 4 5
Units sold 88000 79200 71280 64152 57736.8
Price per unit ($) 300.00 276.00 253.92 233.61 214.92
Revenues 26.40 21.86 18.10 14.99 12.41
Costs of sales (40% of revenues) 10.56 8.74 7.24 5.99 4.96
Gross profit 15.84 13.12 10.86 8.99 7.45
Less: Depreciation 1.48 1.48 1.48 1.48 1.48
Less: Maketing cost allocated 0.29 0.26 0.24 0.21 0.19
Profit before tax 14.07 11.37 9.14 7.30 5.77
Less: Tax @30% 4.22 3.41 2.74 2.19 1.73
Profit after tax 9.85 7.96 6.40 5.11 4.04
Add: Depreciation 1.48 1.48 1.48 1.48 1.48
After-tax Cash flows 11.33 9.44 7.88 6.59 5.52
i) After-tax cash flows $ Million
4
Secure Best Marks with AI Grader
Need help grading? Try our AI Grader for instant feedback on your assignments.
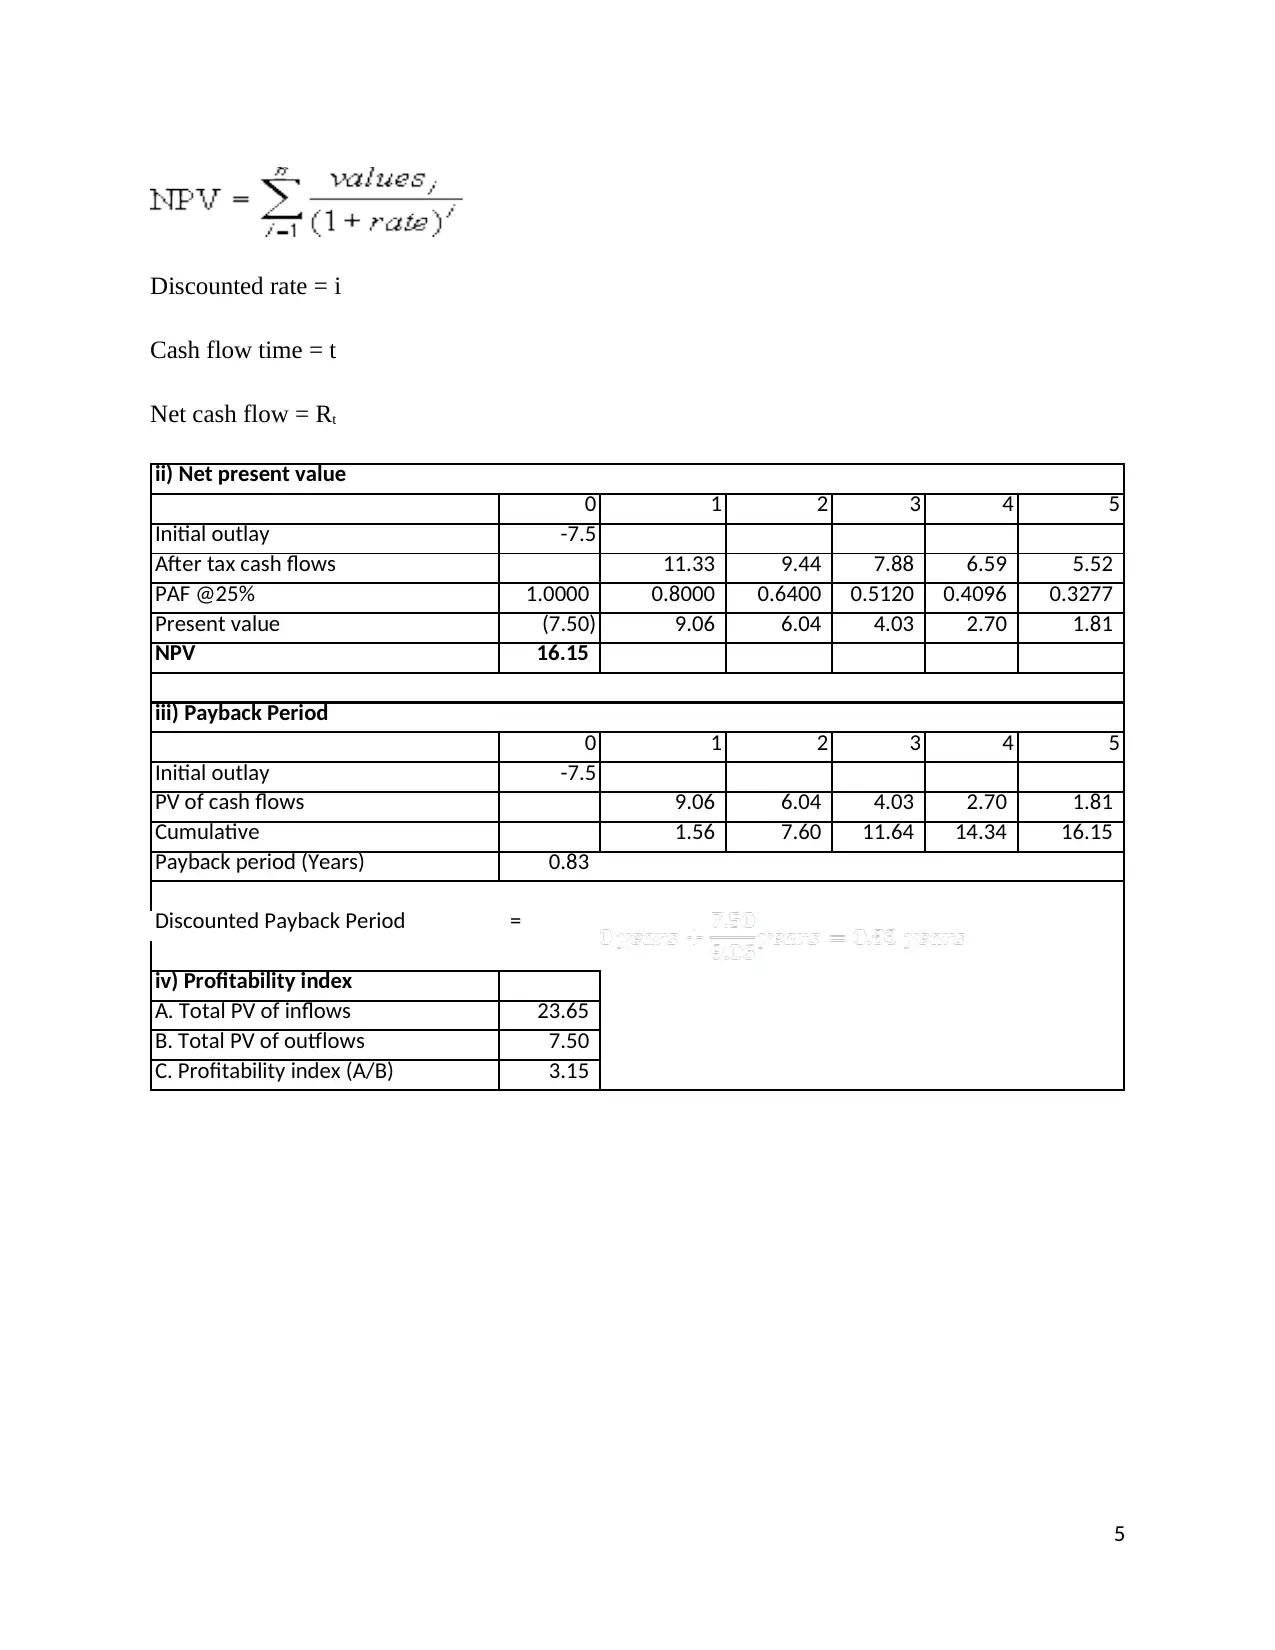
Discounted rate = i
Cash flow time = t
Net cash flow = Rt
0 1 2 3 4 5
Initial outlay -7.5
After tax cash flows 11.33 9.44 7.88 6.59 5.52
PAF @25% 1.0000 0.8000 0.6400 0.5120 0.4096 0.3277
Present value (7.50) 9.06 6.04 4.03 2.70 1.81
NPV 16.15
0 1 2 3 4 5
Initial outlay -7.5
PV of cash flows 9.06 6.04 4.03 2.70 1.81
Cumulative 1.56 7.60 11.64 14.34 16.15
Payback period (Years) 0.83
Discounted Payback Period =
iv) Profitability index
A. Total PV of inflows 23.65
B. Total PV of outflows 7.50
C. Profitability index (A/B) 3.15
ii) Net present value
iii) Payback Period
5
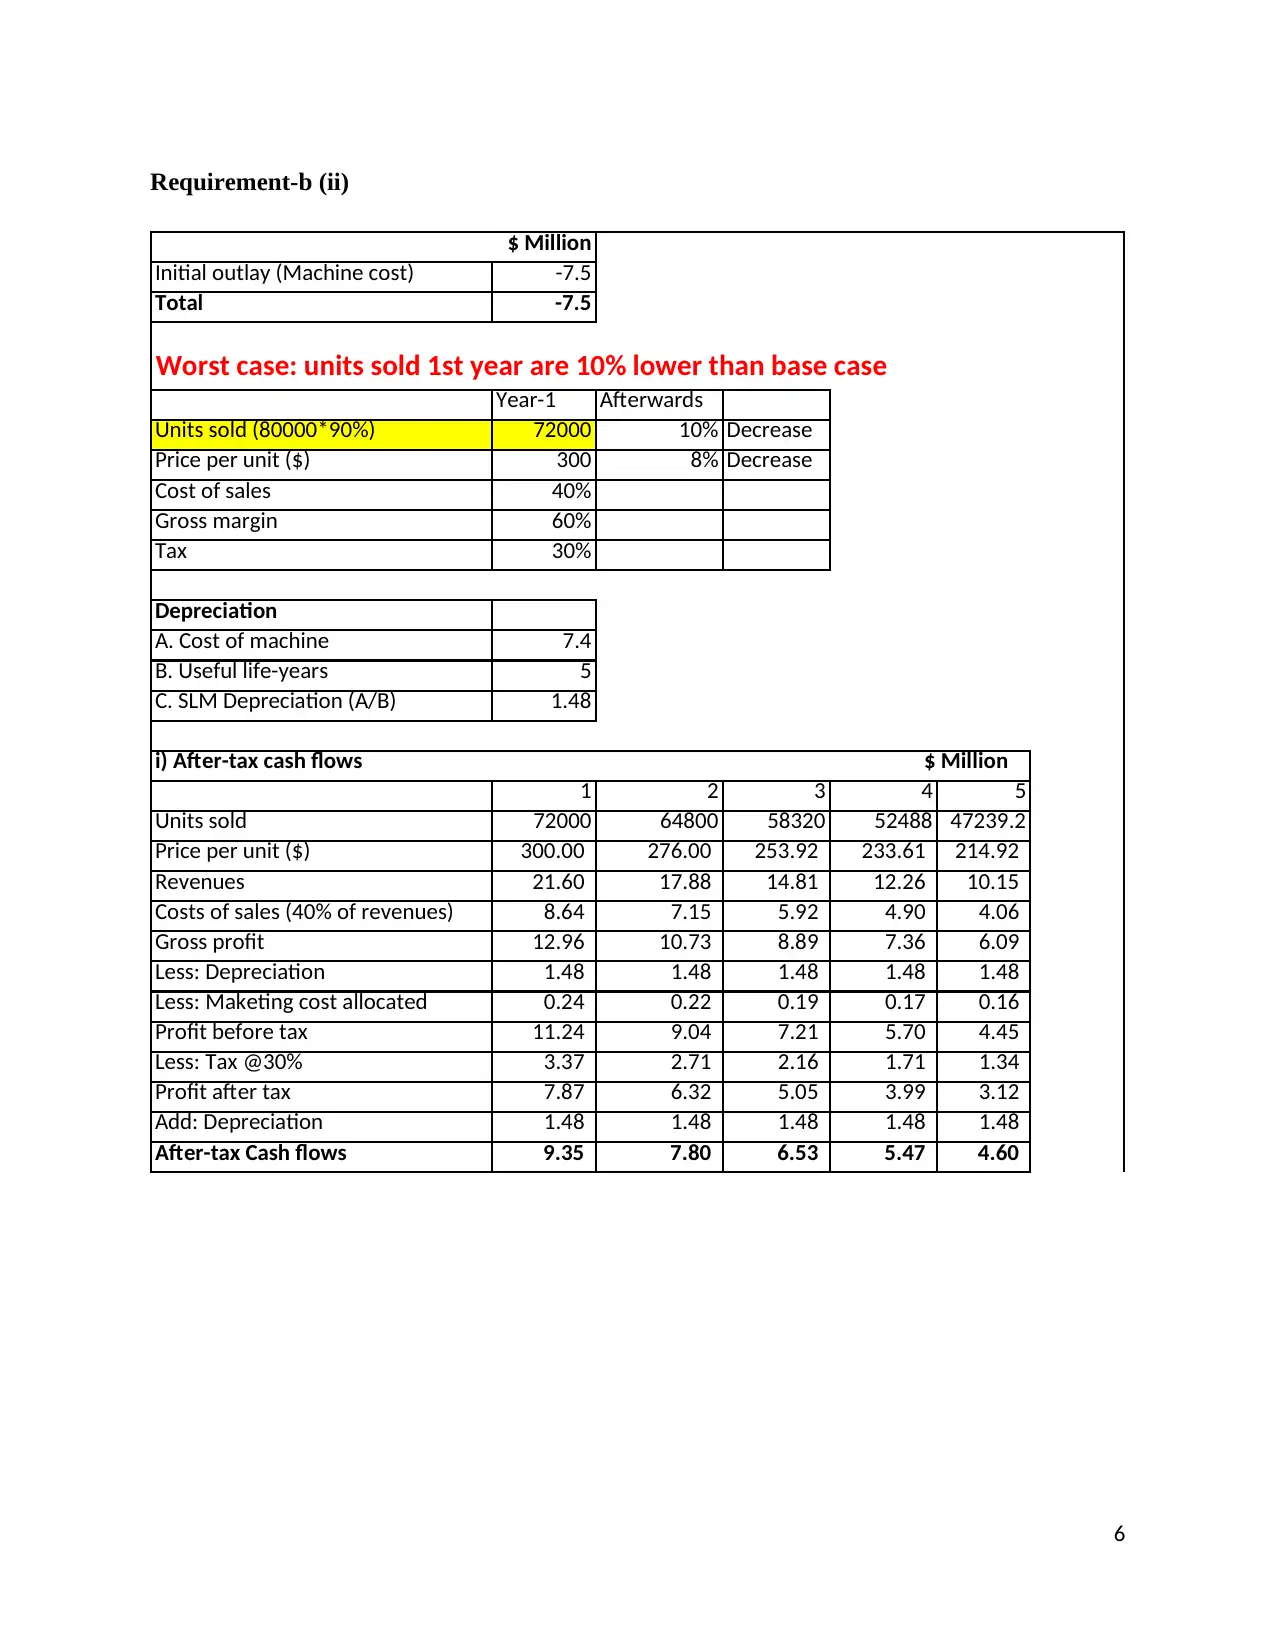
Requirement-b (ii)
$ Million
Initial outlay (Machine cost) -7.5
Total -7.5
Worst case: units sold 1st year are 10% lower than base case
Year-1 Afterwards
Units sold (80000*90%) 72000 10% Decrease
Price per unit ($) 300 8% Decrease
Cost of sales 40%
Gross margin 60%
Tax 30%
Depreciation
A. Cost of machine 7.4
B. Useful life-years 5
C. SLM Depreciation (A/B) 1.48
1 2 3 4 5
Units sold 72000 64800 58320 52488 47239.2
Price per unit ($) 300.00 276.00 253.92 233.61 214.92
Revenues 21.60 17.88 14.81 12.26 10.15
Costs of sales (40% of revenues) 8.64 7.15 5.92 4.90 4.06
Gross profit 12.96 10.73 8.89 7.36 6.09
Less: Depreciation 1.48 1.48 1.48 1.48 1.48
Less: Maketing cost allocated 0.24 0.22 0.19 0.17 0.16
Profit before tax 11.24 9.04 7.21 5.70 4.45
Less: Tax @30% 3.37 2.71 2.16 1.71 1.34
Profit after tax 7.87 6.32 5.05 3.99 3.12
Add: Depreciation 1.48 1.48 1.48 1.48 1.48
After-tax Cash flows 9.35 7.80 6.53 5.47 4.60
i) After-tax cash flows $ Million
6
Discounted rate = i
Cash flow time = t
Net cash flow = Rt
0 1 2 3 4 5
Initial outlay -7.5
After tax cash flows 9.35 7.80 6.53 5.47 4.60
PAF @25% 1.0000 0.8000 0.6400 0.5120 0.4096 0.3277
Present value (7.50) 7.48 4.99 3.34 2.24 1.51
NPV 12.06
0 1 2 3 4 5
Initial outlay -7.5
PV of cash flows 7.48 4.99 3.34 2.24 1.51
Cumulative (0.02) 4.97 8.32 10.56 12.06
Payback period (Years) 1.00
Discounted Payback Period =
iv) Profitability index
A. Total PV of inflows 19.56
B. Total PV of outflows 7.50
C. Profitability index (A/B) 2.61
ii) Net present value
iii) Payback Period
7
Paraphrase This Document
Need a fresh take? Get an instant paraphrase of this document with our AI Paraphraser
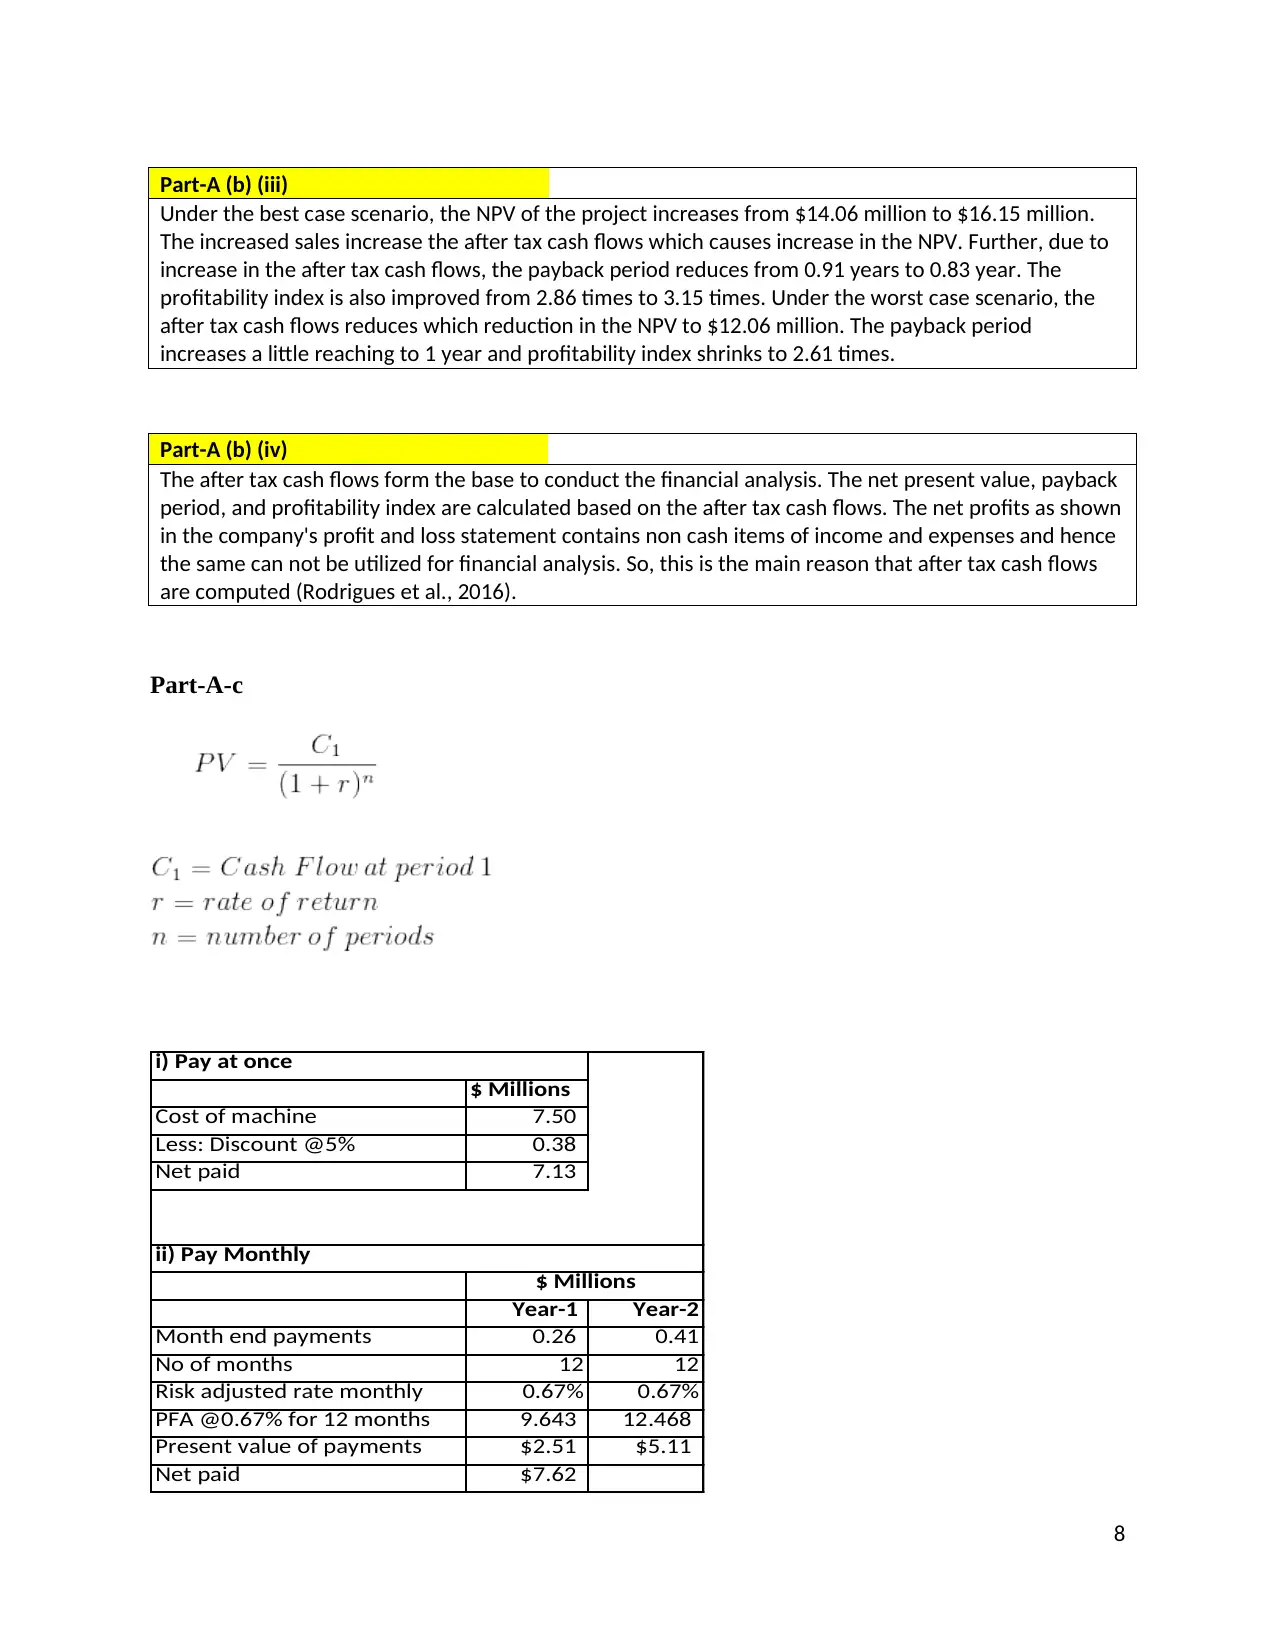
Part-A (b) (iii)
Under the best case scenario, the NPV of the project increases from $14.06 million to $16.15 million.
The increased sales increase the after tax cash flows which causes increase in the NPV. Further, due to
increase in the after tax cash flows, the payback period reduces from 0.91 years to 0.83 year. The
profitability index is also improved from 2.86 times to 3.15 times. Under the worst case scenario, the
after tax cash flows reduces which reduction in the NPV to $12.06 million. The payback period
increases a little reaching to 1 year and profitability index shrinks to 2.61 times.
Part-A (b) (iv)
The after tax cash flows form the base to conduct the financial analysis. The net present value, payback
period, and profitability index are calculated based on the after tax cash flows. The net profits as shown
in the company's profit and loss statement contains non cash items of income and expenses and hence
the same can not be utilized for financial analysis. So, this is the main reason that after tax cash flows
are computed (Rodrigues et al., 2016).
Part-A-c
$ Millions
Cost of machine 7.50
Less: Discount @5% 0.38
Net paid 7.13
Year-1 Year-2
Month end payments 0.26 0.41
No of months 12 12
Risk adjusted rate monthly 0.67% 0.67%
PFA @0.67% for 12 months 9.643 12.468
Present value of payments $2.51 $5.11
Net paid $7.62
i) Pay at once
$ Millions
ii) Pay Monthly
8
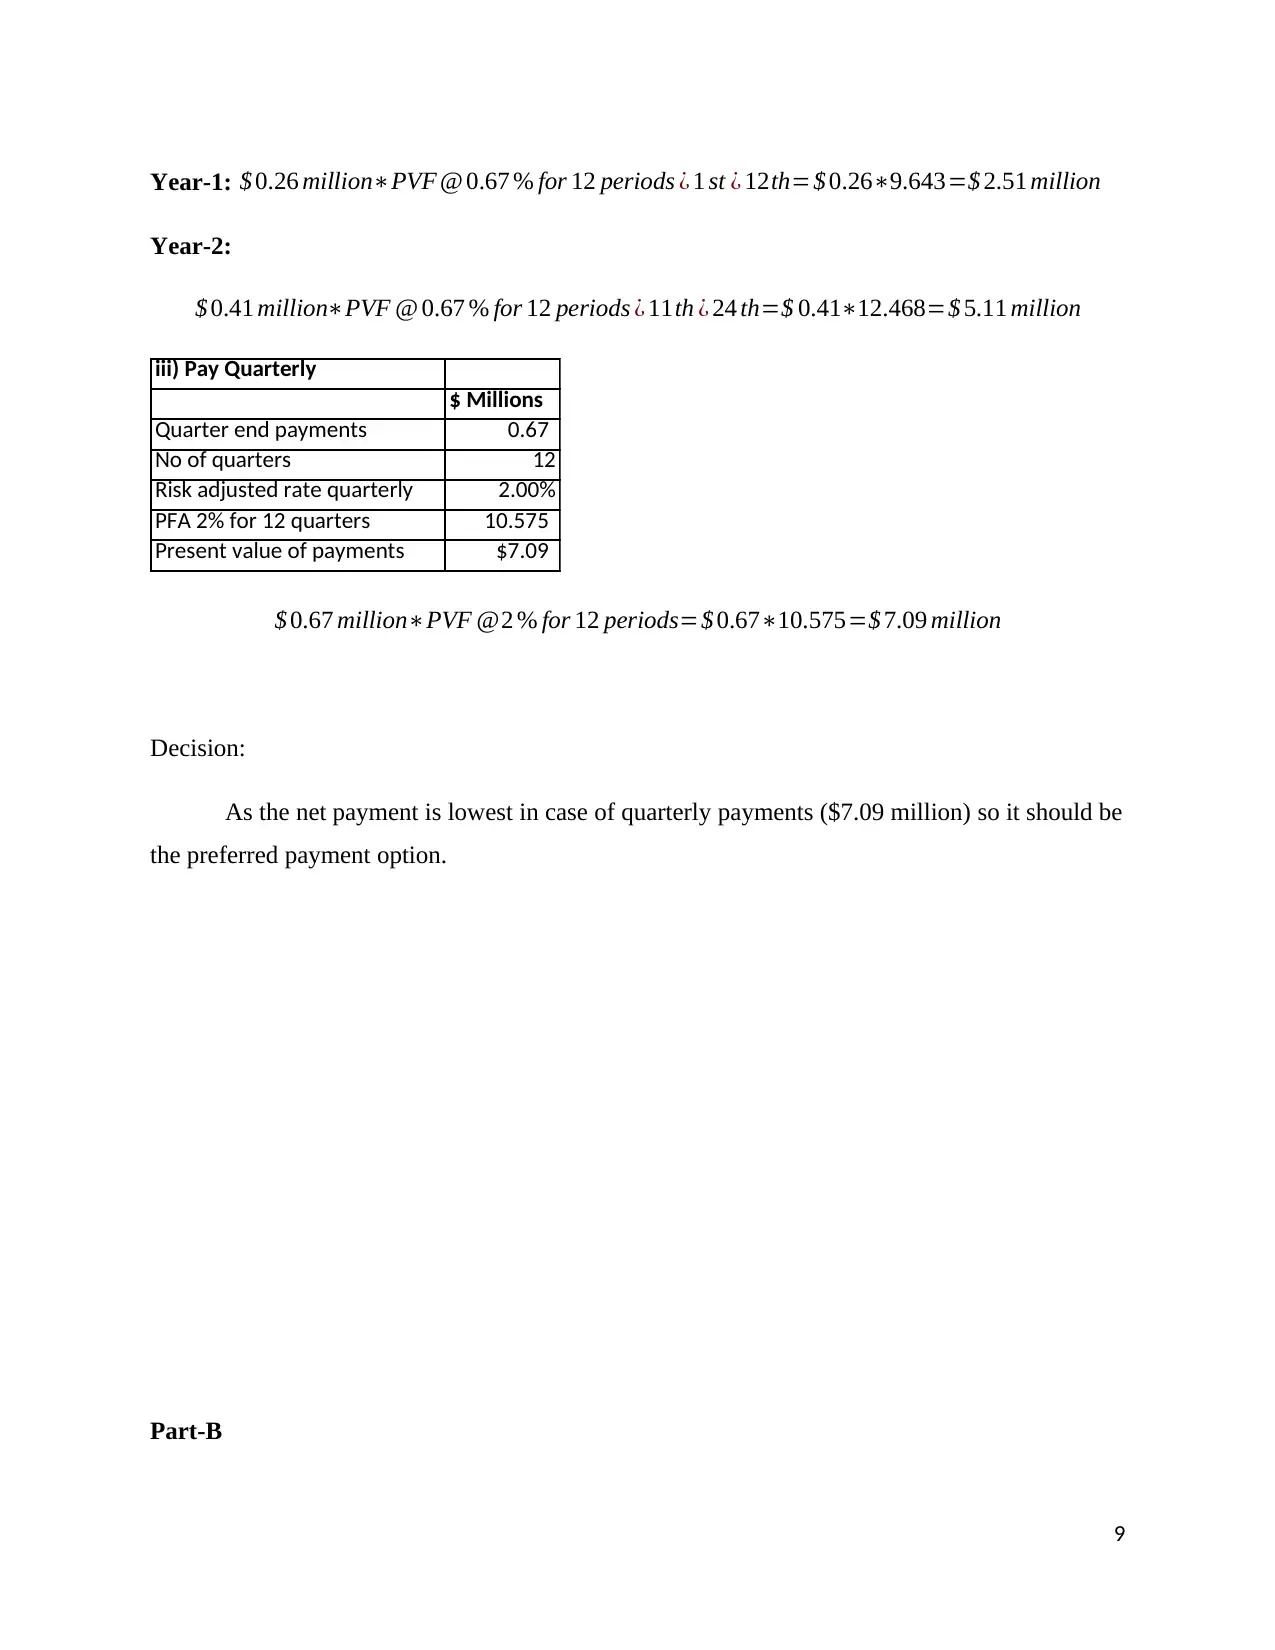
Year-1: $ 0.26 million∗PVF @ 0.67 % for 12 periods ¿ 1 st ¿ 12th=$ 0.26∗9.643=$ 2.51 million
Year-2:
$ 0.41 million∗PVF @ 0.67 % for 12 periods ¿ 11th ¿ 24 th=$ 0.41∗12.468=$ 5.11 million
iii) Pay Quarterly
$ Millions
Quarter end payments 0.67
No of quarters 12
Risk adjusted rate quarterly 2.00%
PFA 2% for 12 quarters 10.575
Present value of payments $7.09
$ 0.67 million∗PVF @2 % for 12 periods=$ 0.67∗10.575=$ 7.09 million
Decision:
As the net payment is lowest in case of quarterly payments ($7.09 million) so it should be
the preferred payment option.
Part-B
9
Executive Summary
This report presents an analysis of the capital structure and financial performance of ANZ
Bank. The capital structure of the bank has been static with little or few changes in the
composition of debt and equity. More or less, the debt equity ratio of the bank has been found to
be 0.86:1, which indicates that the bank is using more debt than equity. Further, the return on
equity ratio (11.90%) and EPS (237.1 cents) show improvement in the profitability. The liquidity
position of the bank is also good as shown by the improved liquidity coverage ratio (135%).
Introduction
The report presented here deals with the financial analysis of ANZ Bank. The ANZ Bank
is one of the top most banks operating in Australia and New Zealand. The report presents an
analysis of the capital structure and cost of capital of the bank. Further, the report also puts light
on the financial performance of the bank.
Analysis of the Capital Structure of ANZ
The capital structure of a firm shows the composition of its capital funds. A firm may
arrange funds from various sources which mainly fall in two primary categories such as equity
and debt. Different sources of funds have incurs different costs and have different risk
characteristics. Therefore, it becomes essential for a firm to analyze its capital structure and
optimize the cost of capital and risk.
The capital structure of ANZ Bank for the year 2017 has been analyzed as under:
10
Secure Best Marks with AI Grader
Need help grading? Try our AI Grader for instant feedback on your assignments.
Particulars Amount ($M) % to total
Debt
Deposits and other borrowings 595,611.00
Debt issuances 107,973.00
Total 703,584.00 86%
Equity
Share capital (market cap) 86,352.39
Reserves 37.00
Retained earnings 29,834.00
Total 116,223.39 14%
Grand total 819,807.39
ANZ's current capital structure: 2017
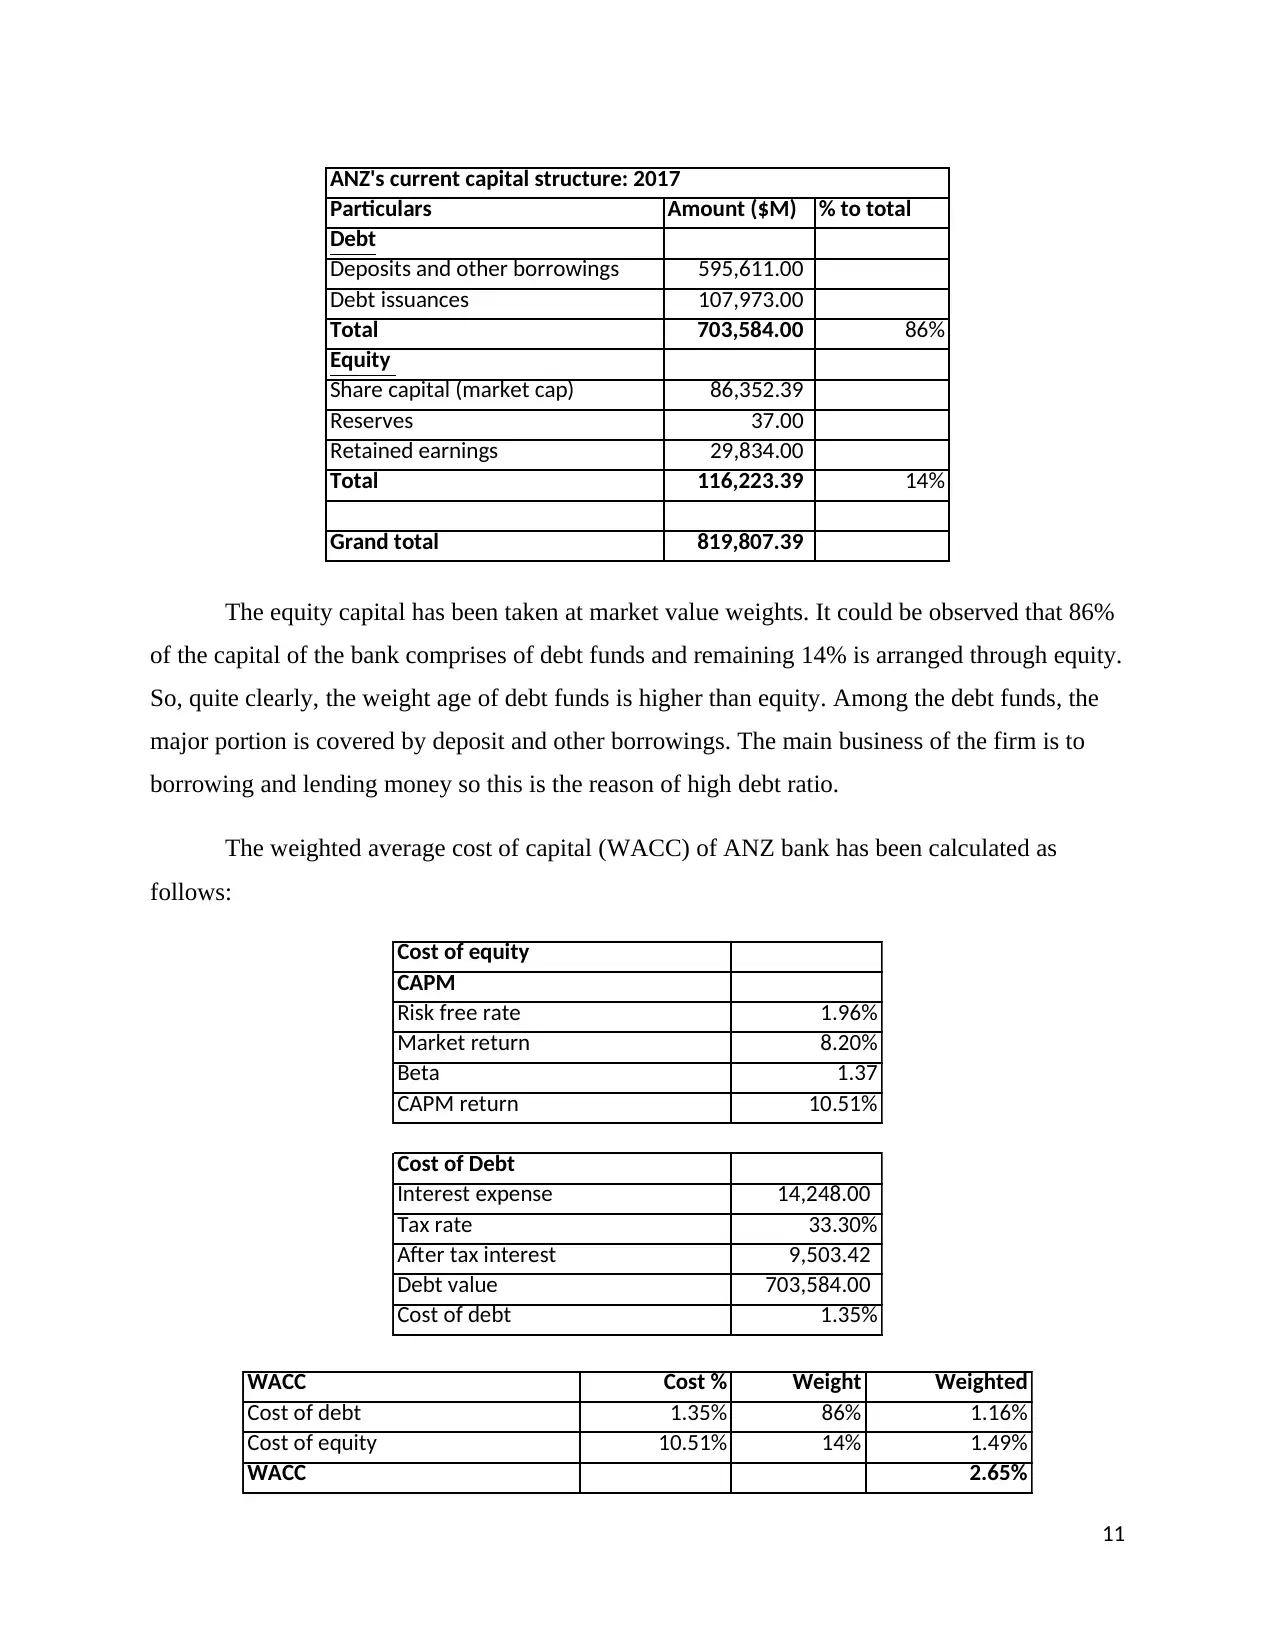
The equity capital has been taken at market value weights. It could be observed that 86%
of the capital of the bank comprises of debt funds and remaining 14% is arranged through equity.
So, quite clearly, the weight age of debt funds is higher than equity. Among the debt funds, the
major portion is covered by deposit and other borrowings. The main business of the firm is to
borrowing and lending money so this is the reason of high debt ratio.
The weighted average cost of capital (WACC) of ANZ bank has been calculated as
follows:
Cost of equity
CAPM
Risk free rate 1.96%
Market return 8.20%
Beta 1.37
CAPM return 10.51%
Cost of Debt
Interest expense 14,248.00
Tax rate 33.30%
After tax interest 9,503.42
Debt value 703,584.00
Cost of debt 1.35%
WACC Cost % Weight Weighted
Cost of debt 1.35% 86% 1.16%
Cost of equity 10.51% 14% 1.49%
WACC 2.65%
11
Debt
Deposits and other borrowings 595,611.00
Debt issuances 107,973.00
Total 703,584.00 86%
Equity
Share capital (market cap) 86,352.39
Reserves 37.00
Retained earnings 29,834.00
Total 116,223.39 14%
Grand total 819,807.39
ANZ's current capital structure: 2017
The equity capital has been taken at market value weights. It could be observed that 86%
of the capital of the bank comprises of debt funds and remaining 14% is arranged through equity.
So, quite clearly, the weight age of debt funds is higher than equity. Among the debt funds, the
major portion is covered by deposit and other borrowings. The main business of the firm is to
borrowing and lending money so this is the reason of high debt ratio.
The weighted average cost of capital (WACC) of ANZ bank has been calculated as
follows:
Cost of equity
CAPM
Risk free rate 1.96%
Market return 8.20%
Beta 1.37
CAPM return 10.51%
Cost of Debt
Interest expense 14,248.00
Tax rate 33.30%
After tax interest 9,503.42
Debt value 703,584.00
Cost of debt 1.35%
WACC Cost % Weight Weighted
Cost of debt 1.35% 86% 1.16%
Cost of equity 10.51% 14% 1.49%
WACC 2.65%
11
The cost of equity has been computed applying the CAPM model. The cost of equity is
10.51% which is higher than the cost of debt of 1.35%. The weight of debt in the total capital of
the bank is 86%. So, the bank is using low cost funds more than the equity which incurs high
cost. Due to this composition, the weighted average cost of capital of the bank is 2.65% which
can be said to be quite low.
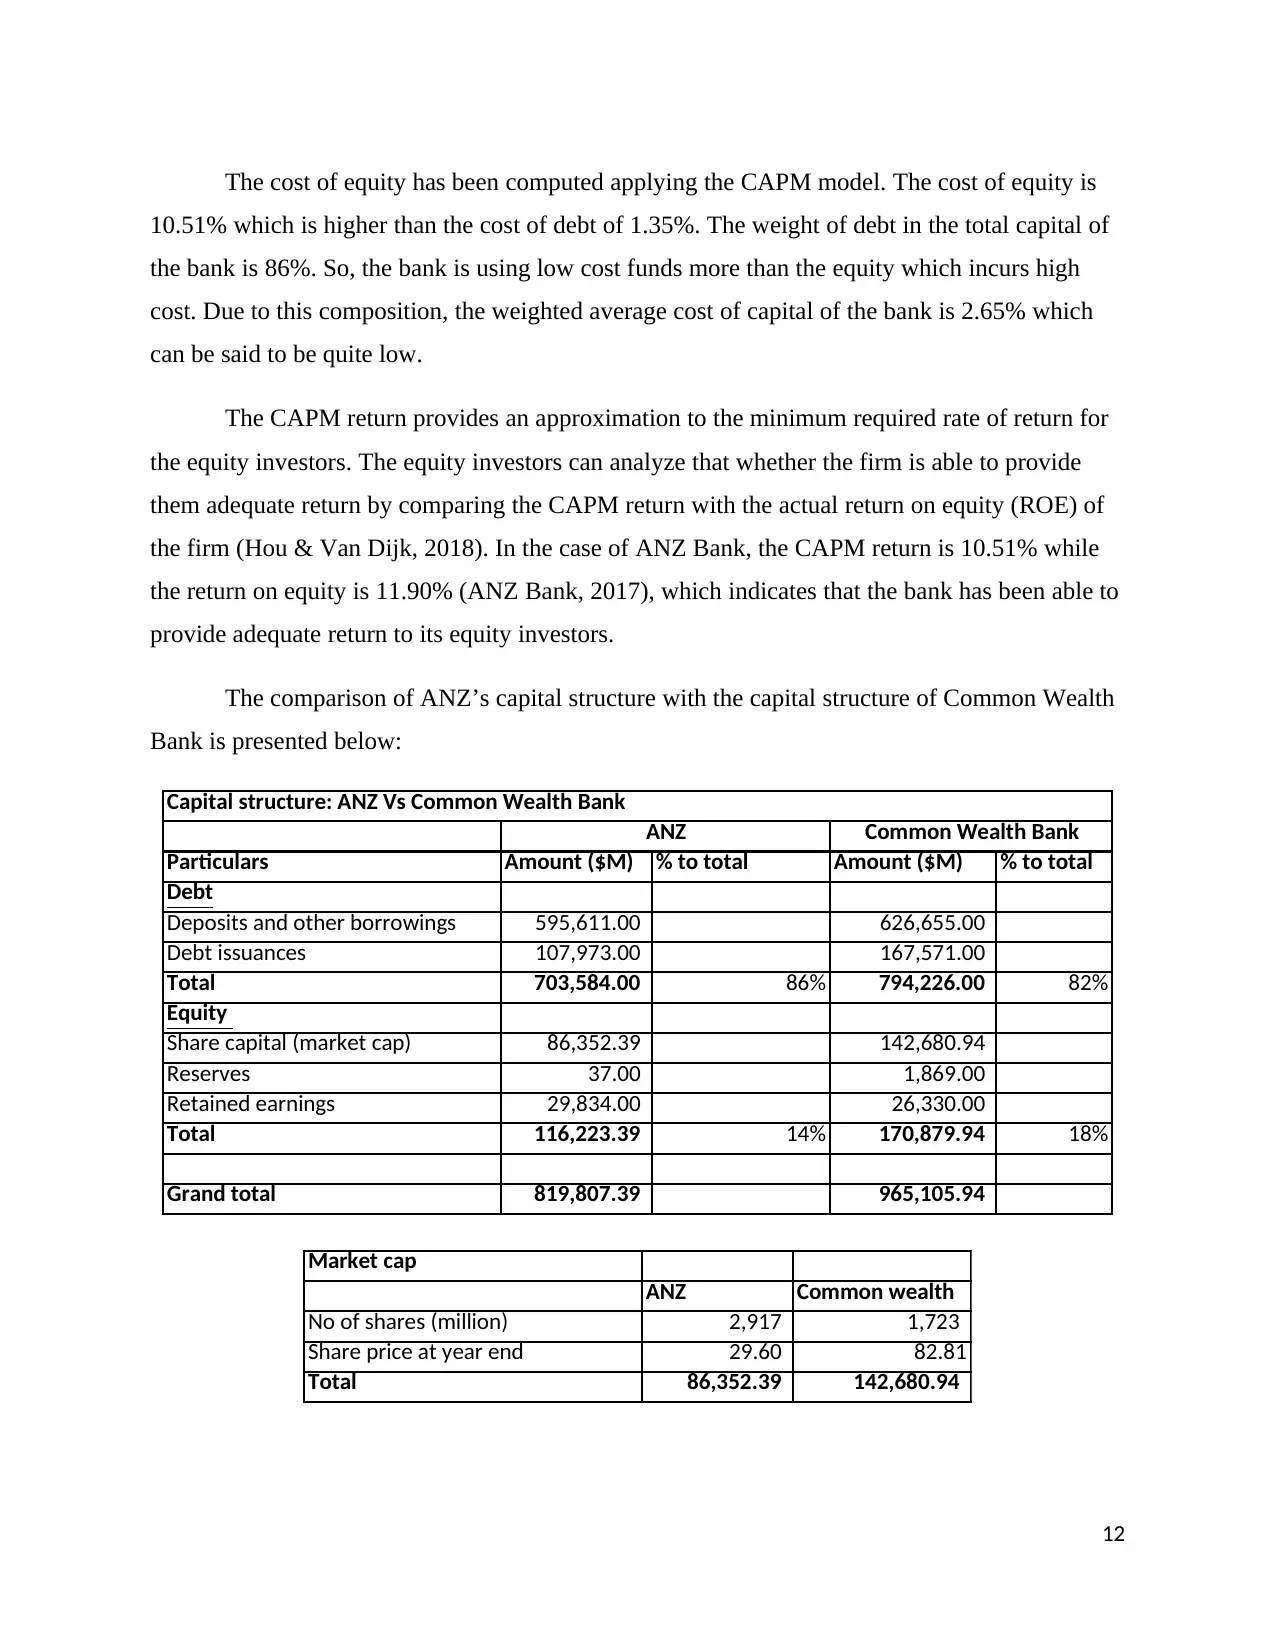
The CAPM return provides an approximation to the minimum required rate of return for
the equity investors. The equity investors can analyze that whether the firm is able to provide
them adequate return by comparing the CAPM return with the actual return on equity (ROE) of
the firm (Hou & Van Dijk, 2018). In the case of ANZ Bank, the CAPM return is 10.51% while
the return on equity is 11.90% (ANZ Bank, 2017), which indicates that the bank has been able to
provide adequate return to its equity investors.
The comparison of ANZ’s capital structure with the capital structure of Common Wealth
Bank is presented below:
Particulars Amount ($M) % to total Amount ($M) % to total
Debt
Deposits and other borrowings 595,611.00 626,655.00
Debt issuances 107,973.00 167,571.00
Total 703,584.00 86% 794,226.00 82%
Equity
Share capital (market cap) 86,352.39 142,680.94
Reserves 37.00 1,869.00
Retained earnings 29,834.00 26,330.00
Total 116,223.39 14% 170,879.94 18%
Grand total 819,807.39 965,105.94
Capital structure: ANZ Vs Common Wealth Bank
ANZ Common Wealth Bank
Market cap
ANZ Common wealth
No of shares (million) 2,917 1,723
Share price at year end 29.60 82.81
Total 86,352.39 142,680.94
12
10.51% which is higher than the cost of debt of 1.35%. The weight of debt in the total capital of
the bank is 86%. So, the bank is using low cost funds more than the equity which incurs high
cost. Due to this composition, the weighted average cost of capital of the bank is 2.65% which
can be said to be quite low.
The CAPM return provides an approximation to the minimum required rate of return for
the equity investors. The equity investors can analyze that whether the firm is able to provide
them adequate return by comparing the CAPM return with the actual return on equity (ROE) of
the firm (Hou & Van Dijk, 2018). In the case of ANZ Bank, the CAPM return is 10.51% while
the return on equity is 11.90% (ANZ Bank, 2017), which indicates that the bank has been able to
provide adequate return to its equity investors.
The comparison of ANZ’s capital structure with the capital structure of Common Wealth
Bank is presented below:
Particulars Amount ($M) % to total Amount ($M) % to total
Debt
Deposits and other borrowings 595,611.00 626,655.00
Debt issuances 107,973.00 167,571.00
Total 703,584.00 86% 794,226.00 82%
Equity
Share capital (market cap) 86,352.39 142,680.94
Reserves 37.00 1,869.00
Retained earnings 29,834.00 26,330.00
Total 116,223.39 14% 170,879.94 18%
Grand total 819,807.39 965,105.94
Capital structure: ANZ Vs Common Wealth Bank
ANZ Common Wealth Bank
Market cap
ANZ Common wealth
No of shares (million) 2,917 1,723
Share price at year end 29.60 82.81
Total 86,352.39 142,680.94
12
The Common Wealth Bank is one of the core competitors of ANZ Bank. The comparison
of capital structure of ANZ Bank with the capital structure of Common Wealth Bank shows that
ANZ uses more debt. The Common Wealth Bank uses 82% debt while ANZ uses 86%. Use of
more debt signifies that Bank is relies more on debt than equity funds. However, it may be noted
that keeping financing structure this way may help the company to keep the cost of capital low
but at the same time it also gives rise to risk of solvency.
Evaluation of ANZ Limited’s Performance
Ratio analysis provides an insight into the financial performance of a firm and forms a
strong basis to compare and analyze the trend. In the case of ANZ Bank, five key financial ratios
such as return on equity, cost to income, common equity tier-1, earning per share, and liquidity
coverage ratio have been analyzed.
The return on equity depicts the percentage return earned by the firm relative to the
equity investment. The higher the return on equity better will be the financial performance of the
firm (Valverde, Solas, & Fernández, 2016). The return on equity helps in analyzing the
profitability of the firm and this is main reason that this ratio is considered one of crucial ratios in
the financial analysis. In respect of ANZ, it was observed that the firm earned a return on equity
of 10.30% in the year 2016 which increased to 11.90% in the current year (Appendix). The
increase in return on equity clearly indicates that the profitability of the bank has improved in the
current year. Further, the earning per share (EPS) ratio also indicates the same trend in
profitability. The EPS of the bank increased to 237.10 cents in 2017 from 202.60 cents in 2016
(Appendix).
The improvement in the profitability seems to be majorly driven by the reduction in the
cost. The cost to income ratio is used to analyze the trend in costs incurred by a firm. In respect
of ANZ, the cost to income ratio was 50.70% in 2016 which declined to 46.10% in the year 2017
(Appendix). The decline in the cost to income ratio indicates that the bank has been efficient in
terms of utilization of the resources. The efficiency in utilization of the resources has caused
improvement in the profitability as shown by the increase in return on equity.
13
Paraphrase This Document
Need a fresh take? Get an instant paraphrase of this document with our AI Paraphraser
The common equity tier-1 ratio is important in analyzing liquidity risk in case of a
banking firm. This ratio indicates percentage of core equity capital of the bank to the total risk
weighted assets (Valverde, Solas, & Fernández, 2016). In case of ANZ, the ratio was found to be
9.60% in 2016 which increased slightly to reach 10.60% in 2017 (Appendix). The increase in the
ratio indicates that the core equity capital relative to total risk weighted assets has increased
which implies reduction in the liquidity risk.
Further, analysis of liquidity could be done by applying liquidity coverage ratio. The
liquidity coverage ratio shows percentage of high quality liquid assets to total net cash outflows
(Valverde, Solas, & Fernández, 2016). The higher the ratio better would be the liquidity position
of the firm. It has been found that ANZ Bank had liquidity coverage ratio of 126% in 2016
which increased to 135% in 2017 (Appendix). The increase in ratio depicts improvements in the
liquidity position of the bank.
Significant Changes to the ANZ's Capital Structure in Past Three Years
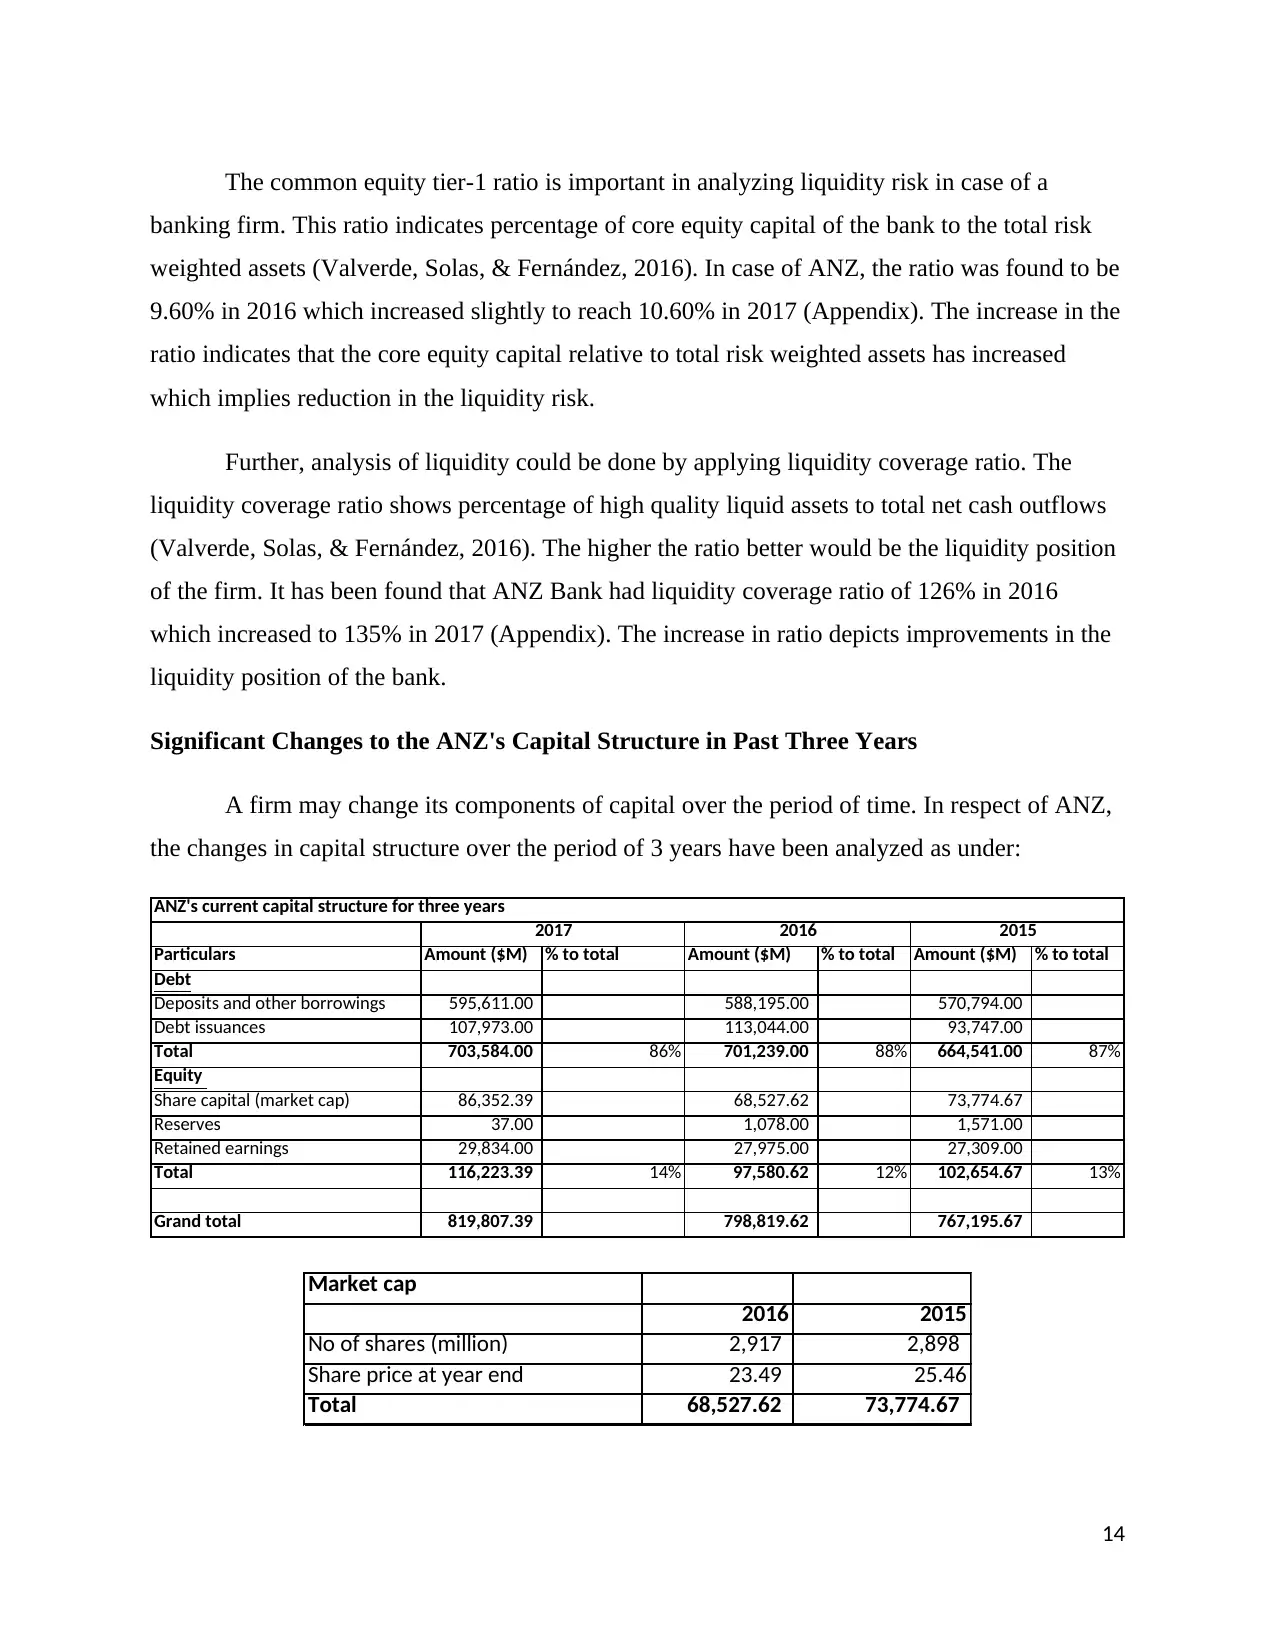
A firm may change its components of capital over the period of time. In respect of ANZ,
the changes in capital structure over the period of 3 years have been analyzed as under:
Particulars Amount ($M) % to total Amount ($M) % to total Amount ($M) % to total
Debt
Deposits and other borrowings 595,611.00 588,195.00 570,794.00
Debt issuances 107,973.00 113,044.00 93,747.00
Total 703,584.00 86% 701,239.00 88% 664,541.00 87%
Equity
Share capital (market cap) 86,352.39 68,527.62 73,774.67
Reserves 37.00 1,078.00 1,571.00
Retained earnings 29,834.00 27,975.00 27,309.00
Total 116,223.39 14% 97,580.62 12% 102,654.67 13%
Grand total 819,807.39 798,819.62 767,195.67
2015
ANZ's current capital structure for three years
2017 2016
Market cap
2016 2015
No of shares (million) 2,917 2,898
Share price at year end 23.49 25.46
Total 68,527.62 73,774.67
14
banking firm. This ratio indicates percentage of core equity capital of the bank to the total risk
weighted assets (Valverde, Solas, & Fernández, 2016). In case of ANZ, the ratio was found to be
9.60% in 2016 which increased slightly to reach 10.60% in 2017 (Appendix). The increase in the
ratio indicates that the core equity capital relative to total risk weighted assets has increased
which implies reduction in the liquidity risk.
Further, analysis of liquidity could be done by applying liquidity coverage ratio. The
liquidity coverage ratio shows percentage of high quality liquid assets to total net cash outflows
(Valverde, Solas, & Fernández, 2016). The higher the ratio better would be the liquidity position
of the firm. It has been found that ANZ Bank had liquidity coverage ratio of 126% in 2016
which increased to 135% in 2017 (Appendix). The increase in ratio depicts improvements in the
liquidity position of the bank.
Significant Changes to the ANZ's Capital Structure in Past Three Years
A firm may change its components of capital over the period of time. In respect of ANZ,
the changes in capital structure over the period of 3 years have been analyzed as under:
Particulars Amount ($M) % to total Amount ($M) % to total Amount ($M) % to total
Debt
Deposits and other borrowings 595,611.00 588,195.00 570,794.00
Debt issuances 107,973.00 113,044.00 93,747.00
Total 703,584.00 86% 701,239.00 88% 664,541.00 87%
Equity
Share capital (market cap) 86,352.39 68,527.62 73,774.67
Reserves 37.00 1,078.00 1,571.00
Retained earnings 29,834.00 27,975.00 27,309.00
Total 116,223.39 14% 97,580.62 12% 102,654.67 13%
Grand total 819,807.39 798,819.62 767,195.67
2015
ANZ's current capital structure for three years
2017 2016
Market cap
2016 2015
No of shares (million) 2,917 2,898
Share price at year end 23.49 25.46
Total 68,527.62 73,774.67
14
The data presented above shows that there has not been any significant change in the
components of the capital used by the bank over the period of three years. In the year 2015, the
bank was running its business with 87% debt and 13% equity. This changed slightly in the year
2016 showing increase in debt to 88% and reduction in equity to 12%. In the year 2017, the bank
again lowered the debt portion to keep to 86%.
Analysis of Reputation Risk of ANZ
It is the primary duty of the directors to act with integrity and assume accountability to
improve financial performance of the business and ensure that business runs in the best of its
stakeholder’s interest. The board of directors of a firm sits at the top the governance system. The
success of the business lies in strengthening the governance mechanism within the firm and
ensuring adequate transparency. Transparency implies bringing all facts to the knowledge of
relevant stakeholder. So, the board of director being the supreme governing body of the firm
should ensure that all the stakeholders of the business are informed adequately on the matters of
their concern. For this purpose, the board should ensure that the adequate and appropriate
disclosures are made in the annual report of the company.
The findings of Banking Royal Commission reveal that ANZ bank has been found to be
involved in conducting misleading business. The ANZ Bank has misled its customers as well as
its investors. ANZ’s Chief Shyane Elliott agreed to the misconducts of the bank and assured to
regain the lost faith of its customers and investors. The results of enquiry show that the bank was
offering fraudulent products to its customers. The bank brought in a new investment scheme
which purposefully framed in such a manner that ultimately was to put the customer at losing
end. ANZ bank is at the verge of losing its licence because of introducing fraudulent products for
sale to its customers.
The findings of Banking Royal Commission clearly indicate that all was not going well in
the bank and there were many things which should have been brought to the notice of the
stakeholders. However, the board of directors of the company failed in making adequate and
appropriate disclosures. The board of directors concealed the facts of misconduct which were
brought to the light by the Banking Royal Commission. Thus, it could be said that the bank has
15
not been able to manage its reputational risk adequately. The faith of its investors and customers
has lost which is causing decline in the share price of the bank.
In order to restore the faith of the investors, the board of directors of the bank should
come up in front of the stakeholders and address their grievances. The bank should also think of
devising a policy to compensate to the loss of investors and customers. However, the board of
directors of ANZ has failed in doing so.
Conclusion
It could be concluded from the discussion done in this report that the analysis of capital
structure and WACC is essential for a firm. ANZ Bank’s WACC has been found to be 2.65%
with debt and equity being in the ratio of 86% and 14%. The financial performance of the bank
being analyzed by applying ratio analysis shows that the bank has shown improvements.
16
Secure Best Marks with AI Grader
Need help grading? Try our AI Grader for instant feedback on your assignments.
References
ANZ Bank. (2017). Annual report of ANZ Bank for the year 2017. Retrieved from
https://shareholder.anz.com/sites/default/files/2017_anz_annual_report.pdf
Hou, K., & Van Dijk, M. A. (2018). Resurrecting the size effect: Firm size, profitability shocks,
and expected stock returns. Charles A. Dice Center Working Paper, (2010-1).
Rodrigues, S., Torabikalaki, R., Faria, F., Cafôfo, N., Chen, X., Ivaki, A. R., ... & Morgado-Dias,
F. J. S. E. (2016). Economic feasibility analysis of small scale PV systems in different
countries. Solar Energy, 131, 81-95.
Valverde, S. C., Solas, P. J. C., & Fernández, F. R. (Eds.). (2016). Liquidity Risk, Efficiency and
New Bank Business Models. Springer.
17
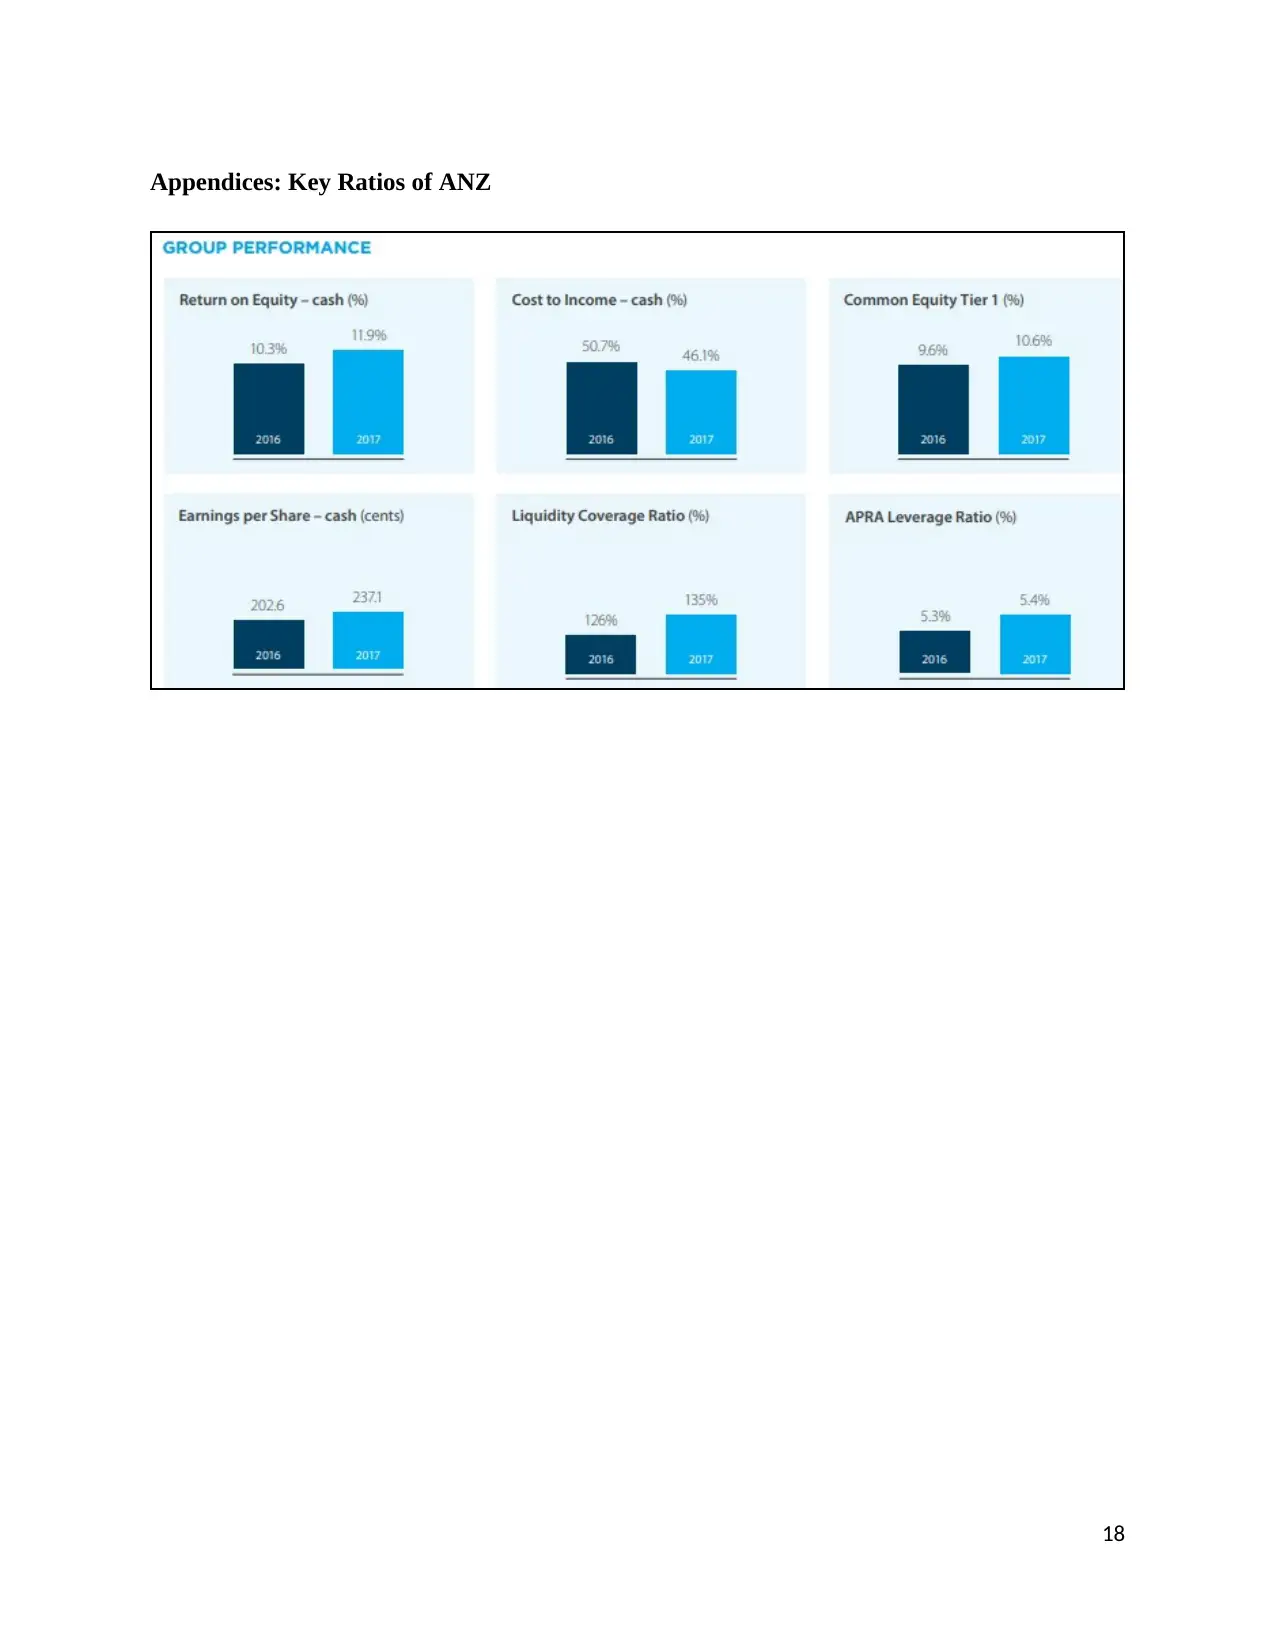
Appendices: Key Ratios of ANZ
18
18
1 out of 18

Your All-in-One AI-Powered Toolkit for Academic Success.
+13062052269
info@desklib.com
Available 24*7 on WhatsApp / Email
![[object Object]](/_next/static/media/star-bottom.7253800d.svg)
Unlock your academic potential
© 2024 | Zucol Services PVT LTD | All rights reserved.