Machine Learning and Artificial Intelligence | Data Classification
VerifiedAdded on 2022/09/02
|10
|1545
|17
AI Summary
Contribute Materials
Your contribution can guide someone’s learning journey. Share your
documents today.
Running head: DATA CLASSIFICATION
Data Classification
Student Name:
Student ID:
University Name:
Subject Code:
Data Classification
Student Name:
Student ID:
University Name:
Subject Code:
Secure Best Marks with AI Grader
Need help grading? Try our AI Grader for instant feedback on your assignments.
2ReferencesReferences
Executive Summary
With the recent advancement of technology machine learning and Artificial intelligence are
ruling in the industries due to its variety of use. Basically machine learning is an application or it
can also be said that it is a subpart of AI which gives the computer a brain through which the
machine can take decisions without any human interaction. In this report a thorough analysis will
be made on the dataset provided. The dataset used in the analysis contains information regarding
the dataset where for each function contains the static code metrics which generally consist a
software system. Basically supervised machine learning algorithm will be implement over the
dataset to examine how well the classification is going to perform. With analysis visualization
will be done over the data to get better understanding of the data. At the end few conclusion
about the whole experiment will be conducted accordingly.
3ReferencesReferences
Table of Contents
Executive Summary.........................................................................................................................2
Introduction......................................................................................................................................4
Discussion........................................................................................................................................4
Task 1...........................................................................................................................................4
Task 2...........................................................................................................................................5
Task 3...........................................................................................................................................8
Task 4...........................................................................................................................................8
Conclusion.......................................................................................................................................9
References......................................................................................................................................10
4ReferencesReferences
Introduction
With the recent advancement of technology machine learning and Artificial intelligence
are ruling in the industries due to its variety of use. Basically machine learning is an application
or it can also be said that it is a subpart of AI which gives the computer a brain through which
the machine can take decisions without any human interaction (Alpaydin, 2020). Machine
learning model are basically used for prediction purposes and for forecasting. Machine learning
models are mainly classified as supervised learning model and un-supervised learning model
(Kotsiantis, Zaharakis & Pintelas, 2007). In this analysis Naïve Bayes Classification model will
be used which is a supervised learning model (Osisanwo et al., 2017).
The dataset used in this analysis consist of two labelled dataset, mainly training dataset
and testing dataset in the form of csv files. The target columns consist of two classes where “-1”
means the software is non-defective and “1” means the software is defective.
Discussion
Task 1
a) For importing files to console a special library is there namely numpy in which a function
read_csv is used to load and save the dataset into a dataframe.
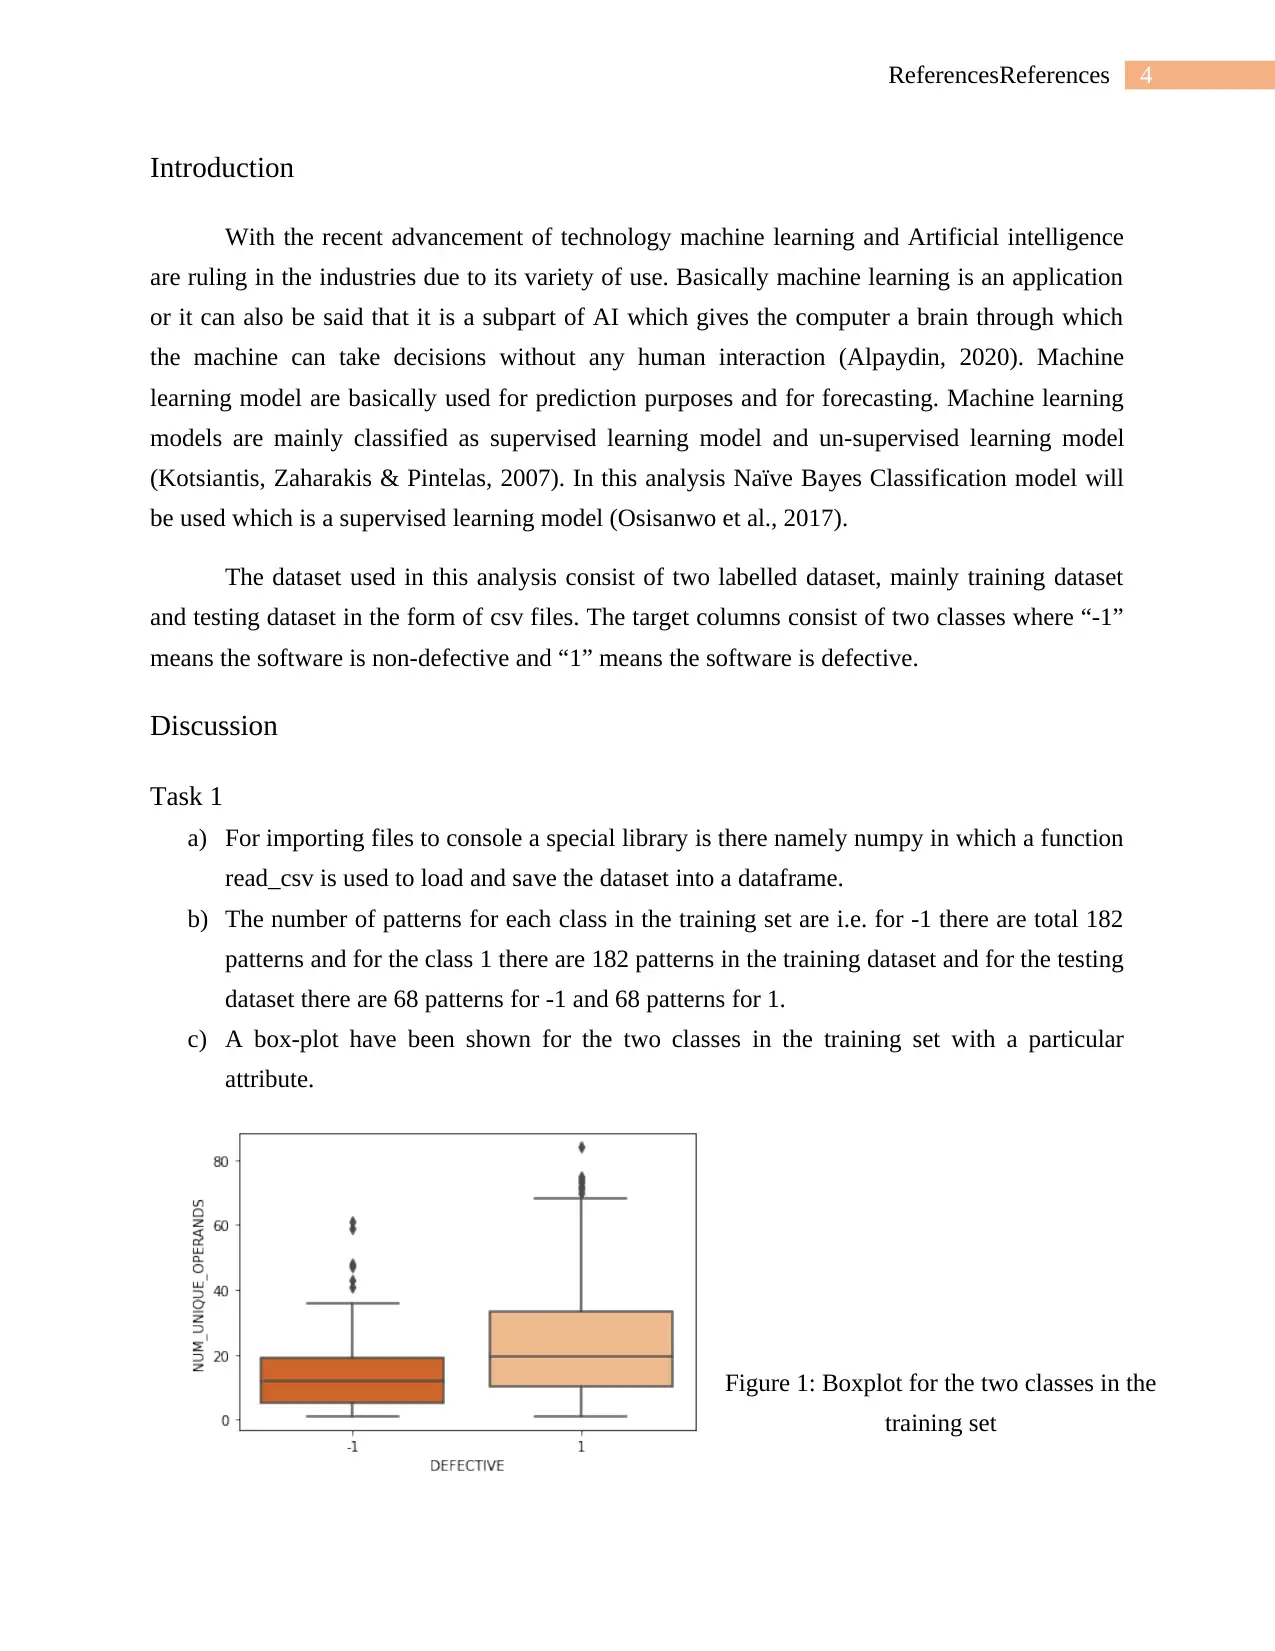
b) The number of patterns for each class in the training set are i.e. for -1 there are total 182
patterns and for the class 1 there are 182 patterns in the training dataset and for the testing
dataset there are 68 patterns for -1 and 68 patterns for 1.
c) A box-plot have been shown for the two classes in the training set with a particular
attribute.
Figure 1: Boxplot for the two classes in the
training set
Introduction
With the recent advancement of technology machine learning and Artificial intelligence
are ruling in the industries due to its variety of use. Basically machine learning is an application
or it can also be said that it is a subpart of AI which gives the computer a brain through which
the machine can take decisions without any human interaction (Alpaydin, 2020). Machine
learning model are basically used for prediction purposes and for forecasting. Machine learning
models are mainly classified as supervised learning model and un-supervised learning model
(Kotsiantis, Zaharakis & Pintelas, 2007). In this analysis Naïve Bayes Classification model will
be used which is a supervised learning model (Osisanwo et al., 2017).
The dataset used in this analysis consist of two labelled dataset, mainly training dataset
and testing dataset in the form of csv files. The target columns consist of two classes where “-1”
means the software is non-defective and “1” means the software is defective.
Discussion
Task 1
a) For importing files to console a special library is there namely numpy in which a function
read_csv is used to load and save the dataset into a dataframe.
b) The number of patterns for each class in the training set are i.e. for -1 there are total 182
patterns and for the class 1 there are 182 patterns in the training dataset and for the testing
dataset there are 68 patterns for -1 and 68 patterns for 1.
c) A box-plot have been shown for the two classes in the training set with a particular
attribute.
Figure 1: Boxplot for the two classes in the
training set
Secure Best Marks with AI Grader
Need help grading? Try our AI Grader for instant feedback on your assignments.
5ReferencesReferences
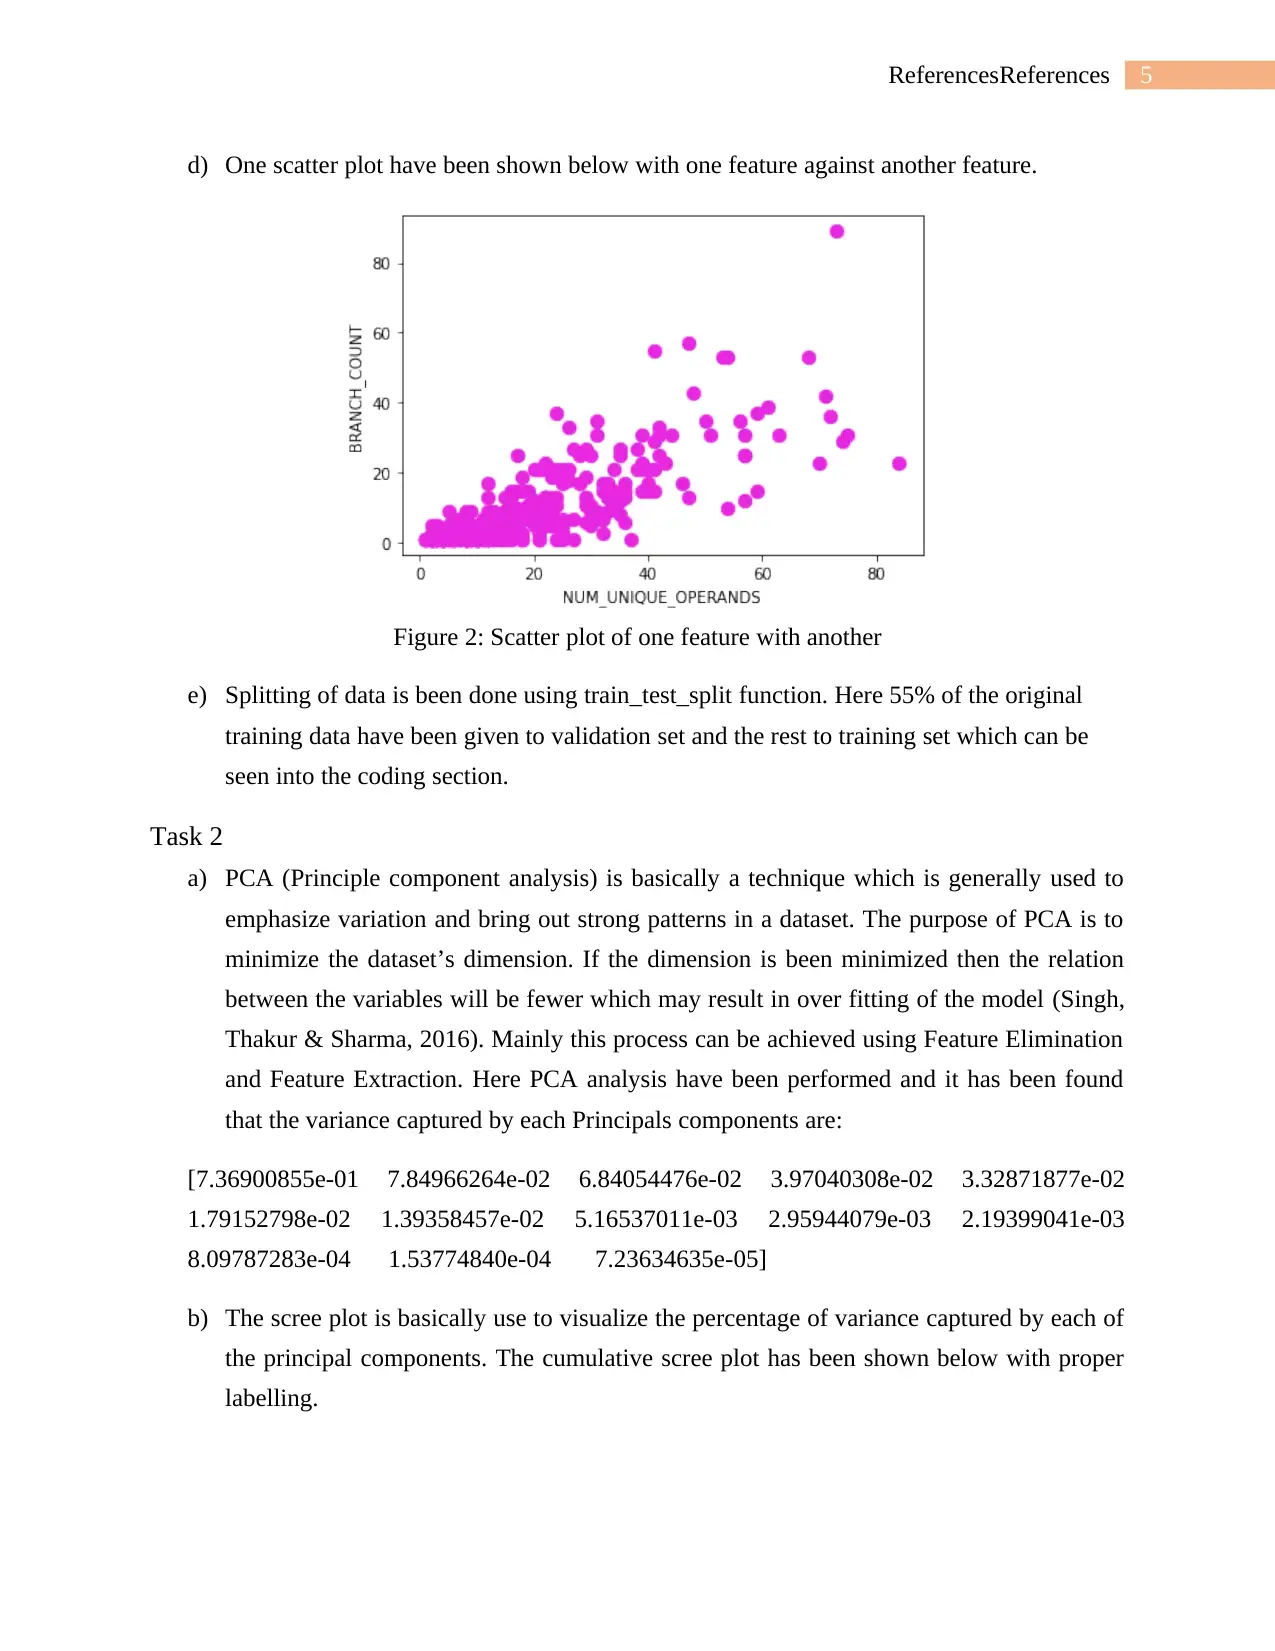
d) One scatter plot have been shown below with one feature against another feature.
Figure 2: Scatter plot of one feature with another
e) Splitting of data is been done using train_test_split function. Here 55% of the original
training data have been given to validation set and the rest to training set which can be
seen into the coding section.
Task 2
a) PCA (Principle component analysis) is basically a technique which is generally used to
emphasize variation and bring out strong patterns in a dataset. The purpose of PCA is to
minimize the dataset’s dimension. If the dimension is been minimized then the relation
between the variables will be fewer which may result in over fitting of the model (Singh,
Thakur & Sharma, 2016). Mainly this process can be achieved using Feature Elimination
and Feature Extraction. Here PCA analysis have been performed and it has been found
that the variance captured by each Principals components are:
[7.36900855e-01 7.84966264e-02 6.84054476e-02 3.97040308e-02 3.32871877e-02
1.79152798e-02 1.39358457e-02 5.16537011e-03 2.95944079e-03 2.19399041e-03
8.09787283e-04 1.53774840e-04 7.23634635e-05]
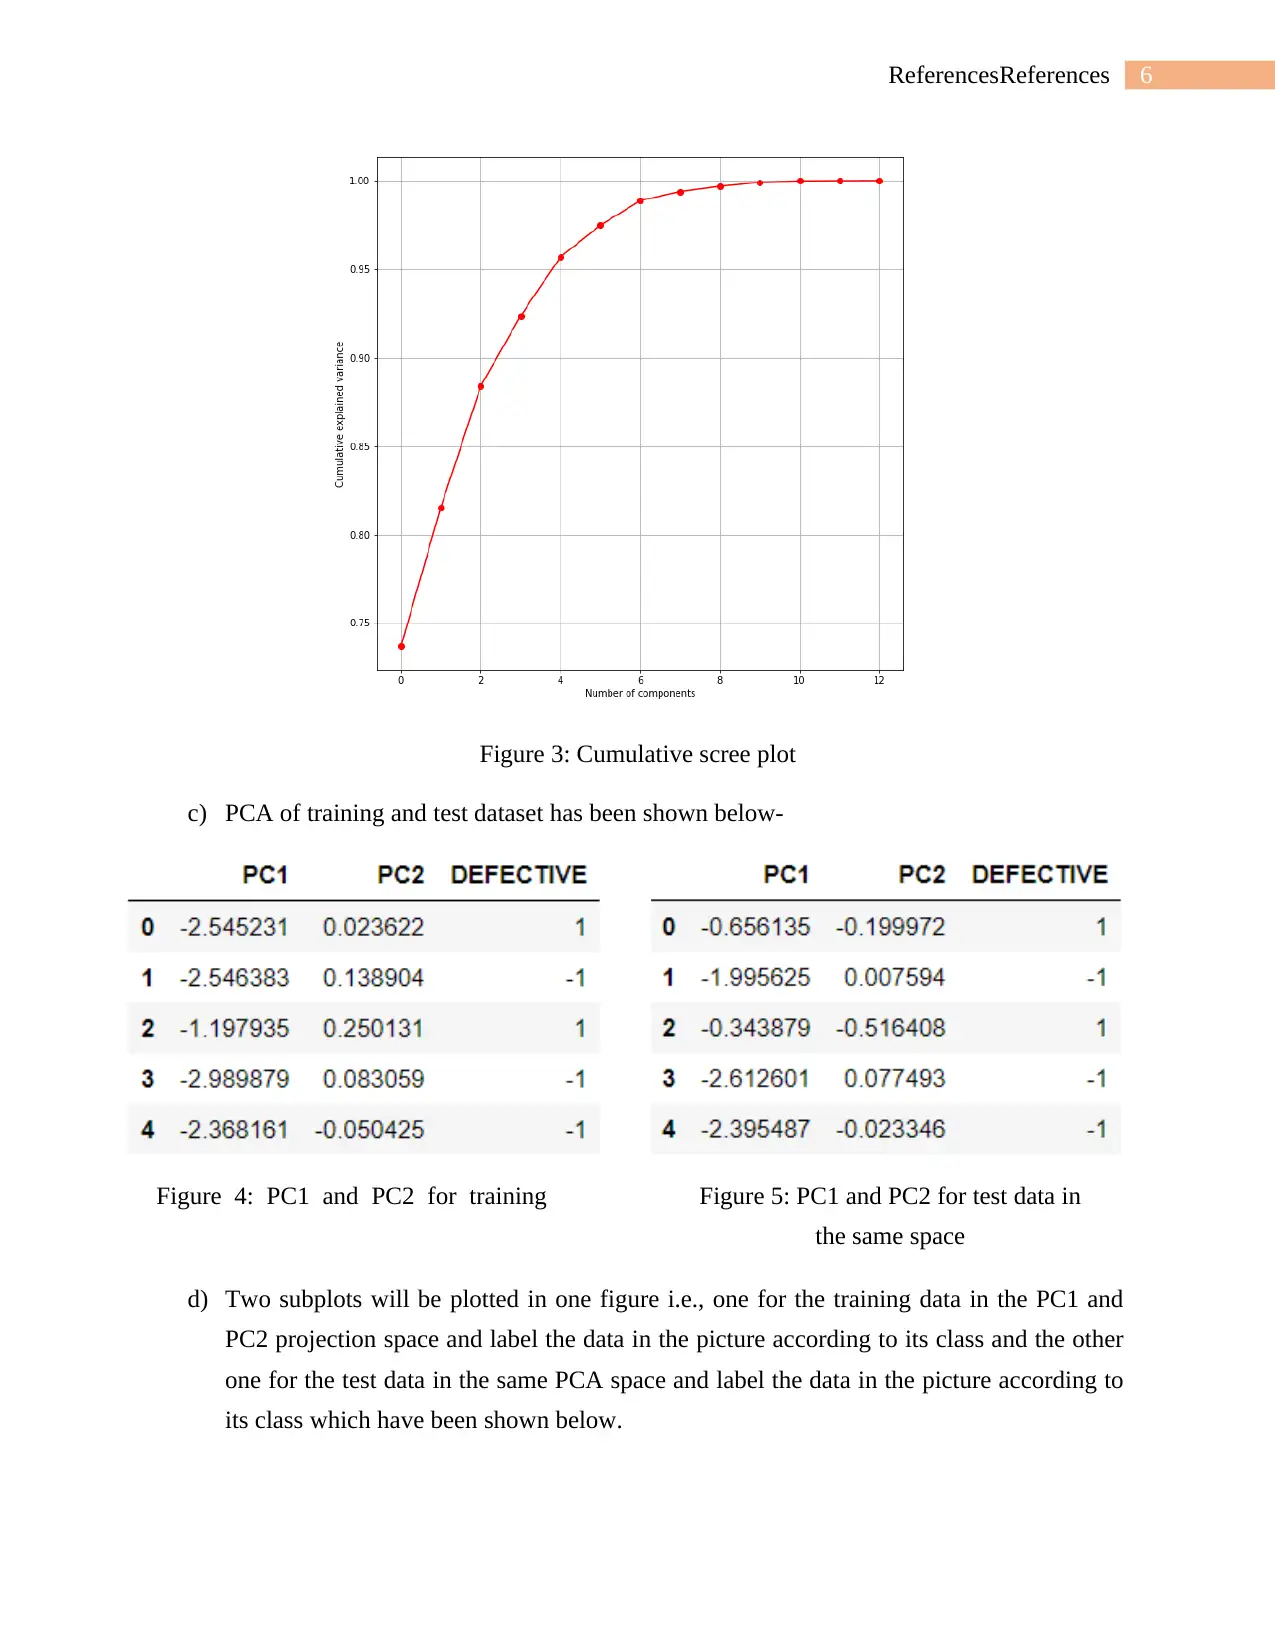
b) The scree plot is basically use to visualize the percentage of variance captured by each of
the principal components. The cumulative scree plot has been shown below with proper
labelling.
d) One scatter plot have been shown below with one feature against another feature.
Figure 2: Scatter plot of one feature with another
e) Splitting of data is been done using train_test_split function. Here 55% of the original
training data have been given to validation set and the rest to training set which can be
seen into the coding section.
Task 2
a) PCA (Principle component analysis) is basically a technique which is generally used to
emphasize variation and bring out strong patterns in a dataset. The purpose of PCA is to
minimize the dataset’s dimension. If the dimension is been minimized then the relation
between the variables will be fewer which may result in over fitting of the model (Singh,
Thakur & Sharma, 2016). Mainly this process can be achieved using Feature Elimination
and Feature Extraction. Here PCA analysis have been performed and it has been found
that the variance captured by each Principals components are:
[7.36900855e-01 7.84966264e-02 6.84054476e-02 3.97040308e-02 3.32871877e-02
1.79152798e-02 1.39358457e-02 5.16537011e-03 2.95944079e-03 2.19399041e-03
8.09787283e-04 1.53774840e-04 7.23634635e-05]
b) The scree plot is basically use to visualize the percentage of variance captured by each of
the principal components. The cumulative scree plot has been shown below with proper
labelling.
6ReferencesReferences
Figure 3: Cumulative scree plot
c) PCA of training and test dataset has been shown below-
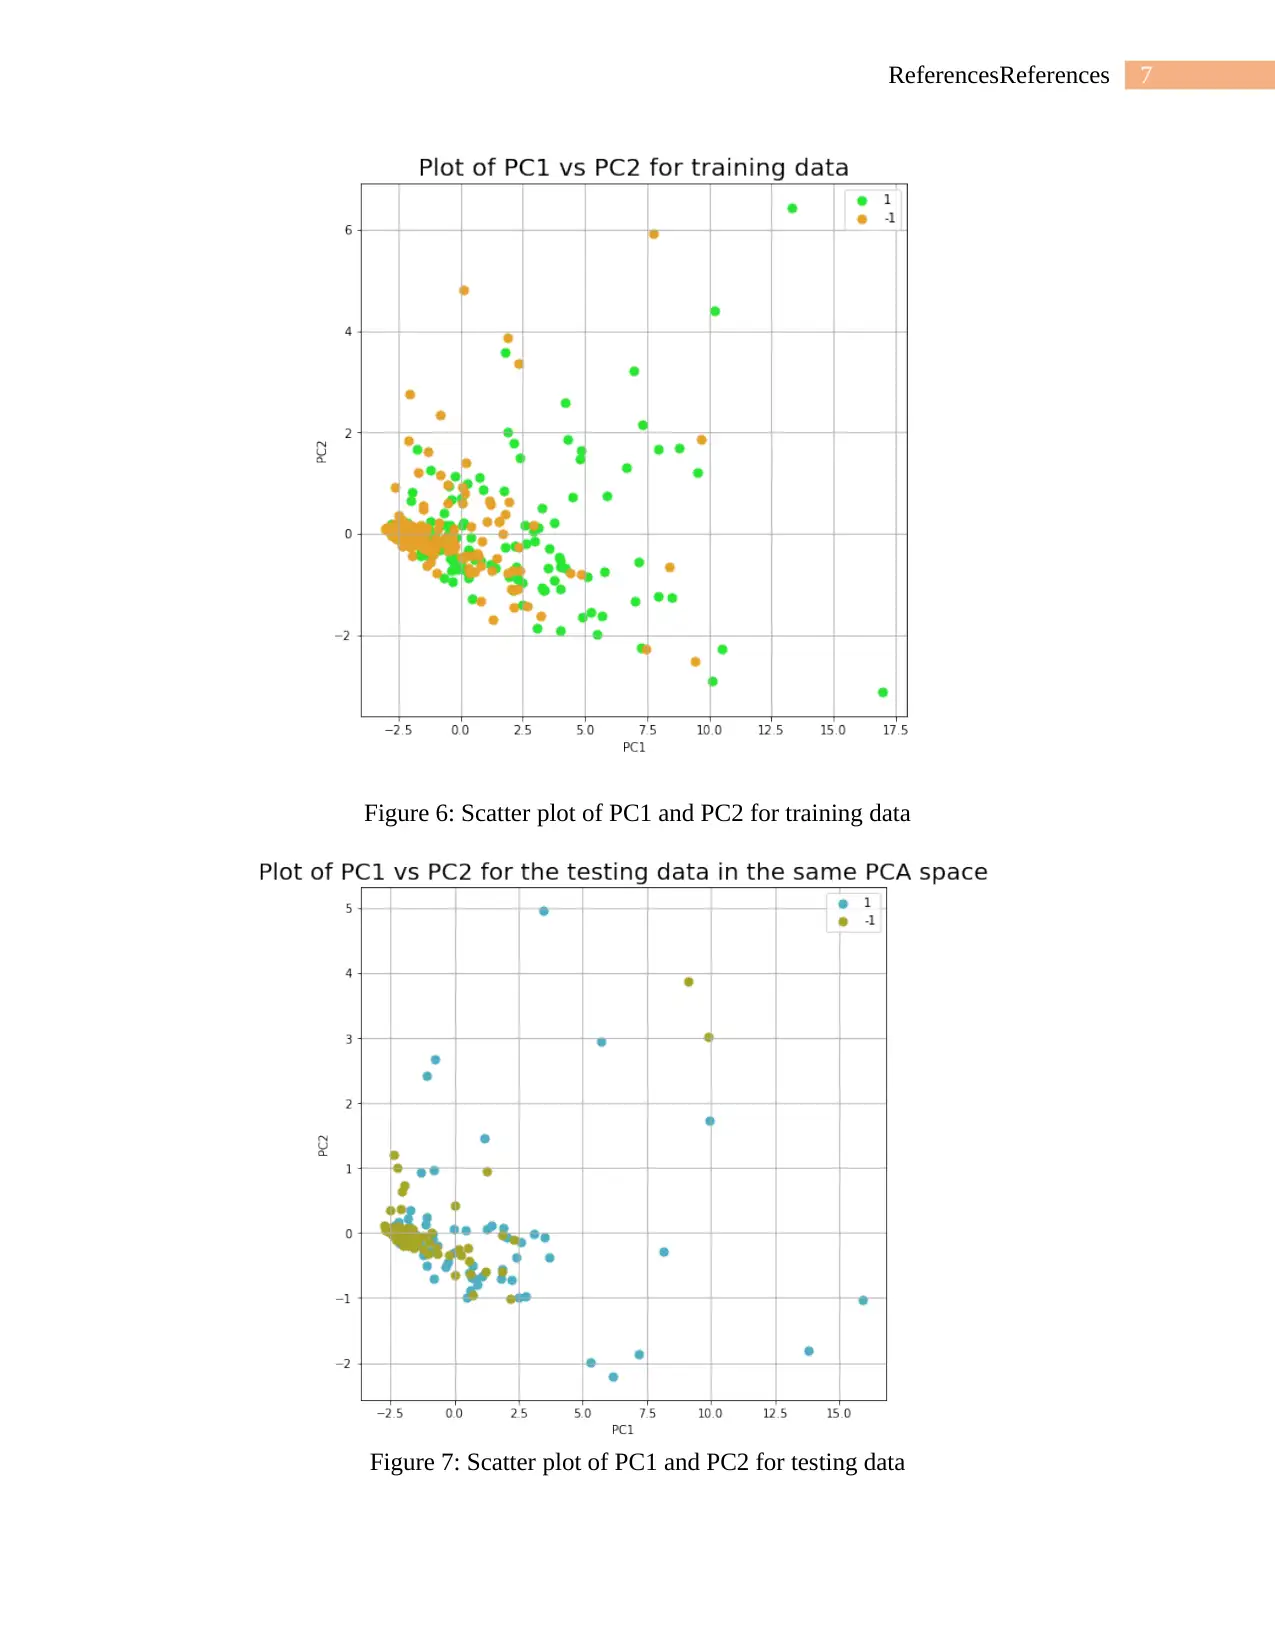
d) Two subplots will be plotted in one figure i.e., one for the training data in the PC1 and
PC2 projection space and label the data in the picture according to its class and the other
one for the test data in the same PCA space and label the data in the picture according to
its class which have been shown below.
Figure 4: PC1 and PC2 for training
data
Figure 5: PC1 and PC2 for test data in
the same space
Figure 3: Cumulative scree plot
c) PCA of training and test dataset has been shown below-
d) Two subplots will be plotted in one figure i.e., one for the training data in the PC1 and
PC2 projection space and label the data in the picture according to its class and the other
one for the test data in the same PCA space and label the data in the picture according to
its class which have been shown below.
Figure 4: PC1 and PC2 for training
data
Figure 5: PC1 and PC2 for test data in
the same space
7ReferencesReferences
Figure 6: Scatter plot of PC1 and PC2 for training data
Figure 7: Scatter plot of PC1 and PC2 for testing data
Figure 6: Scatter plot of PC1 and PC2 for training data
Figure 7: Scatter plot of PC1 and PC2 for testing data
Paraphrase This Document
Need a fresh take? Get an instant paraphrase of this document with our AI Paraphraser
8ReferencesReferences
Task 3
Naïve Bayes Classification is termed to be as a predictive algorithm model where
prediction is been done to the target column and is also fall under supervised learning algorithm
where the data are labelled and the input and output of the model are known (Ren et al., 2009).
Basically Naïve Bayes Classification is a mixture of different other classification algorithm
which are totally based on Bayes’ Theorem. In the analysis GaussianNB function have been
imported to feed the data into the model (McCallum & Nigam, 1998).
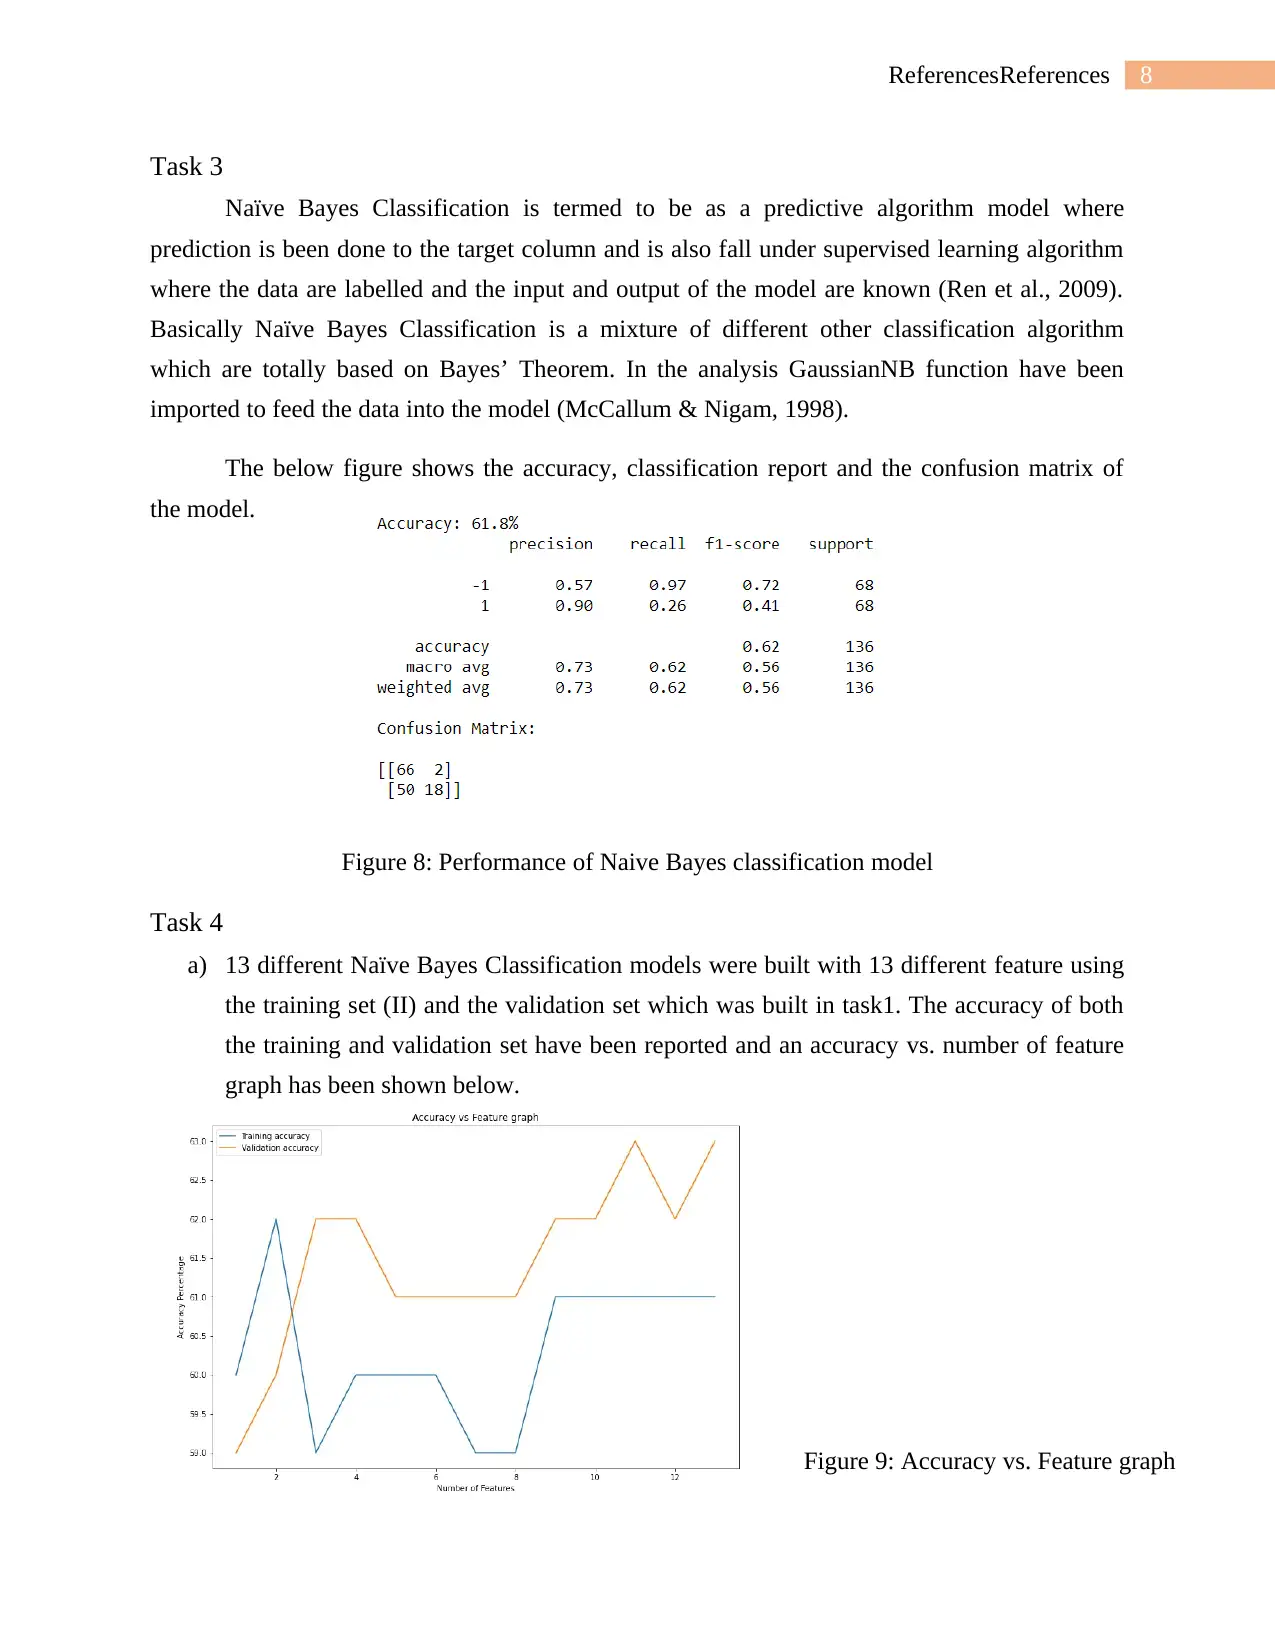
The below figure shows the accuracy, classification report and the confusion matrix of
the model.
Figure 8: Performance of Naive Bayes classification model
Task 4
a) 13 different Naïve Bayes Classification models were built with 13 different feature using
the training set (II) and the validation set which was built in task1. The accuracy of both
the training and validation set have been reported and an accuracy vs. number of feature
graph has been shown below.
Figure 9: Accuracy vs. Feature graph
Task 3
Naïve Bayes Classification is termed to be as a predictive algorithm model where
prediction is been done to the target column and is also fall under supervised learning algorithm
where the data are labelled and the input and output of the model are known (Ren et al., 2009).
Basically Naïve Bayes Classification is a mixture of different other classification algorithm
which are totally based on Bayes’ Theorem. In the analysis GaussianNB function have been
imported to feed the data into the model (McCallum & Nigam, 1998).
The below figure shows the accuracy, classification report and the confusion matrix of
the model.
Figure 8: Performance of Naive Bayes classification model
Task 4
a) 13 different Naïve Bayes Classification models were built with 13 different feature using
the training set (II) and the validation set which was built in task1. The accuracy of both
the training and validation set have been reported and an accuracy vs. number of feature
graph has been shown below.
Figure 9: Accuracy vs. Feature graph
9ReferencesReferences
b) In respect to the graph the best accuracy with the best feature was observed to be 11 and
13. Thus in further analysis 13 features will be taken into consideration.
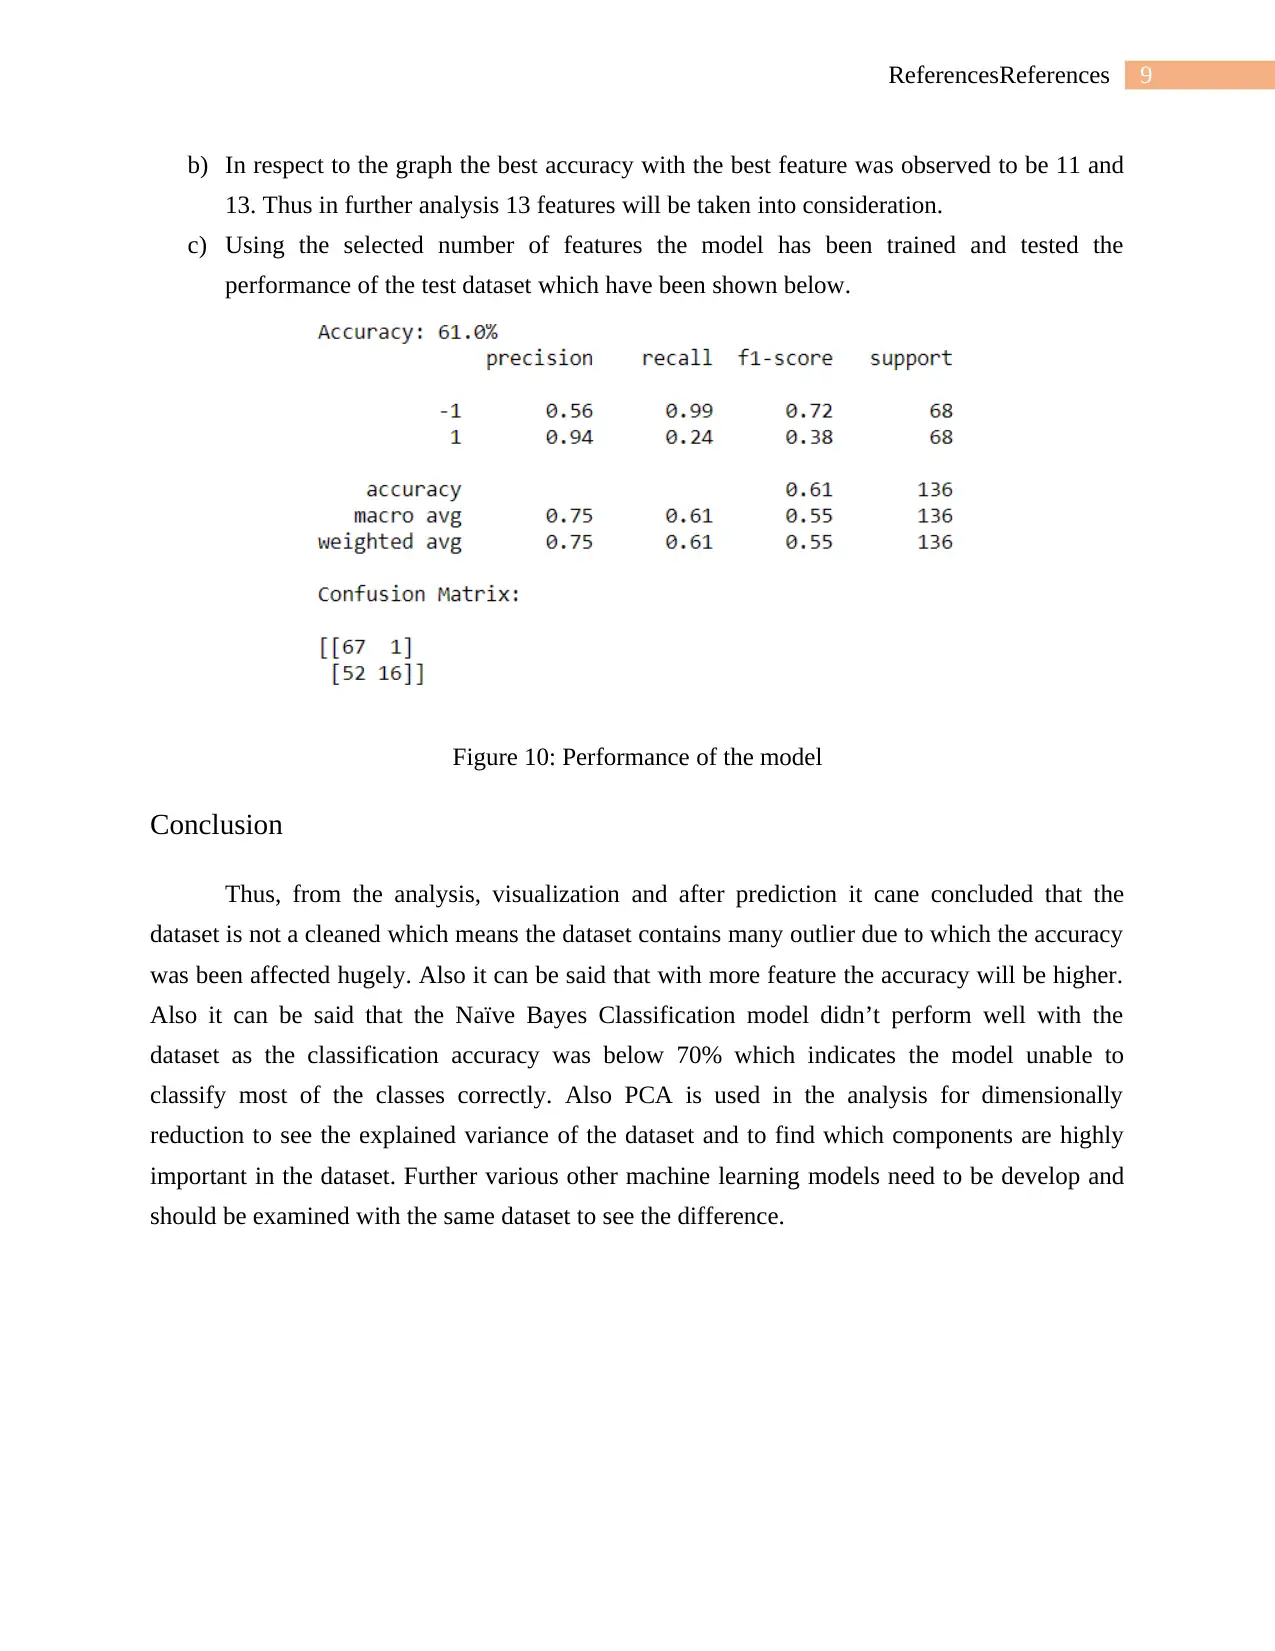
c) Using the selected number of features the model has been trained and tested the
performance of the test dataset which have been shown below.
Figure 10: Performance of the model
Conclusion
Thus, from the analysis, visualization and after prediction it cane concluded that the
dataset is not a cleaned which means the dataset contains many outlier due to which the accuracy
was been affected hugely. Also it can be said that with more feature the accuracy will be higher.
Also it can be said that the Naïve Bayes Classification model didn’t perform well with the
dataset as the classification accuracy was below 70% which indicates the model unable to
classify most of the classes correctly. Also PCA is used in the analysis for dimensionally
reduction to see the explained variance of the dataset and to find which components are highly
important in the dataset. Further various other machine learning models need to be develop and
should be examined with the same dataset to see the difference.
b) In respect to the graph the best accuracy with the best feature was observed to be 11 and
13. Thus in further analysis 13 features will be taken into consideration.
c) Using the selected number of features the model has been trained and tested the
performance of the test dataset which have been shown below.
Figure 10: Performance of the model
Conclusion
Thus, from the analysis, visualization and after prediction it cane concluded that the
dataset is not a cleaned which means the dataset contains many outlier due to which the accuracy
was been affected hugely. Also it can be said that with more feature the accuracy will be higher.
Also it can be said that the Naïve Bayes Classification model didn’t perform well with the
dataset as the classification accuracy was below 70% which indicates the model unable to
classify most of the classes correctly. Also PCA is used in the analysis for dimensionally
reduction to see the explained variance of the dataset and to find which components are highly
important in the dataset. Further various other machine learning models need to be develop and
should be examined with the same dataset to see the difference.
10ReferencesReferences
References
Alpaydin, E. (2020). Introduction to machine learning. MIT press.
Kotsiantis, S. B., Zaharakis, I., & Pintelas, P. (2007). Supervised machine learning: A review of
classification techniques. Emerging artificial intelligence applications in computer
engineering, 160, 3-24.
Osisanwo, F. Y., Akinsola, J. E. T., Awodele, O., Hinmikaiye, J. O., Olakanmi, O., & Akinjobi,
J. (2017). Supervised machine learning algorithms: classification and comparison.
International Journal of Computer Trends and Technology (IJCTT), 48(3), 128-138.
Ren, J., Lee, S. D., Chen, X., Kao, B., Cheng, R., & Cheung, D. (2009, December). Naive bayes
classification of uncertain data. In 2009 Ninth IEEE International Conference on Data
Mining (pp. 944-949). IEEE.
McCallum, A., & Nigam, K. (1998, July). A comparison of event models for naive bayes text
classification. In AAAI-98 workshop on learning for text categorization (Vol. 752, No. 1,
pp. 41-48).
Singh, A., Thakur, N., & Sharma, A. (2016, March). A review of supervised machine learning
algorithms. In 2016 3rd International Conference on Computing for Sustainable Global
Development (INDIACom) (pp. 1310-1315). Ieee.
1 out of 10
Related Documents


Your All-in-One AI-Powered Toolkit for Academic Success.
+13062052269
info@desklib.com
Available 24*7 on WhatsApp / Email
![[object Object]](/_next/static/media/star-bottom.7253800d.svg)
Unlock your academic potential
© 2024 | Zucol Services PVT LTD | All rights reserved.