Machine Learning Report: Analysis and Comparison of Health Tweets Data
VerifiedAdded on 2022/10/14
|25
|4450
|14
Report
AI Summary
This report presents a machine learning analysis of health-related tweets, sourced from the UCI Machine Learning Repository. The study focuses on data preprocessing, including cleaning and transformation of the dataset into a suitable format for the WEKA data mining tool. The report explores data mining techniques, specifically focusing on classification algorithms. Two classification models, Decision Trees and Naive Bayes, are chosen and compared to assess their performance in classifying health-related information. The analysis includes a detailed examination of the dataset's attributes, statistical descriptions, and visualization of data characteristics. The report also discusses the advantages and disadvantages of the chosen classification algorithms, providing insights into their suitability for the analysis. The evaluation section compares the two models, highlighting their strengths and weaknesses in the context of health tweet data analysis. The overall aim is to demonstrate the application of machine learning, particularly WEKA, in understanding health data and providing valuable insights.
MINING 1
MACHINE LEARNING ON HEALTH TWEETS
NAME OF AUTHOR
NAME OF PROFESSOR
NAME OF CLASS
NAME OF SCHOOL
STATE AND CITY
DATE
MACHINE LEARNING ON HEALTH TWEETS
NAME OF AUTHOR
NAME OF PROFESSOR
NAME OF CLASS
NAME OF SCHOOL
STATE AND CITY
DATE
Paraphrase This Document
Need a fresh take? Get an instant paraphrase of this document with our AI Paraphraser
MINING 2
ABSTRACT
This is part will give a brief overview of what the whole literature body of the machine learning
report will entail. First of all, there will be an analytical focus on tweets dataset. There will be an
introductory part that gives any reader the understanding that he or she is about to read data
analytics literature. Data set will be described in thorough detail stating attributes as well as the
actual preprocessing stages and the results of the actual preprocessing of the data set. The main
data mining techniques will be elaborated in details as well. A machine learning technique is
chosen with an aim as to why it is being applied. There will be a statement if the machine
learning algorithm is a classification or a clustering algorithm. And this can only be answered if
the problem that you have developed by the dataset is a classification or a clustering problem.
There will be the evaluation and demonstration section in which the developed model is
compared with another and the reason for its relevance over the one that is left is also stated
clearly. The conclusion section will be the wrap-up part of the whole report.
INTRODUCTION
There was a provision of a data set that contains the medical description on what is
actually for health and what is not good for health. This is more of health advice through tweets.
This was actual tweets that were sent through different URL links. The response variable by far
over here is the description variable and this is what classification models will be built under
(Ryu and Moon, 2016). So by far, the kind of classification will be text mining classification
method. There will be two classification methods compared to one another. The comparison of
these two on the same dataset will largely aid in the evaluation and demonstration section as
there will be a point out on which one is a batter classification model than the other (Zhou, Tong,
Gu and Gall, 2016).
MINING 3
Machine learning, in the 21st century, is highly used on classification and regression
purposes and this aids in the understanding of different datasets and the trends and pattern that
they have got to display. Okay, giving an off-topic example, but which is n exactly business-
related kind of a topic is trying to check which customers exactly would churn and which ones
would not churn in the long run from telecommunication services that are being offered by a
telecommunication company (Zainudin, Shamsuddin and Hasan, 2019). In this case, the variable
of interest would be the churn variable or feature column as this is the column that contains the
actual listing on a customer's loyalty or not. In this case, when classification is run for
understanding, for example, the logistic regression which is the simplest classification algorithm
to understand the churn rate is developed, then the actual classification of those customers that
can churn and those who stay true to the company will be developed. After the classification,
there can be test using the confusion matrix, to better see which customers were classified where
and which ones were classified wrongly. This aid the business to get to know where to put
resources accordingly as it would be easier and cheaper to maintain already acquired customers
than to get new customers (Balcan, Sandholm and Vitercik, 2018.).
From the illustration, in the above paragraph, you can realize that machine learning and machine
learning classifications aid in the operations of a company hence making profits.
Machine learning though is largely used across industries and in our case, we will be focusing
on health data on information that were tweeted on what is and what is not recommended to be
followed with staying healthy. This by far then indicates that machine learning can be used in
health in different ways.
⊘ This is a preview!⊘
Do you want full access?
Subscribe today to unlock all pages.
Trusted by 1+ million students worldwide
MINING 4
Aim of the whole of this assignment is to help prove one of the many ways in which
machine learning and more specifically how WEKA analytics tool can aid understand health
data.
DATA SUMMARY AND PREPROCESSING
The data set that was to be worked on for the machine learning algorithms that will be chosen in
the next report section, was to be downloaded from the UCI machine learning repository. The
dataset was in a zip that contained up to 16 text files. All the 16 text files were the health-related
dataset and the main idea in all that is that the actual responses and opinions given over some
health route that most people take and what exactly they should avoid and what they should pick
as a health route for staying healthy (Keleş and Keleş, 2018).
The chosen dataset from the 16 sets of datasets is the foxnewshealth.txt and this had to be
transformed into a CSV file for easier upload into WEKA. Upon transformation into a CSV file,
several variables were created and this includes; ID, MONTH, DATE, DAY TIME YEAR,
DESCRIPTION and finally URL. Since these were tweets datasets, there had to be the URL
links for every tweet sent by the person tweeting. From the fact that the dataset was a health
dataset, there had to be a belief that all those who were tweeting the same must have been from
the medical field.
After the.CSV transformation, the dataset had to be loaded onto the WEKA, but in most cases,
this was not possible as there was a need to do a regular and thorough clean up to aid in the
attainment of the actual CSV file that could be loaded up to the WEKA analytics tool. The clean-
up was accompanied by the deletion of multiple rows that were coded in a non-WEKA data line
formats. After the loading of the dataset into the WEKA tool, then the transformation of the CSV
Paraphrase This Document
Need a fresh take? Get an instant paraphrase of this document with our AI Paraphraser
MINING 5
file into an ARFF file, which is the WEKA data file type. After this, the saving was done and
then now loaded afresh into WEKA (Alcala-Fdez et al. 2016).
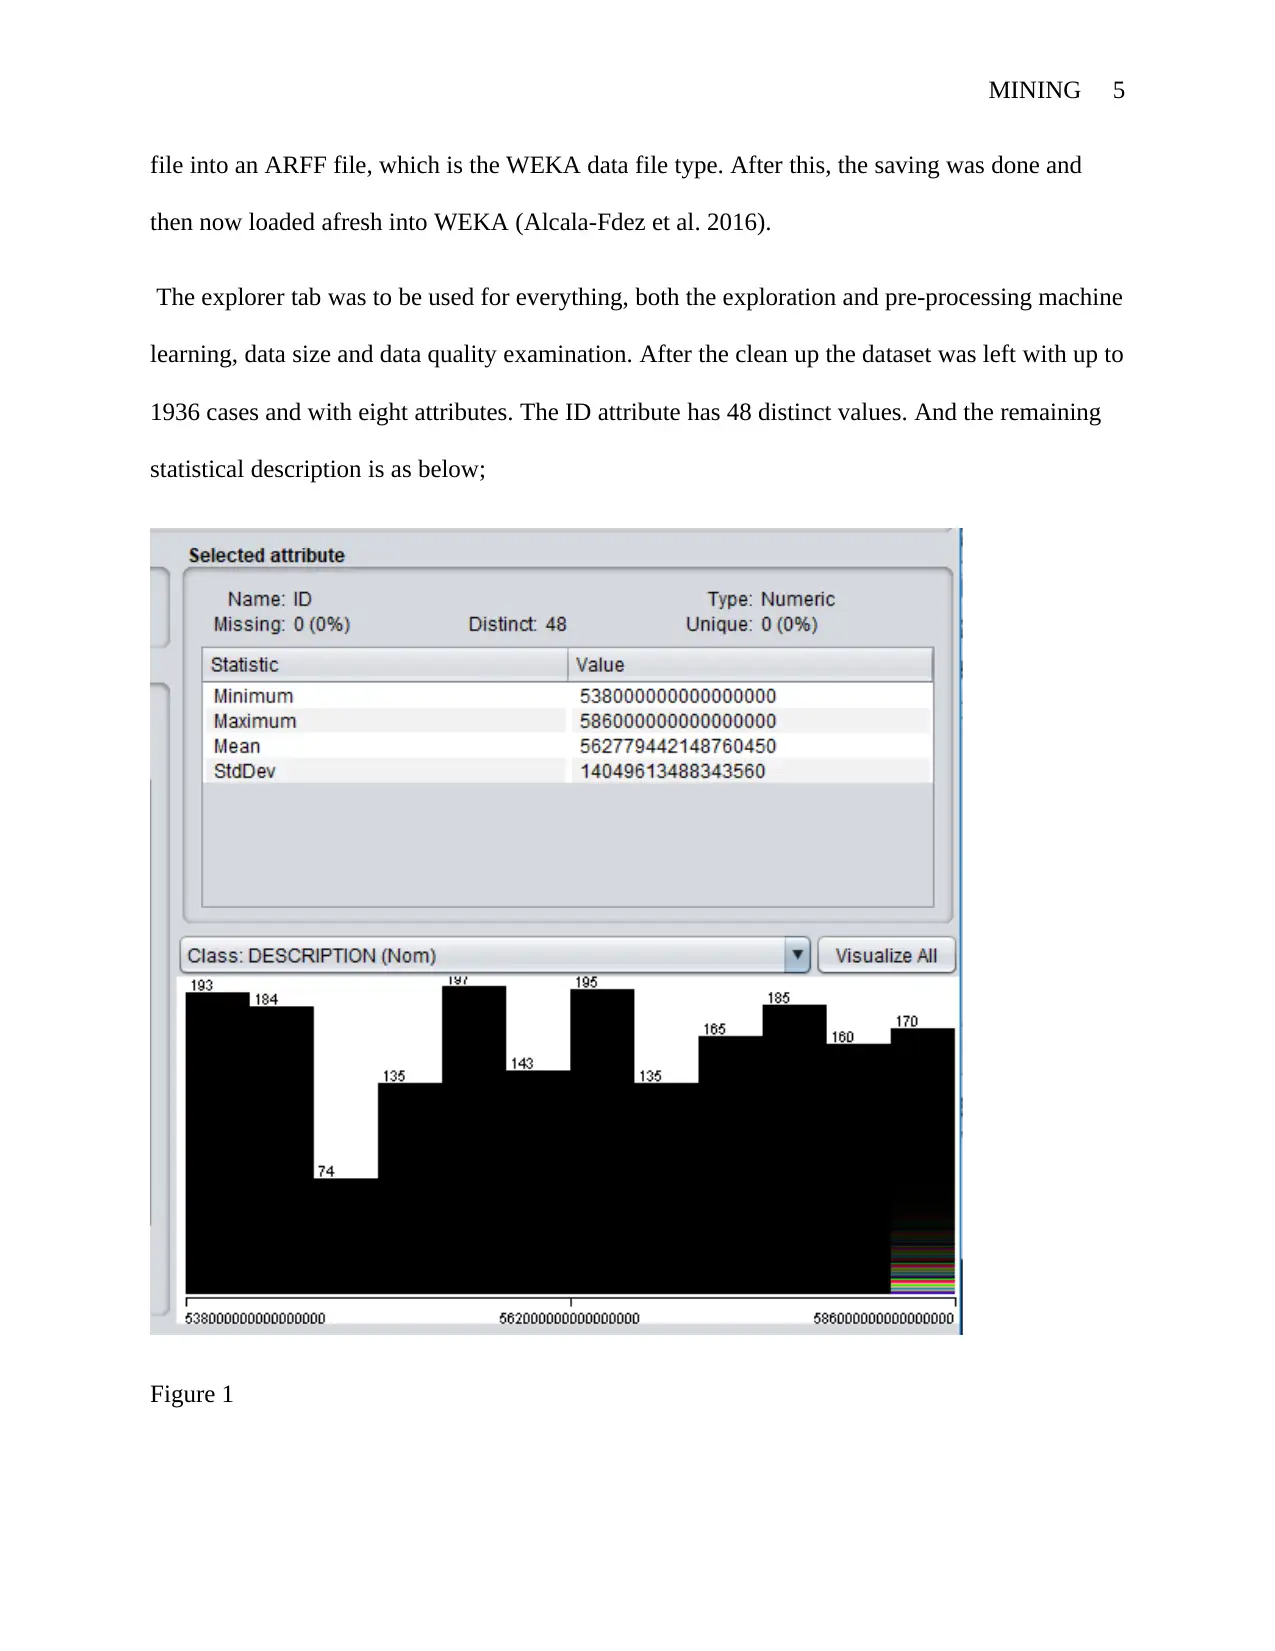
The explorer tab was to be used for everything, both the exploration and pre-processing machine
learning, data size and data quality examination. After the clean up the dataset was left with up to
1936 cases and with eight attributes. The ID attribute has 48 distinct values. And the remaining
statistical description is as below;
Figure 1
file into an ARFF file, which is the WEKA data file type. After this, the saving was done and
then now loaded afresh into WEKA (Alcala-Fdez et al. 2016).
The explorer tab was to be used for everything, both the exploration and pre-processing machine
learning, data size and data quality examination. After the clean up the dataset was left with up to
1936 cases and with eight attributes. The ID attribute has 48 distinct values. And the remaining
statistical description is as below;
Figure 1
MINING 6
From here we can see an actual listing of the mean, median, maximum and standard deviation.
There are clear histogram listings and fir different classes.
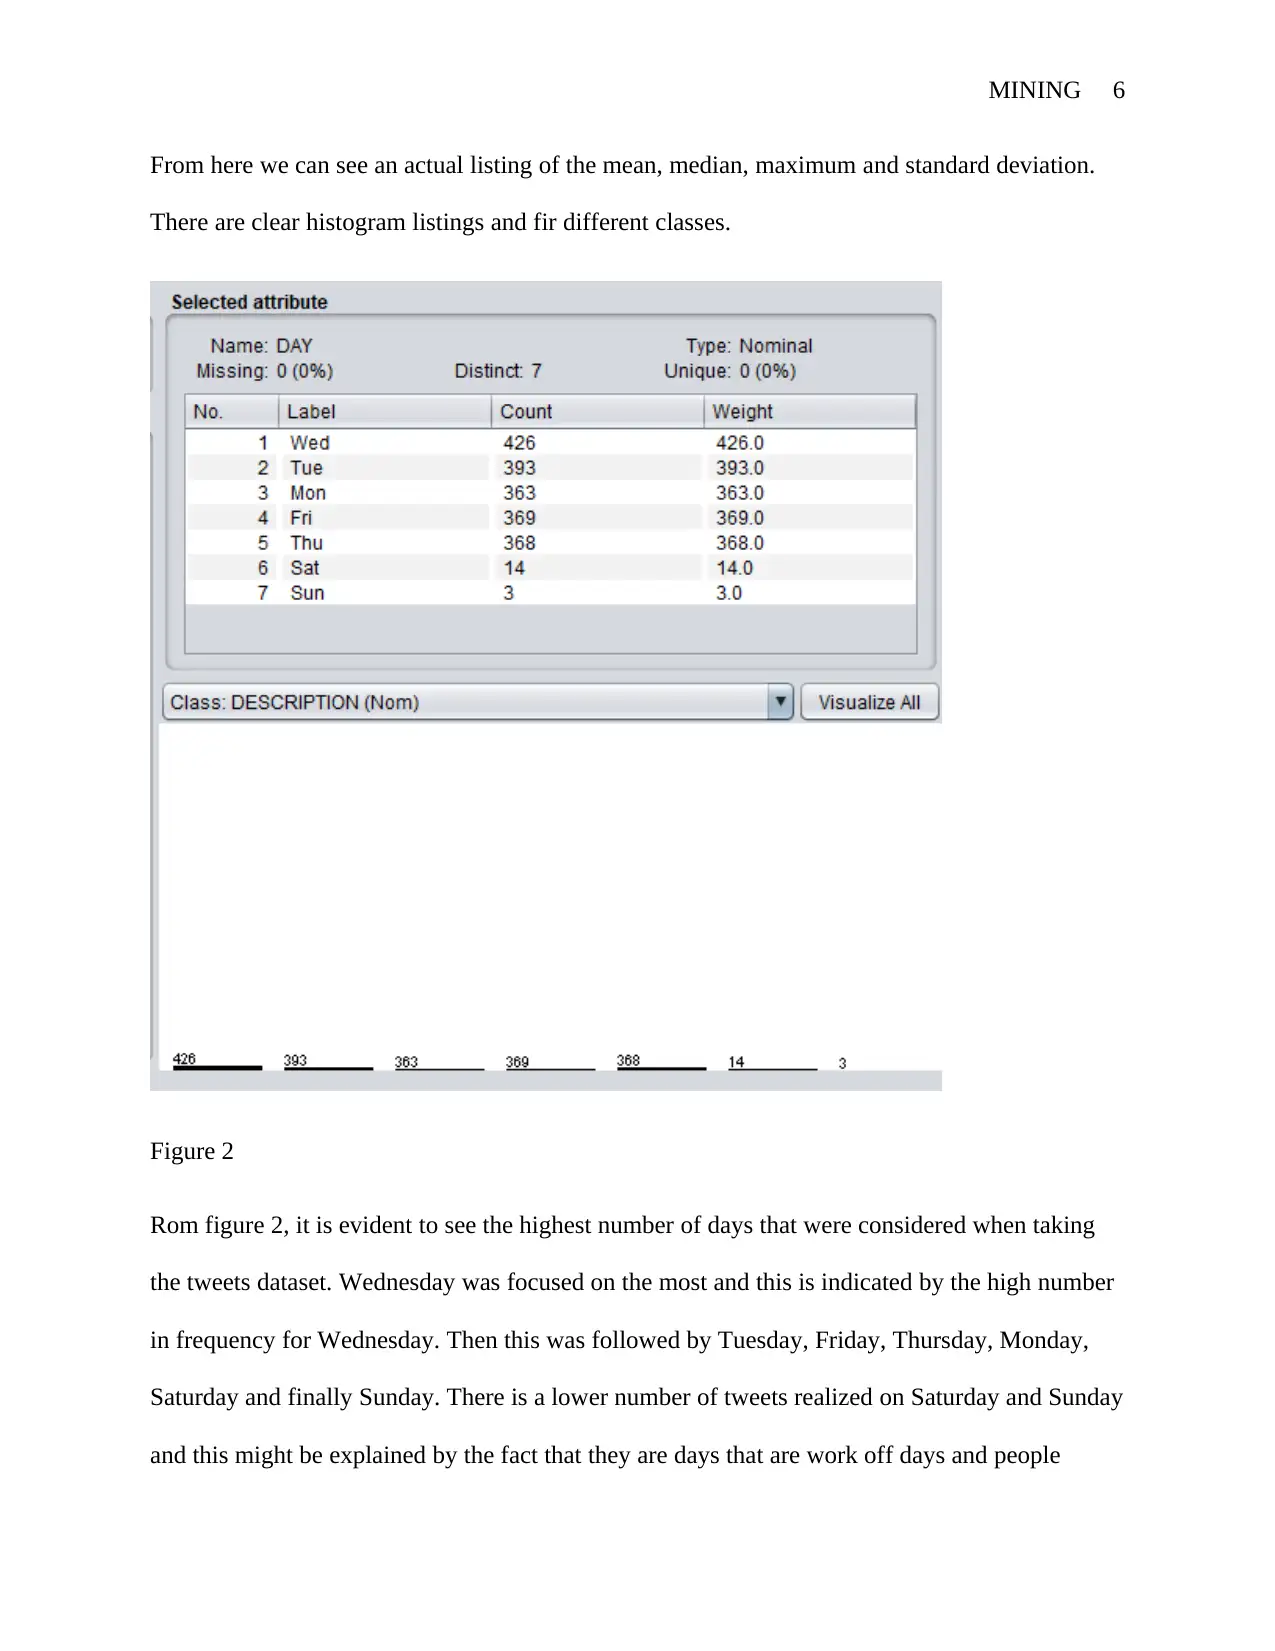
Figure 2
Rom figure 2, it is evident to see the highest number of days that were considered when taking
the tweets dataset. Wednesday was focused on the most and this is indicated by the high number
in frequency for Wednesday. Then this was followed by Tuesday, Friday, Thursday, Monday,
Saturday and finally Sunday. There is a lower number of tweets realized on Saturday and Sunday
and this might be explained by the fact that they are days that are work off days and people
From here we can see an actual listing of the mean, median, maximum and standard deviation.
There are clear histogram listings and fir different classes.
Figure 2
Rom figure 2, it is evident to see the highest number of days that were considered when taking
the tweets dataset. Wednesday was focused on the most and this is indicated by the high number
in frequency for Wednesday. Then this was followed by Tuesday, Friday, Thursday, Monday,
Saturday and finally Sunday. There is a lower number of tweets realized on Saturday and Sunday
and this might be explained by the fact that they are days that are work off days and people
⊘ This is a preview!⊘
Do you want full access?
Subscribe today to unlock all pages.
Trusted by 1+ million students worldwide
MINING 7
would not want to visit any social media platforms for this. Of the days of the week from
Monday to Friday, there is a lower number realized on Monday and this can be explained by the
fact that most people are usually sluggish on Mondays.
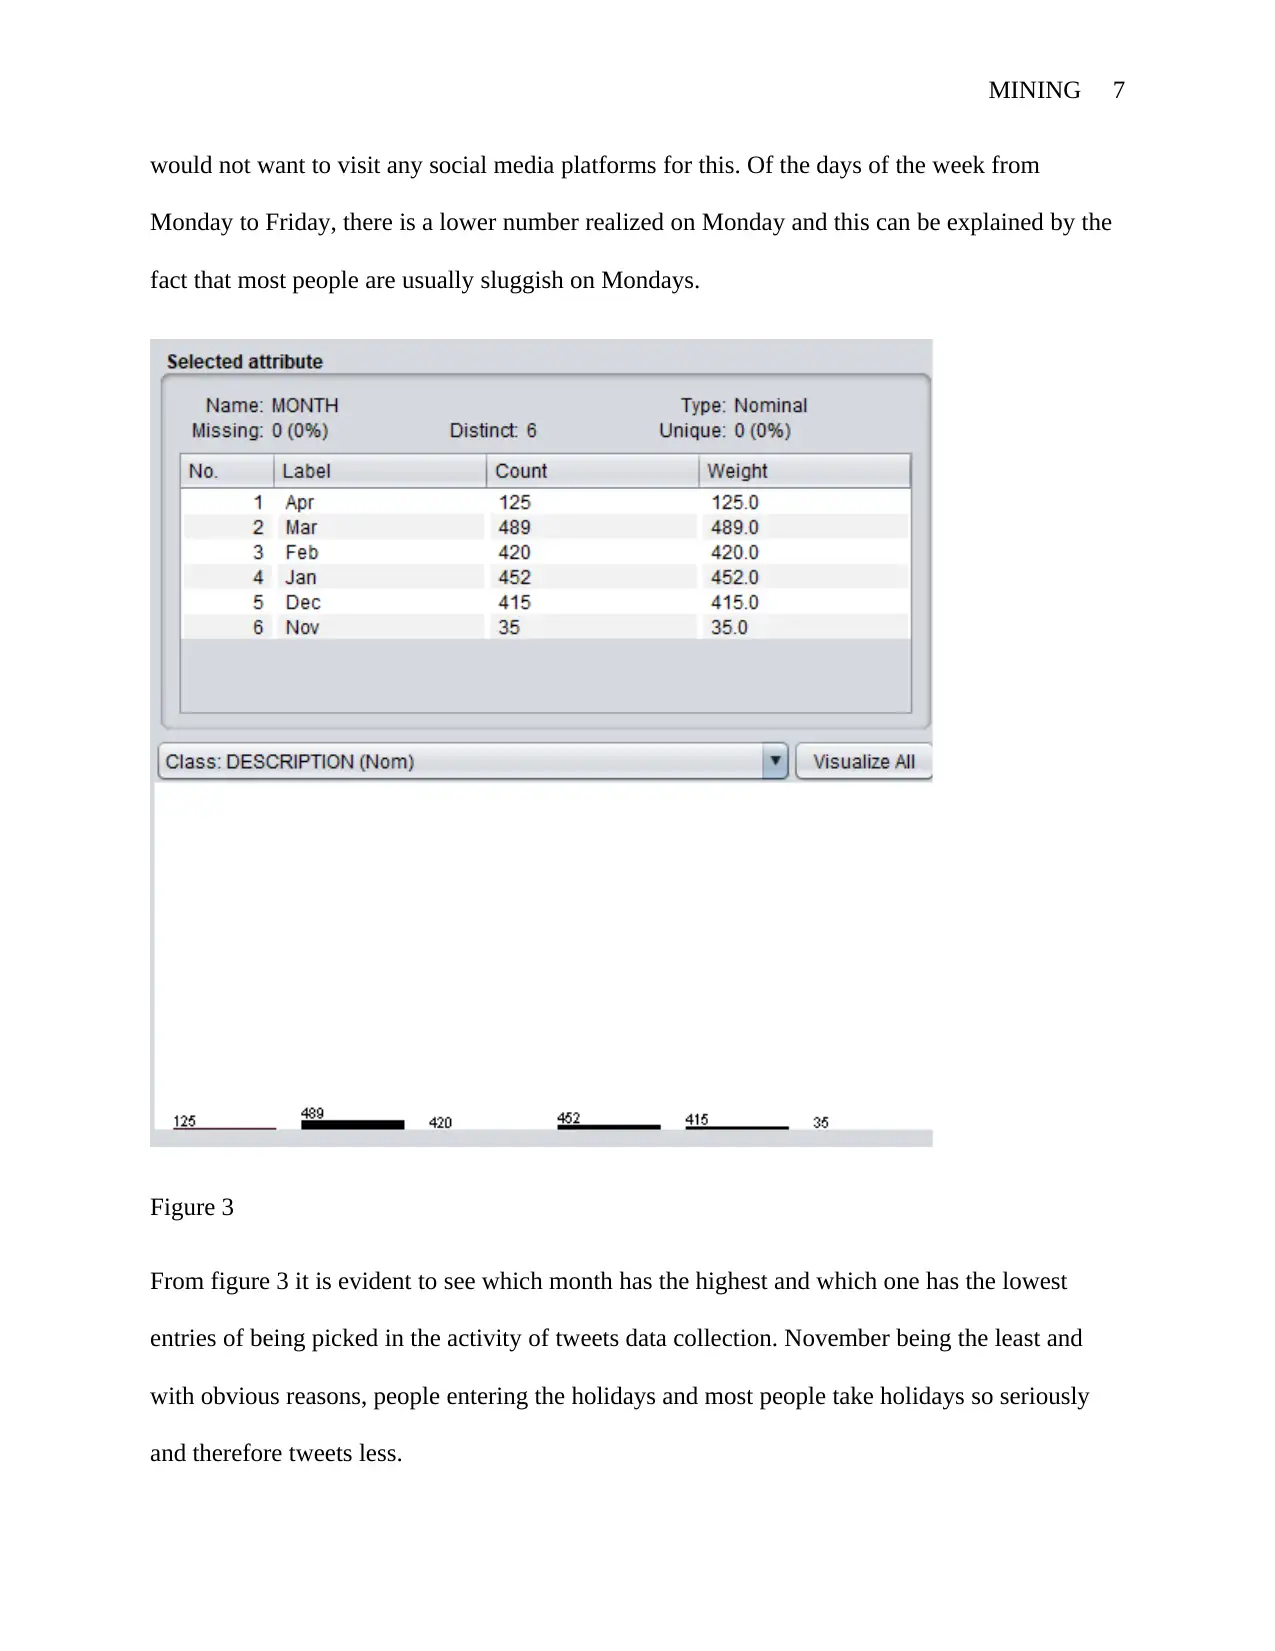
Figure 3
From figure 3 it is evident to see which month has the highest and which one has the lowest
entries of being picked in the activity of tweets data collection. November being the least and
with obvious reasons, people entering the holidays and most people take holidays so seriously
and therefore tweets less.
would not want to visit any social media platforms for this. Of the days of the week from
Monday to Friday, there is a lower number realized on Monday and this can be explained by the
fact that most people are usually sluggish on Mondays.
Figure 3
From figure 3 it is evident to see which month has the highest and which one has the lowest
entries of being picked in the activity of tweets data collection. November being the least and
with obvious reasons, people entering the holidays and most people take holidays so seriously
and therefore tweets less.
Paraphrase This Document
Need a fresh take? Get an instant paraphrase of this document with our AI Paraphraser
MINING 8
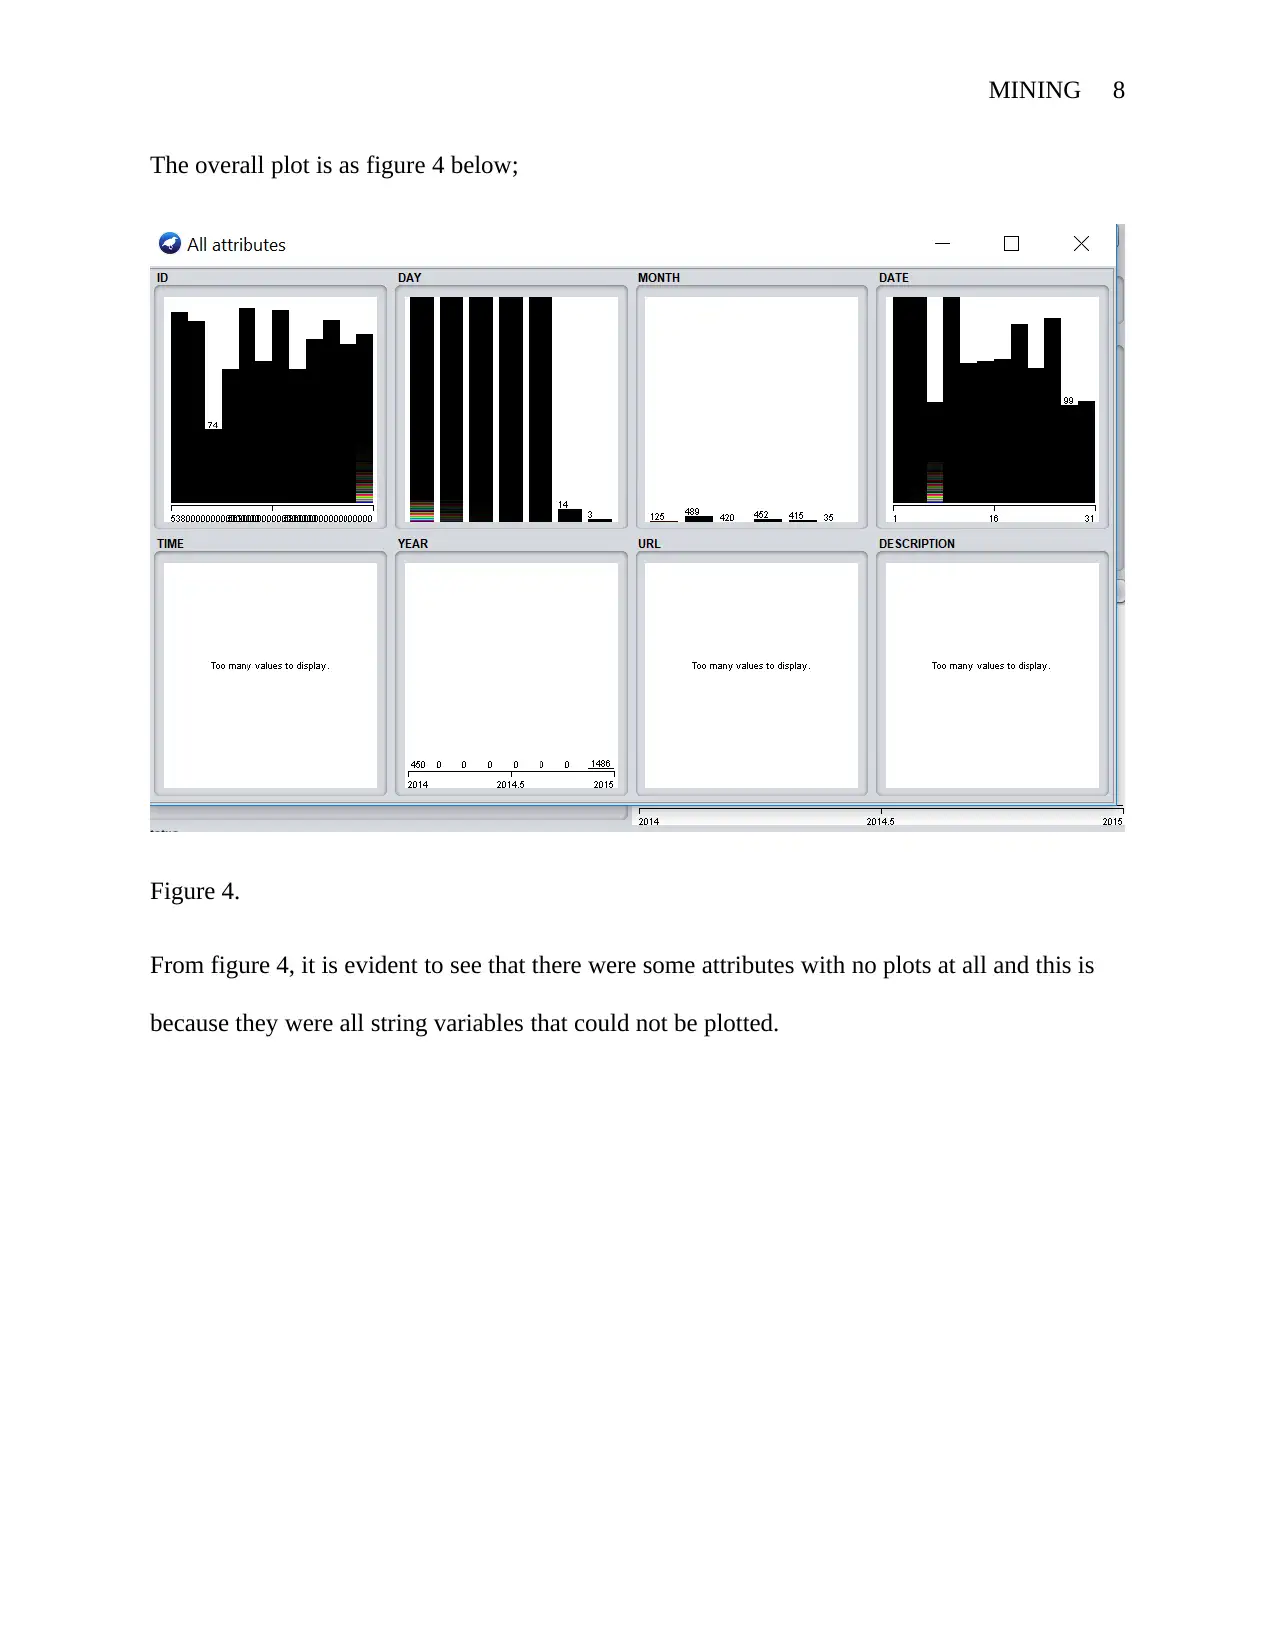
The overall plot is as figure 4 below;
Figure 4.
From figure 4, it is evident to see that there were some attributes with no plots at all and this is
because they were all string variables that could not be plotted.
The overall plot is as figure 4 below;
Figure 4.
From figure 4, it is evident to see that there were some attributes with no plots at all and this is
because they were all string variables that could not be plotted.
MINING 9
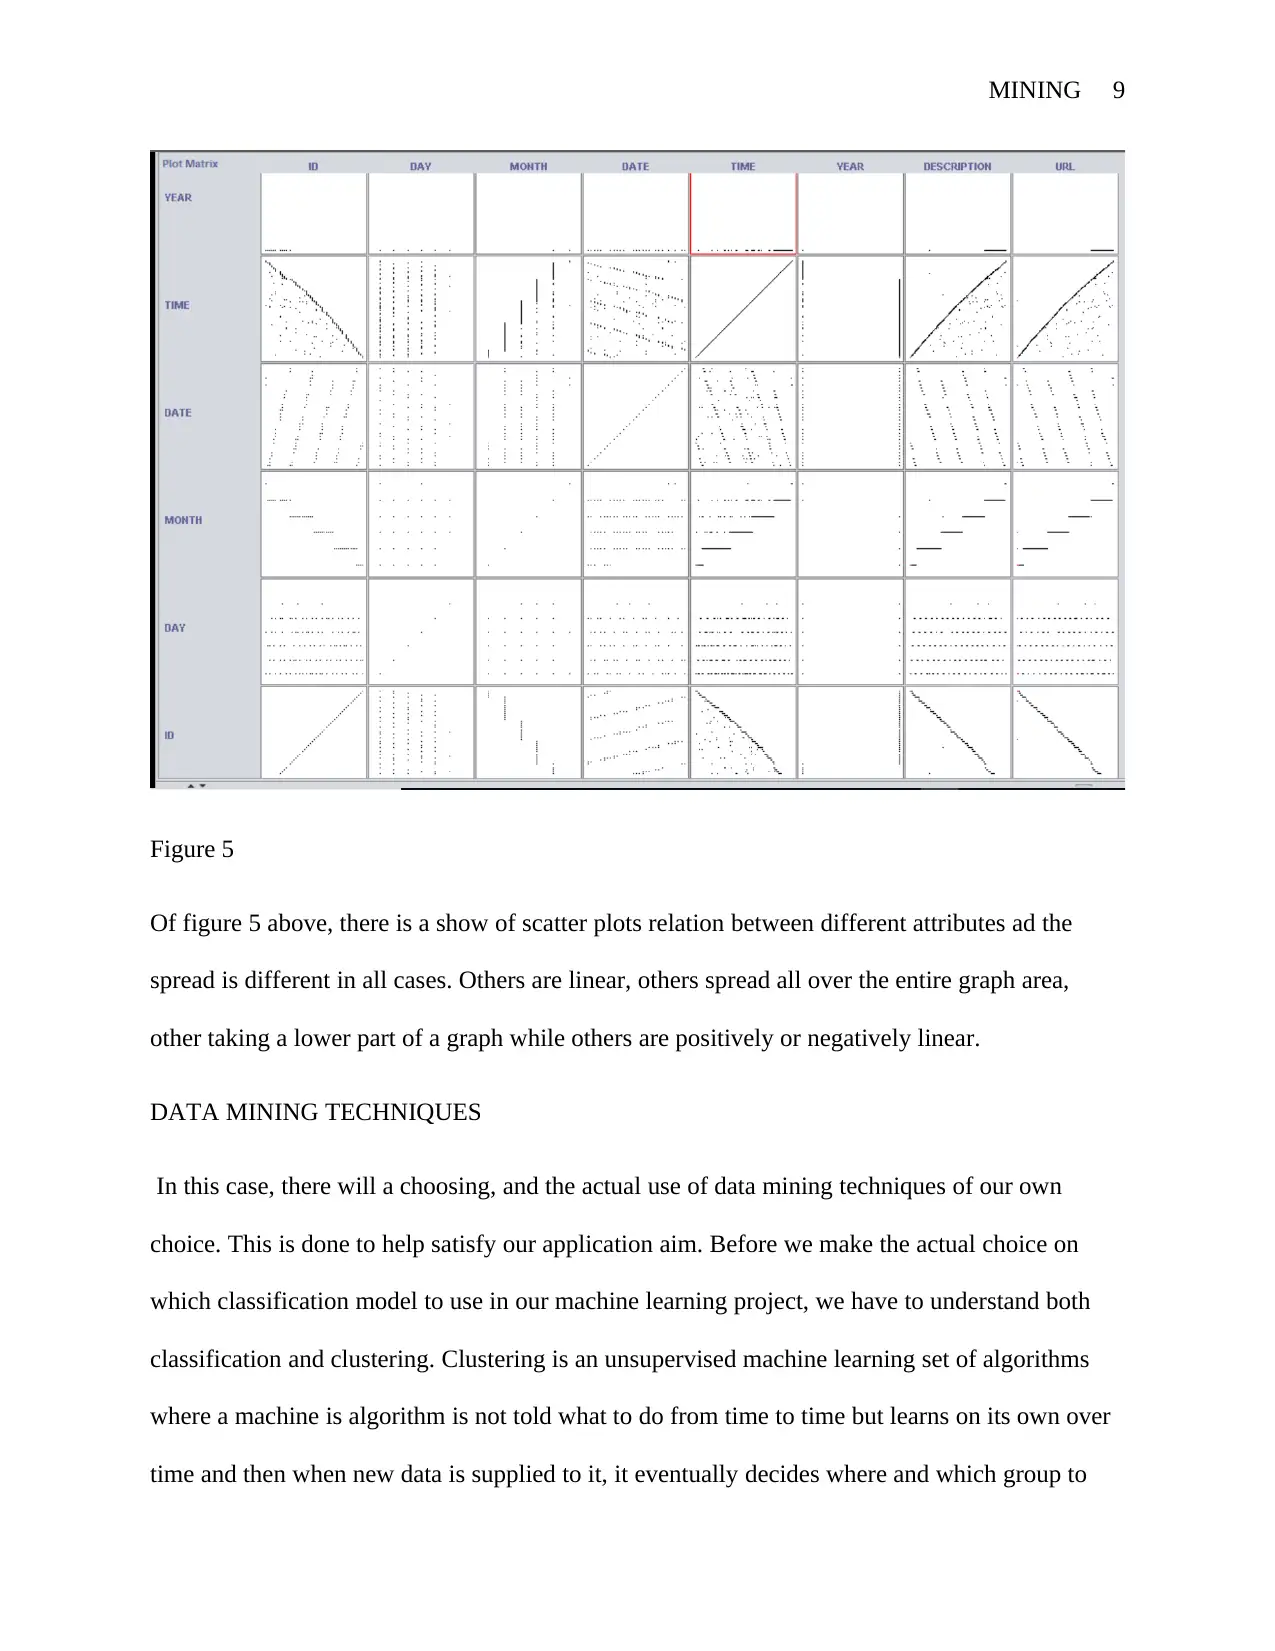
Figure 5
Of figure 5 above, there is a show of scatter plots relation between different attributes ad the
spread is different in all cases. Others are linear, others spread all over the entire graph area,
other taking a lower part of a graph while others are positively or negatively linear.
DATA MINING TECHNIQUES
In this case, there will a choosing, and the actual use of data mining techniques of our own
choice. This is done to help satisfy our application aim. Before we make the actual choice on
which classification model to use in our machine learning project, we have to understand both
classification and clustering. Clustering is an unsupervised machine learning set of algorithms
where a machine is algorithm is not told what to do from time to time but learns on its own over
time and then when new data is supplied to it, it eventually decides where and which group to
⊘ This is a preview!⊘
Do you want full access?
Subscribe today to unlock all pages.
Trusted by 1+ million students worldwide
MINING 10
put and item (Kulkarni and Kulkarni, 2016). Take for instance a group of fruits, where we have
bananas, apples, mangoes and pineapples mixed up without a plan. When a clustering algorithm
is supplied, it will be able to recognize which category the mixed up fruits fall under and classify
them accordingly in their respective groups (Naik and Samant, 2016).
Types of clustering algorithms are partitioning methods, Hierarchical clustering, fuzzy
clustering, density-based clustering, model-based clustering (Mohsen et al. 2017).
Then the next thing we will do is get an understanding of classification. Classification is partly a
supervised set of algorithms where the models are told what to do from time to time even after
developing a model. In these algorithms, train data is used to develop algorithms after which test
data is supplied and later on the algorithm developed from the train data predicts what comes
next based on the test data that has been supplied to it (Arganda-Carreras et al. 2017).
The types of classification machine learning algorithms are; Linear Classifiers (Logistic
Regression and Naive Bayes Classifier), Nearest Neighbor, Support Vector Machines, Decision
Trees, Boosted Trees, Random Forest, Neural Network (Kodati, Vivekanandam and Ravi, 2019).
The problem that we will be focusing on will be a classification problem. There was the desire to
choose two classification model or algorithms and due to this, Decision Trees and Naïve Bayes
were chosen. the reason for this was to check which one was better than the other in terms of
performance percentage. To help us understand what each algorithm stand for, it is only wise
enough to look into the cons and pros of each and every algorithm as this would help in actually
getting a clearer picture of the two even before doing a thorough dive in into the actual analysis
that will be gotten from the WEKA dataset that will have to be provided into the system under
respective algorithms.
Paraphrase This Document
Need a fresh take? Get an instant paraphrase of this document with our AI Paraphraser
MINING 11
i. Advantages of a Decision Tree
a. Considering multiple consequences as it gives you room to look into data in multiple
different ways and not only in one way.
b. Decision trees are easy to understand as there are braches to leaves hence the formation
of a clear flow from the notch way down into the leaves. For the bulky trees, pruning can
be done to aid in the simpler trees that are easy to understand and that results in better
accuracy.
c. Transparency; the use of nodes is addressing uncertainties and this makes the end process
more clear.
d. Simplicity; A major decision tree analysis advantages are its ability to assign specific
values to problem, decisions, and outcomes of each decision. This reduces ambiguity in
decision-making.
e. Ease of use; the graphical illustration that the decision tree provides is making it easier
for data scientists to make easier inferences. This is evident as the tree branch from node
to leaves which continues to grow afterwards.
f. Flexibility; Unlike other decision-making tools that require comprehensive quantitative
data, decision trees remain flexible to handle items with a mixture of real-valued and
categorical features and items with some missing features. Once constructed, they
classify new items quickly.
ii. Disadvantages
a. Wrongly placed decisions while developing a decision tree, may result in lack of
contingencies a scenario that might turn out to be detrimental in analysis in the long run
MINING 12
as the expected results cannot be obtained. This fact, therefore, requires serious
assessment. That brings about accuracy in implementing decisions.
b. They are unstable, a small change in data leads to a larger change in the structure of the
tree structure.
c. They are relatively inaccurate as most other algorithms perform better with similar data,
for example, the random forest.
d. The calculation gets very complicated particularly when most data point or attribute are
entirely related.
Since there will be a comparison between decision trees and Naïve Bayes, it is only important
that we do an inclusion on the same here as well for a start. Naïve Bayes is a supervised machine
learning algorithm as well and largely depends on train and test data sets to make a prediction
(Gupta et al. 2017).
Advantages of Naïve Bayes
i. The model converges quicker than the other models like logistic regression.
ii. You need less training dataset when using this model (Mohammed, Ali and Hassan,
2019).
Disadvantages of Naïve Bayes
i. It cannot learn the interaction between features. For instance, if your love for food
and movies are the same, it cannot know that at all (Jadhav and Channe, 2016).
⊘ This is a preview!⊘
Do you want full access?
Subscribe today to unlock all pages.
Trusted by 1+ million students worldwide
1 out of 25
Related Documents


Your All-in-One AI-Powered Toolkit for Academic Success.
+13062052269
info@desklib.com
Available 24*7 on WhatsApp / Email
![[object Object]](/_next/static/media/star-bottom.7253800d.svg)
Unlock your academic potential
Copyright © 2020–2026 A2Z Services. All Rights Reserved. Developed and managed by ZUCOL.