Macroeconomic Report: Analysis of GDP, Price, and Labor in the UK
VerifiedAdded on 2023/06/04
|7
|992
|171
Report
AI Summary
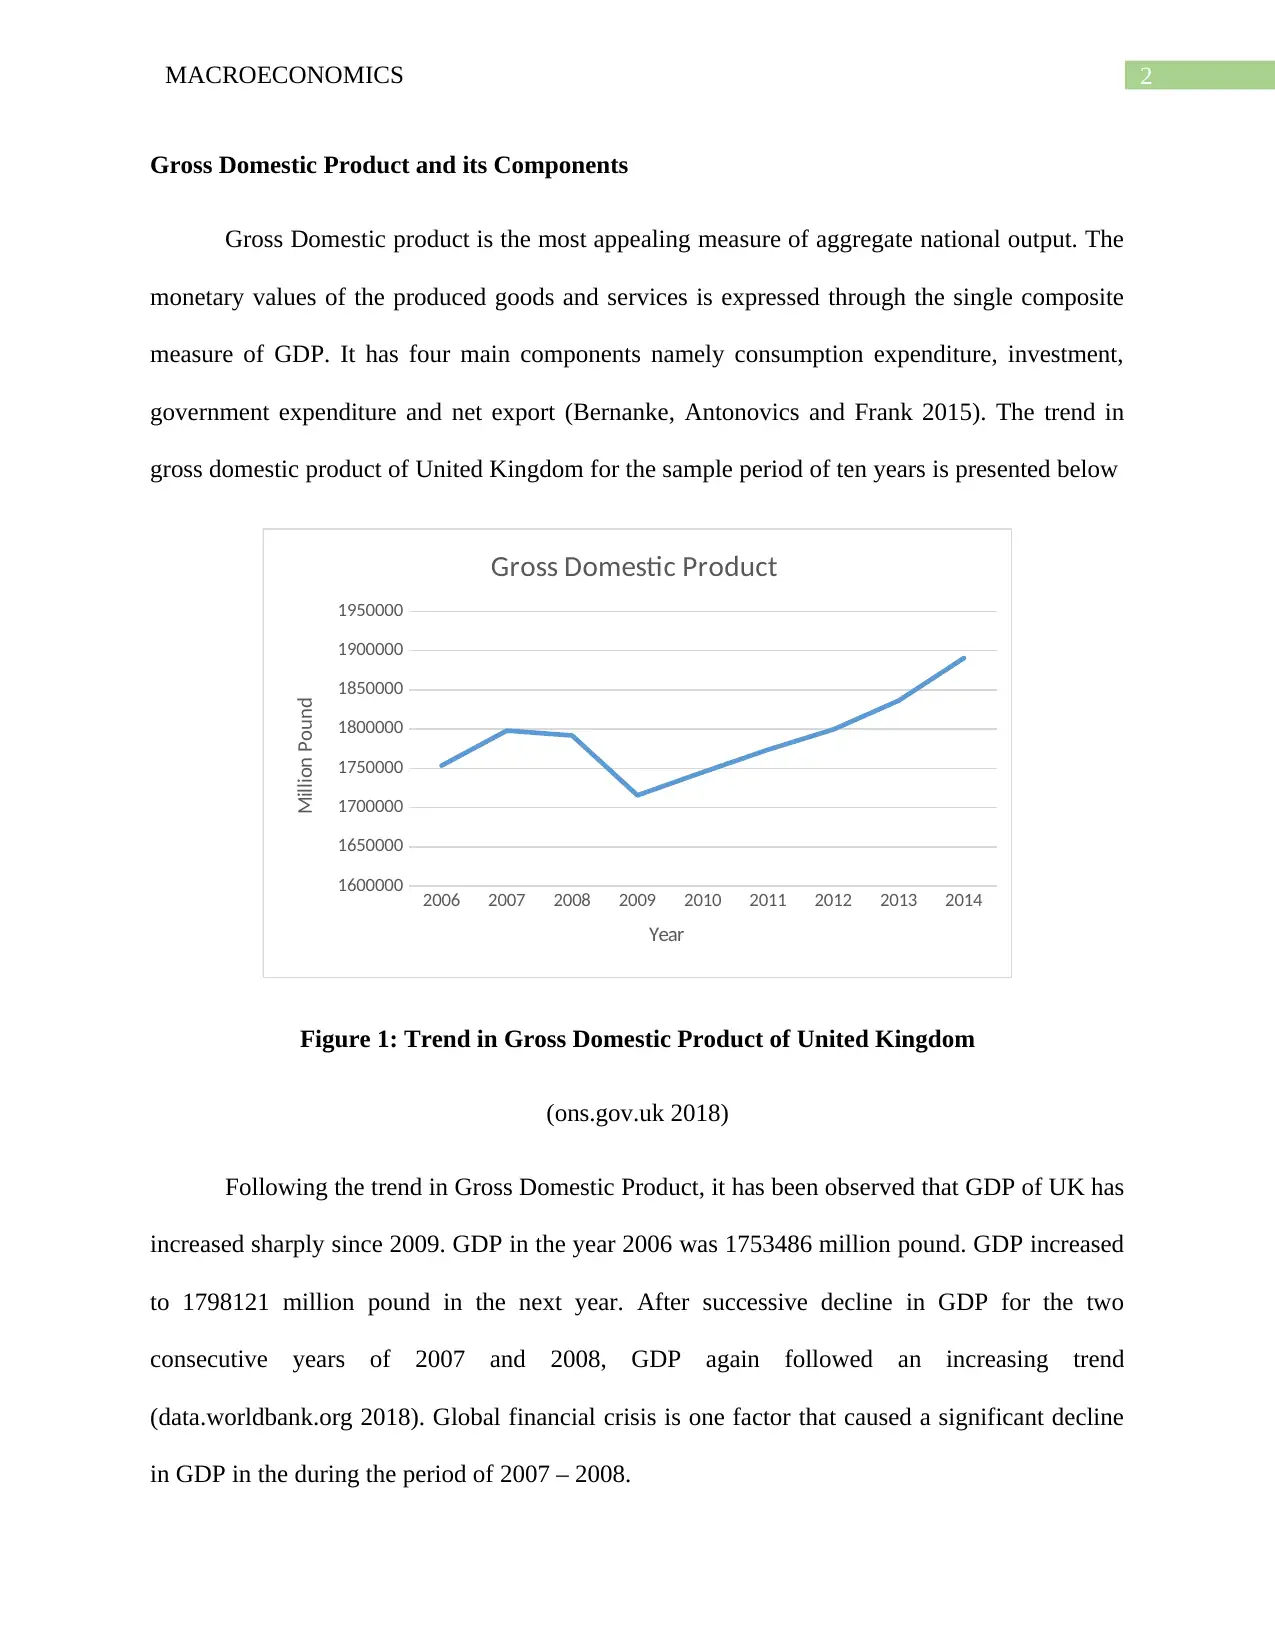
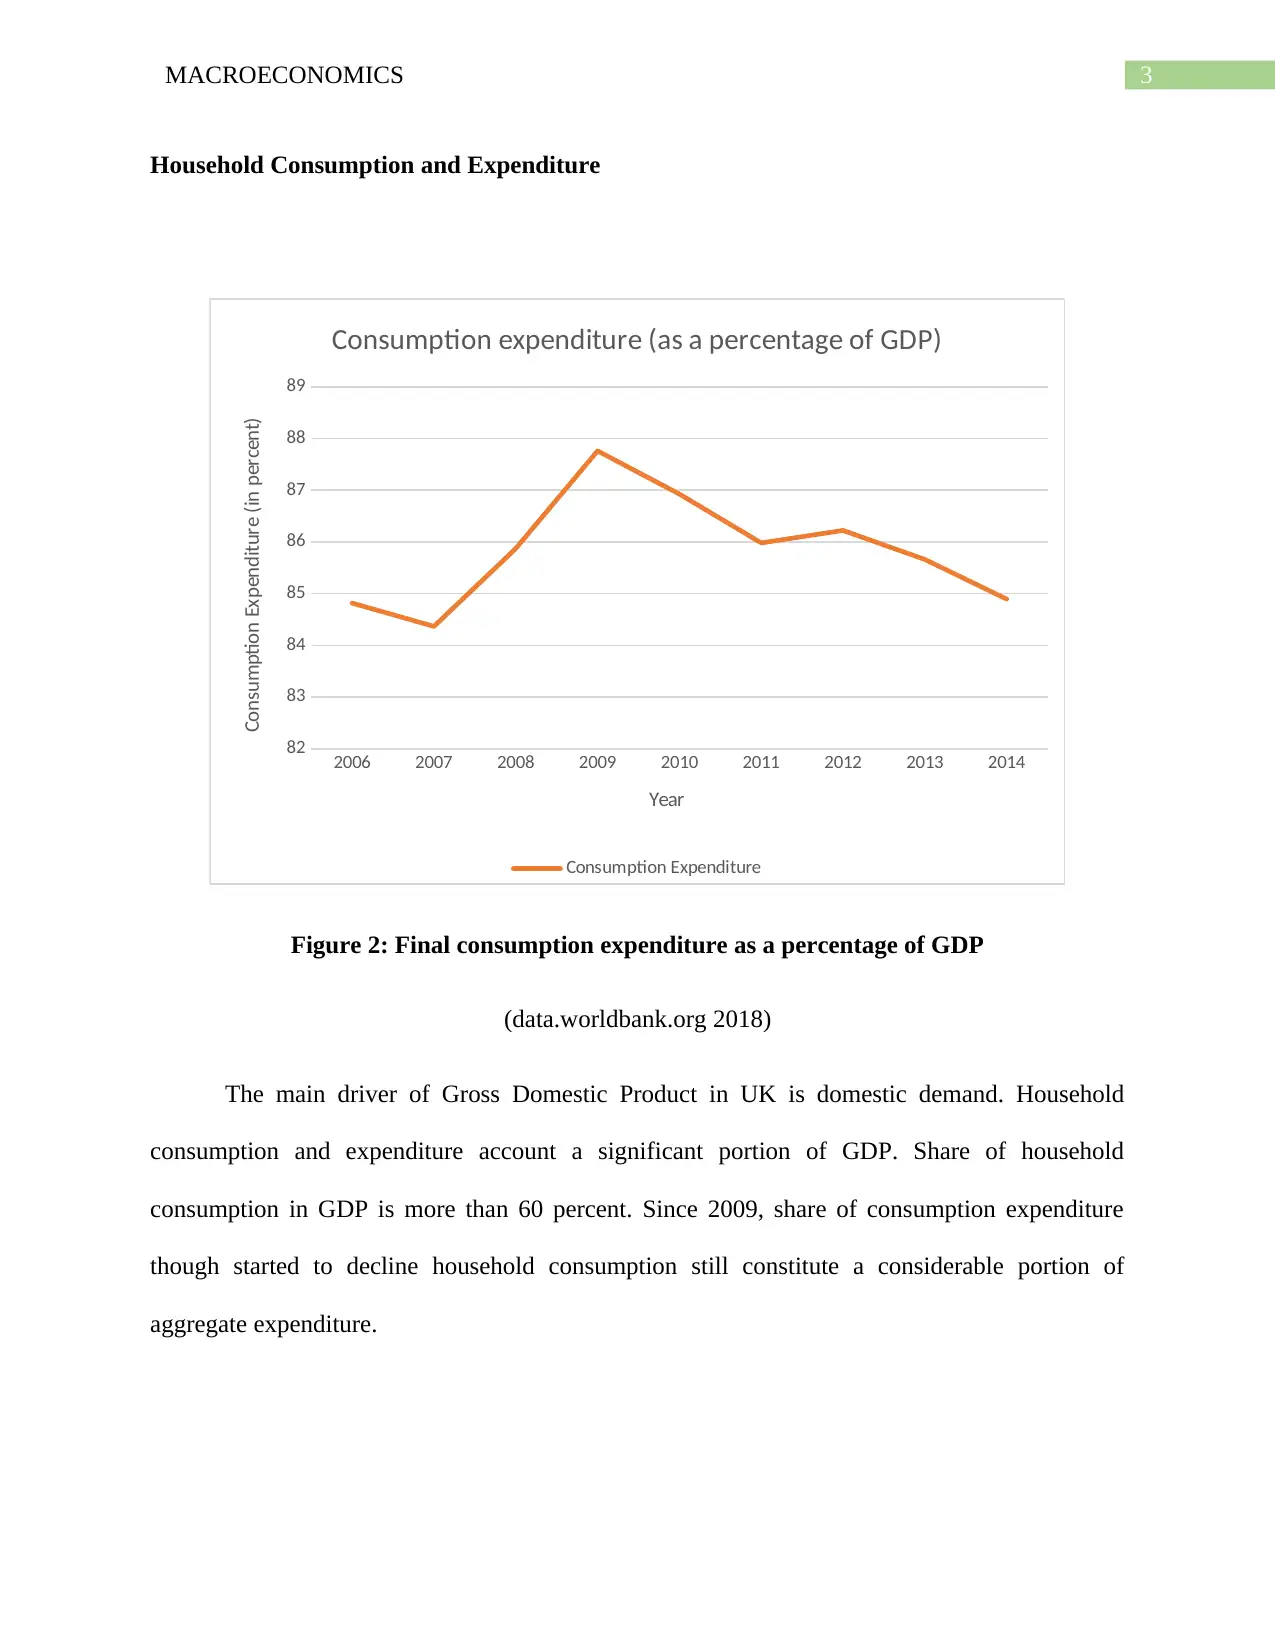
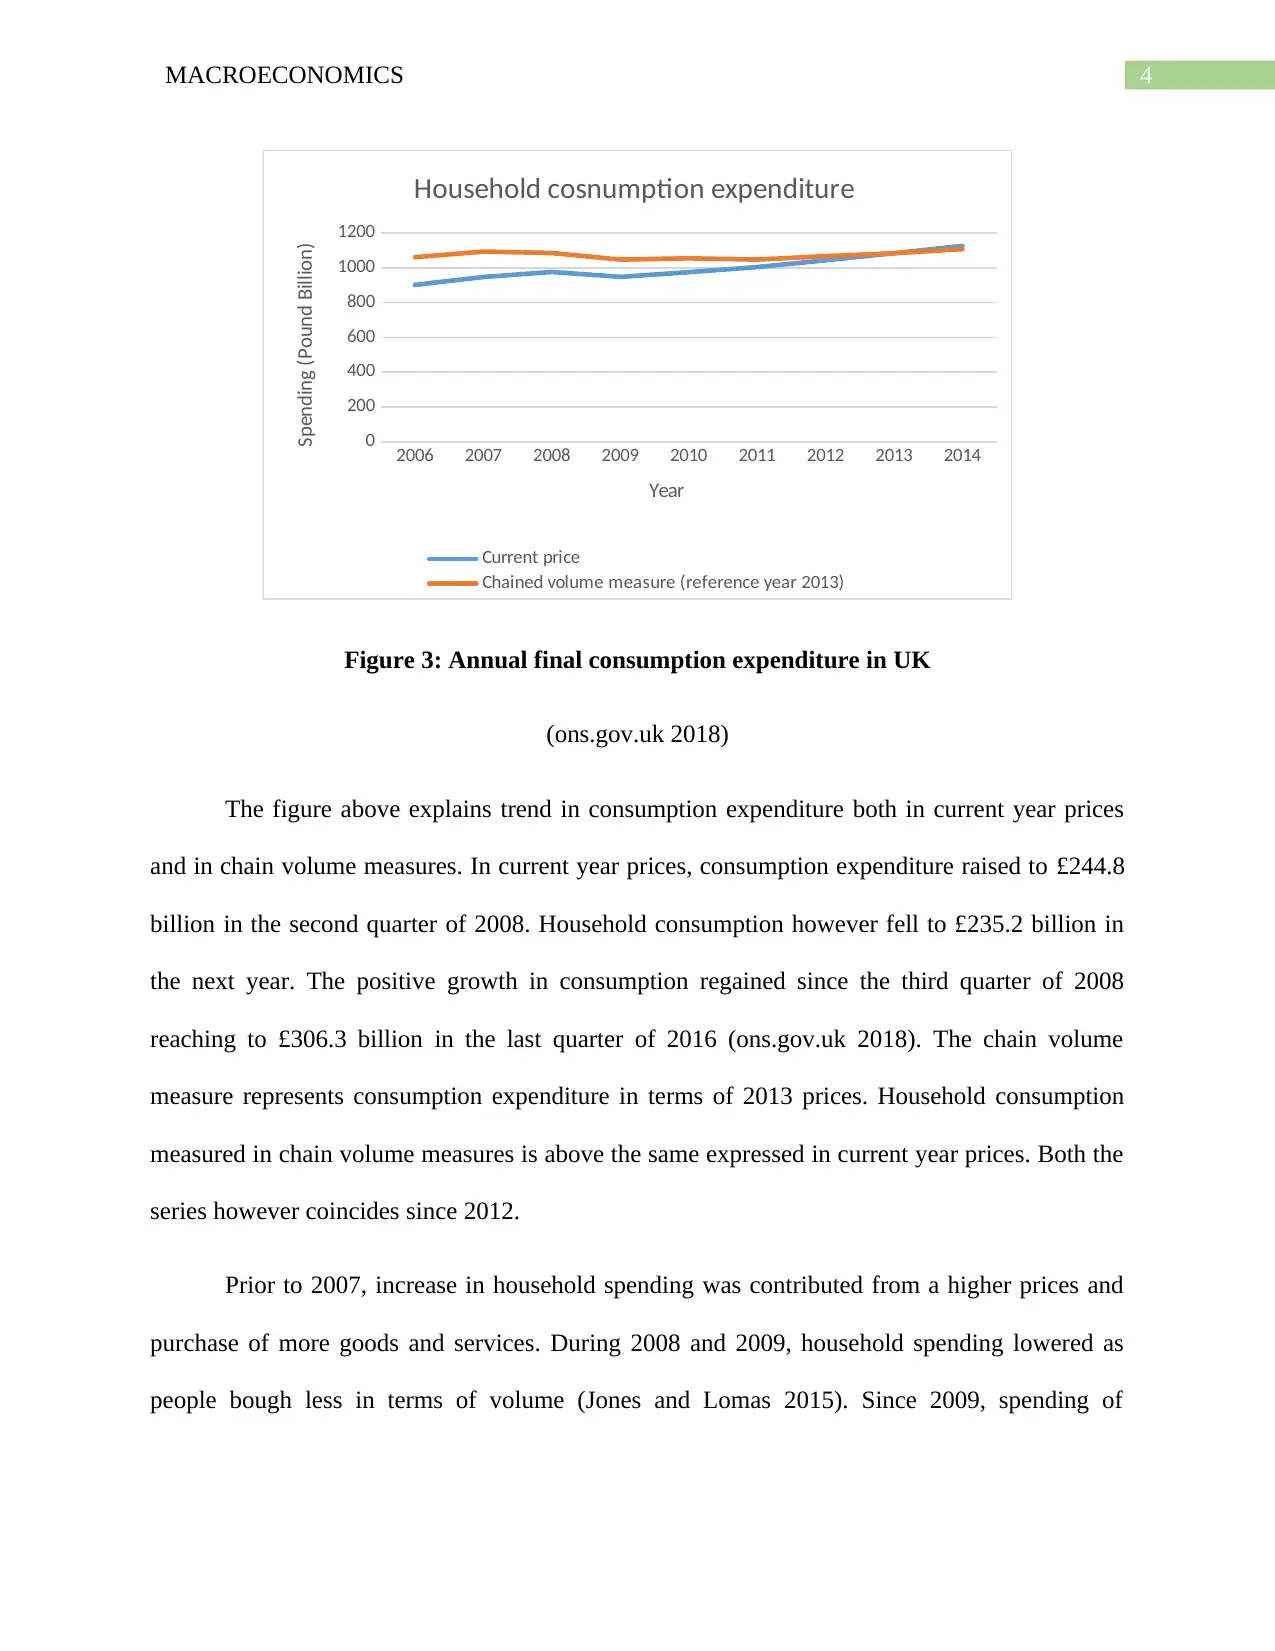
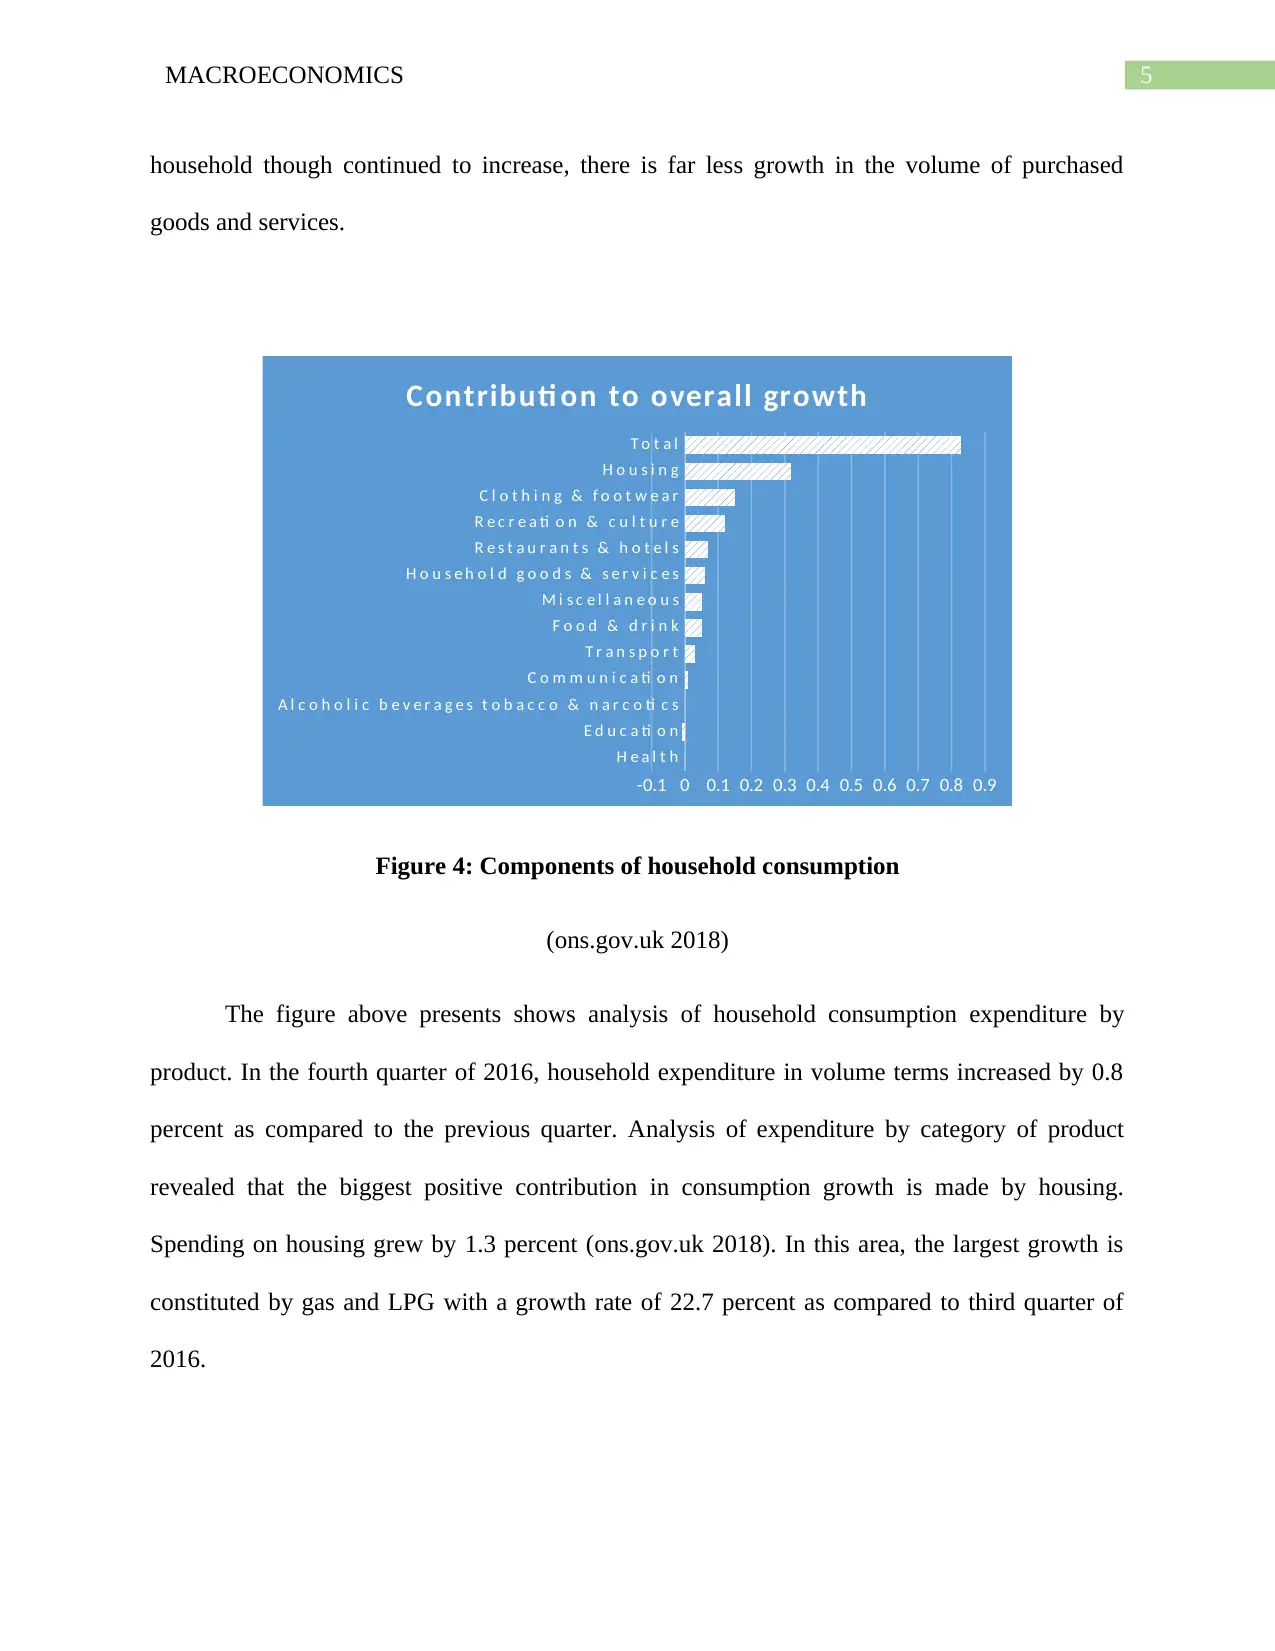
This report provides an analysis of the United Kingdom's macroeconomic performance over a ten-year period, focusing on Gross Domestic Product (GDP) and its components, household consumption and expenditure, price levels, and the labor market. It examines the trends in GDP, noting the impact of the global financial crisis and the subsequent recovery. The report highlights that domestic demand, particularly household consumption, is a major driver of GDP. An analysis of household consumption expenditure reveals shifts in spending patterns, including the impact of price changes and volume of goods purchased. Furthermore, the report breaks down household consumption by product category, identifying housing as a significant contributor to consumption growth. The data is sourced from official websites, including the World Bank and the Office for National Statistics (ONS).

Running head: MACROECONOMICS
Macroeconomics
Name of the Student
Name of the University
Course ID
Macroeconomics
Name of the Student
Name of the University
Course ID
Paraphrase This Document
Need a fresh take? Get an instant paraphrase of this document with our AI Paraphraser

1MACROECONOMICS
Table of Contents
Gross Domestic Product and its Components.................................................................................2
Household Consumption and Expenditure..................................................................................3
References list..................................................................................................................................6

2MACROECONOMICS
Gross Domestic Product and its Components
Gross Domestic product is the most appealing measure of aggregate national output. The
monetary values of the produced goods and services is expressed through the single composite
measure of GDP. It has four main components namely consumption expenditure, investment,
government expenditure and net export (Bernanke, Antonovics and Frank 2015). The trend in
gross domestic product of United Kingdom for the sample period of ten years is presented below
2006 2007 2008 2009 2010 2011 2012 2013 2014
1600000
1650000
1700000
1750000
1800000
1850000
1900000
1950000
Gross Domestic Product
Year
Million Pound
Figure 1: Trend in Gross Domestic Product of United Kingdom
(ons.gov.uk 2018)
Following the trend in Gross Domestic Product, it has been observed that GDP of UK has
increased sharply since 2009. GDP in the year 2006 was 1753486 million pound. GDP increased
to 1798121 million pound in the next year. After successive decline in GDP for the two
consecutive years of 2007 and 2008, GDP again followed an increasing trend
(data.worldbank.org 2018). Global financial crisis is one factor that caused a significant decline
in GDP in the during the period of 2007 – 2008.
⊘ This is a preview!⊘
Do you want full access?
Subscribe today to unlock all pages.

Trusted by 1+ million students worldwide

3MACROECONOMICS
Household Consumption and Expenditure
2006 2007 2008 2009 2010 2011 2012 2013 2014
82
83
84
85
86
87
88
89
Consumption expenditure (as a percentage of GDP)
Consumption Expenditure
Year
Consumption Expenditure (in percent)
Figure 2: Final consumption expenditure as a percentage of GDP
(data.worldbank.org 2018)
The main driver of Gross Domestic Product in UK is domestic demand. Household
consumption and expenditure account a significant portion of GDP. Share of household
consumption in GDP is more than 60 percent. Since 2009, share of consumption expenditure
though started to decline household consumption still constitute a considerable portion of
aggregate expenditure.
Paraphrase This Document
Need a fresh take? Get an instant paraphrase of this document with our AI Paraphraser

4MACROECONOMICS
2006 2007 2008 2009 2010 2011 2012 2013 2014
0
200
400
600
800
1000
1200
Household cosnumption expenditure
Current price
Chained volume measure (reference year 2013)
Year
Spending (Pound Billion)
Figure 3: Annual final consumption expenditure in UK
(ons.gov.uk 2018)
The figure above explains trend in consumption expenditure both in current year prices
and in chain volume measures. In current year prices, consumption expenditure raised to £244.8
billion in the second quarter of 2008. Household consumption however fell to £235.2 billion in
the next year. The positive growth in consumption regained since the third quarter of 2008
reaching to £306.3 billion in the last quarter of 2016 (ons.gov.uk 2018). The chain volume
measure represents consumption expenditure in terms of 2013 prices. Household consumption
measured in chain volume measures is above the same expressed in current year prices. Both the
series however coincides since 2012.
Prior to 2007, increase in household spending was contributed from a higher prices and
purchase of more goods and services. During 2008 and 2009, household spending lowered as
people bough less in terms of volume (Jones and Lomas 2015). Since 2009, spending of

5MACROECONOMICS
household though continued to increase, there is far less growth in the volume of purchased
goods and services.
H e a l t h
E d u c a ti o n
A l c o h o l i c b e v e r a g e s t o b a c c o & n a r c o ti c s
C o m m u n i c a ti o n
T r a n s p o r t
F o o d & d r i n k
M i s c e l l a n e o u s
H o u s e h o l d g o o d s & s e r v i c e s
R e s t a u r a n t s & h o t e l s
R e c r e a ti o n & c u l t u r e
C l o t h i n g & f o o t w e a r
H o u s i n g
T o t a l
-0.1 0 0.1 0.2 0.3 0.4 0.5 0.6 0.7 0.8 0.9
Contributi on to overall growth
Figure 4: Components of household consumption
(ons.gov.uk 2018)
The figure above presents shows analysis of household consumption expenditure by
product. In the fourth quarter of 2016, household expenditure in volume terms increased by 0.8
percent as compared to the previous quarter. Analysis of expenditure by category of product
revealed that the biggest positive contribution in consumption growth is made by housing.
Spending on housing grew by 1.3 percent (ons.gov.uk 2018). In this area, the largest growth is
constituted by gas and LPG with a growth rate of 22.7 percent as compared to third quarter of
2016.
⊘ This is a preview!⊘
Do you want full access?
Subscribe today to unlock all pages.

Trusted by 1+ million students worldwide

6MACROECONOMICS
References list
Bernanke, B., Antonovics, K. and Frank, R., 2015. Principles of macroeconomics. McGraw-Hill
Higher Education.
Data.worldbank.org. 2018. Final consumption expenditure (% of GDP) | Data. [online]
Available at: https://data.worldbank.org/indicator/NE.CON.TOTL.ZS?view=chart [Accessed 16
Oct. 2018].
Jones, R.V. and Lomas, K.J., 2015. Determinants of high electrical energy demand in UK
homes: Socio-economic and dwelling characteristics. Energy and Buildings, 101, pp.24-34.
Ons.gov.uk. 2018. Consumer trends, UK - Office for National Statistics. [online] Available at:
https://www.ons.gov.uk/economy/nationalaccounts/satelliteaccounts/bulletins/consumertrends/
quarter4octtodec2016 [Accessed 16 Oct. 2018].
1 out of 7
Related Documents

Your All-in-One AI-Powered Toolkit for Academic Success.
+13062052269
info@desklib.com
Available 24*7 on WhatsApp / Email
Unlock your academic potential
© 2024 | Zucol Services PVT LTD | All rights reserved.