ECON604: Macroeconomics in Global Environment Assignment Analysis
VerifiedAdded on 2023/06/07
|10
|1723
|153
Homework Assignment
AI Summary
This assignment solution delves into macroeconomics within a global context, focusing on the economic landscapes of New Zealand, Australia, the USA, and other countries from 1980 to 2016. It analyzes GDP per capita trends, the impact of the Asian financial crisis, and the application of Okun's Law. The document also examines New Zealand's fiscal policies, government spending, taxes, and welfare payments, alongside an analysis of inflation measured by the GDP deflator and CPI. It provides a detailed overview of economic policies and their effects on national economies, offering insights into how different countries responded to economic challenges and managed their resources. Desklib provides a platform to explore similar solved assignments and past papers for students.
Running head: MACROECONOMICS IN GLOBAL ENVIRONMENT 1
Macroeconomics in global environment
Name of the student:
Name of the University:
Authors Note:
:
Macroeconomics in global environment
Name of the student:
Name of the University:
Authors Note:
:
Paraphrase This Document
Need a fresh take? Get an instant paraphrase of this document with our AI Paraphraser
MACROECONOMICS IN GLOBAL ENVIRONMENT 2
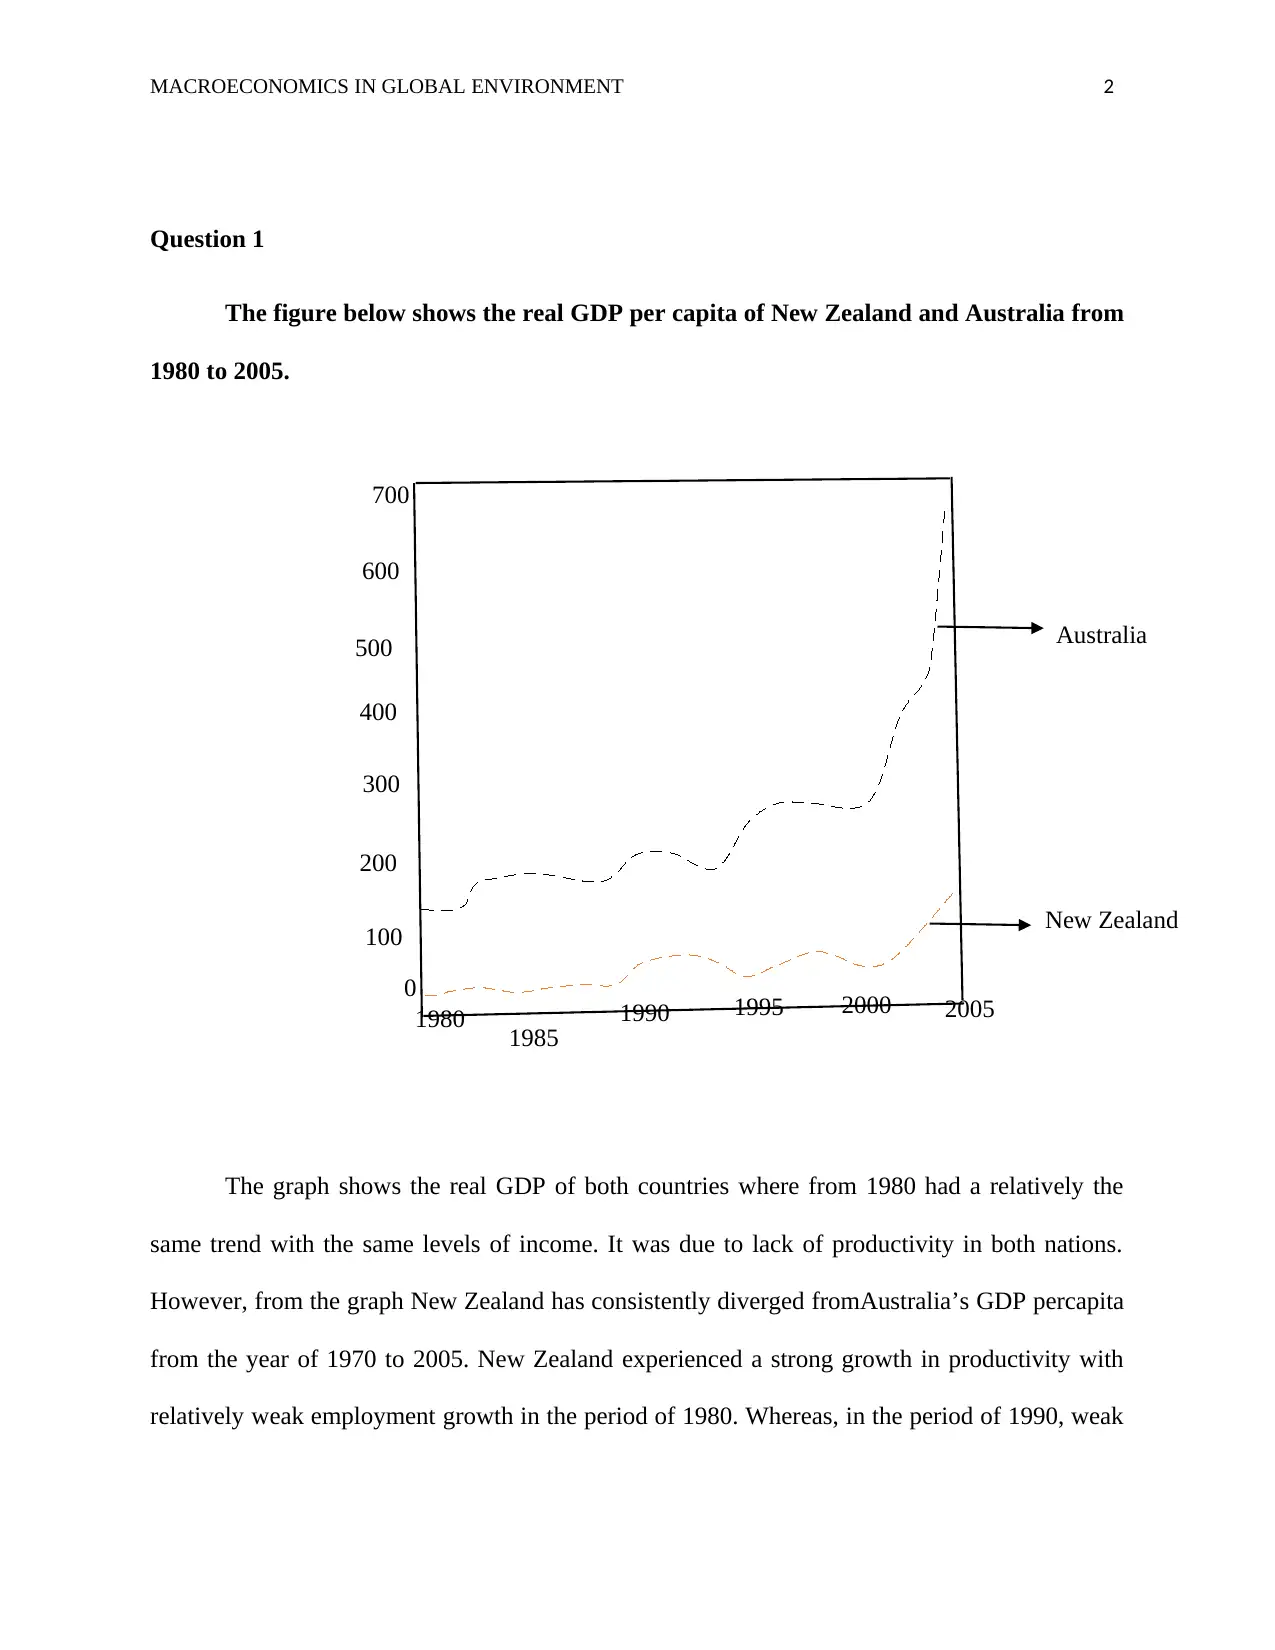
Question 1
The figure below shows the real GDP per capita of New Zealand and Australia from
1980 to 2005.
The graph shows the real GDP of both countries where from 1980 had a relatively the
same trend with the same levels of income. It was due to lack of productivity in both nations.
However, from the graph New Zealand has consistently diverged fromAustralia’s GDP percapita
from the year of 1970 to 2005. New Zealand experienced a strong growth in productivity with
relatively weak employment growth in the period of 1980. Whereas, in the period of 1990, weak
0
100
200
300
400
500
700
200019951990
1985
1980 2005
Australia
New Zealand
600
MACROECONOMICS IN GLOBAL ENVIRONMENT 3
productivity with a relatively strong employment were also experienced. High inflation was later
experienced in New Zealand during the period of 1980 (Reserve Bank of New Zealand, 2018).
A reduction in demand for mineral commodities was experienced by the Asians due to
economic crisis during 1990. With this crisis, there was an increase in production of
metalliferous commodities by the Australian firms which worsened the oversupply that
maintained the downward mental price pressure. It also increased the production of commodities
from other countries(Burns and Baffes, 2018). More so, there was another burden from gold
producers of England, Russia, Malaysia and Jordan that reduced these prices which resulted in
abolishing of the gold role as national reserve asset. As the result some of the high cost
operations closed and fluctuations in the mining shareholder industry continued. More variations
were seen as reports to the Mineral Council of Australia indicated a decline from 23.0% to 2.0%
in 1997 to 1998 and 1989 to 1990 respectively (Burns and Baffes, 2018). Therefore, different
handling of the Asian crisis of 1990 with restrictive monetary policy of New Zealand contributed
to the divergence in the level of GDP per capita.
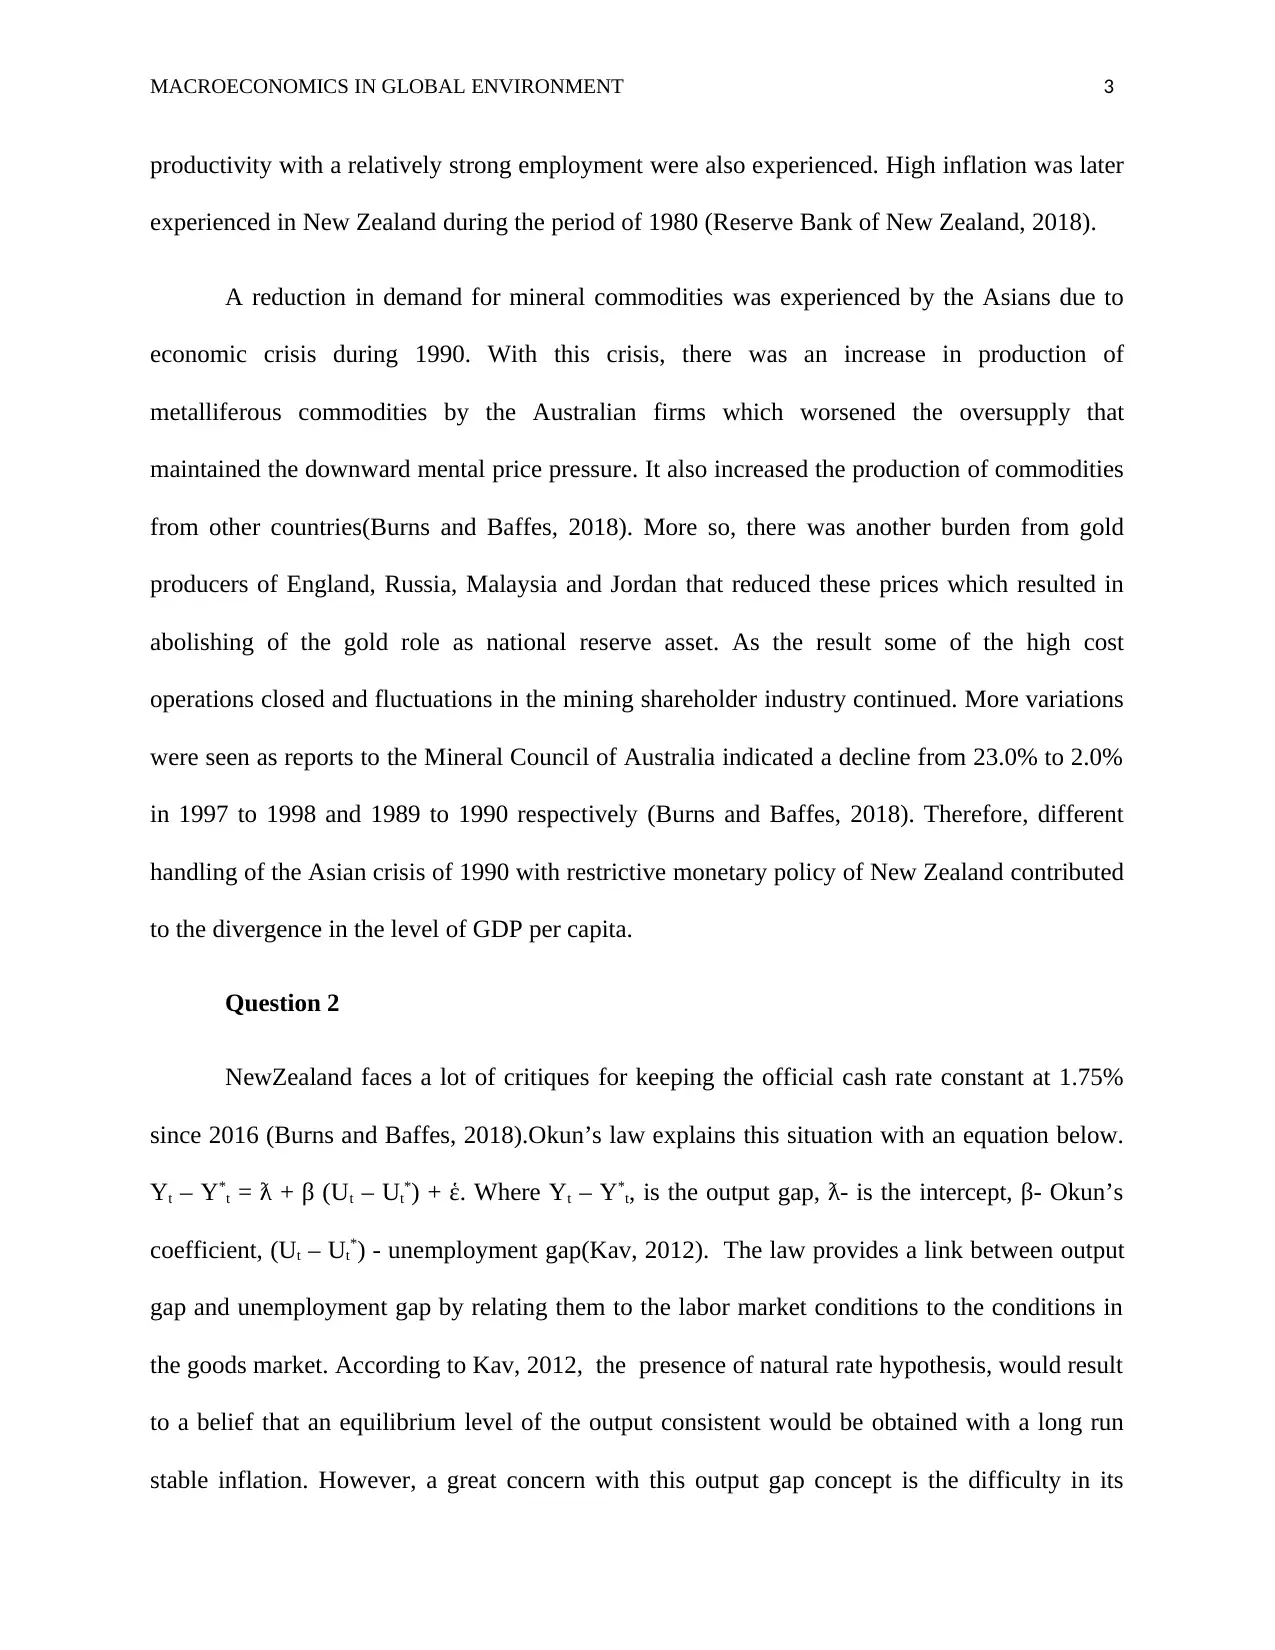
Question 2
NewZealand faces a lot of critiques for keeping the official cash rate constant at 1.75%
since 2016 (Burns and Baffes, 2018).Okun’s law explains this situation with an equation below.
Yt – Y*t = ƛ + β (Ut – Ut*) + ἑ. Where Yt – Y*t, is the output gap, ƛ- is the intercept, β- Okun’s
coefficient, (Ut – Ut*) - unemployment gap(Kav, 2012). The law provides a link between output
gap and unemployment gap by relating them to the labor market conditions to the conditions in
the goods market. According to Kav, 2012, the presence of natural rate hypothesis, would result
to a belief that an equilibrium level of the output consistent would be obtained with a long run
stable inflation. However, a great concern with this output gap concept is the difficulty in its
productivity with a relatively strong employment were also experienced. High inflation was later
experienced in New Zealand during the period of 1980 (Reserve Bank of New Zealand, 2018).
A reduction in demand for mineral commodities was experienced by the Asians due to
economic crisis during 1990. With this crisis, there was an increase in production of
metalliferous commodities by the Australian firms which worsened the oversupply that
maintained the downward mental price pressure. It also increased the production of commodities
from other countries(Burns and Baffes, 2018). More so, there was another burden from gold
producers of England, Russia, Malaysia and Jordan that reduced these prices which resulted in
abolishing of the gold role as national reserve asset. As the result some of the high cost
operations closed and fluctuations in the mining shareholder industry continued. More variations
were seen as reports to the Mineral Council of Australia indicated a decline from 23.0% to 2.0%
in 1997 to 1998 and 1989 to 1990 respectively (Burns and Baffes, 2018). Therefore, different
handling of the Asian crisis of 1990 with restrictive monetary policy of New Zealand contributed
to the divergence in the level of GDP per capita.
Question 2
NewZealand faces a lot of critiques for keeping the official cash rate constant at 1.75%
since 2016 (Burns and Baffes, 2018).Okun’s law explains this situation with an equation below.
Yt – Y*t = ƛ + β (Ut – Ut*) + ἑ. Where Yt – Y*t, is the output gap, ƛ- is the intercept, β- Okun’s
coefficient, (Ut – Ut*) - unemployment gap(Kav, 2012). The law provides a link between output
gap and unemployment gap by relating them to the labor market conditions to the conditions in
the goods market. According to Kav, 2012, the presence of natural rate hypothesis, would result
to a belief that an equilibrium level of the output consistent would be obtained with a long run
stable inflation. However, a great concern with this output gap concept is the difficulty in its
⊘ This is a preview!⊘
Do you want full access?
Subscribe today to unlock all pages.
Trusted by 1+ million students worldwide
MACROECONOMICS IN GLOBAL ENVIRONMENT 4
measurement. The output level is directly obtained from the macroeconomic data because it is
unobservable. It involves some risks like low business confidence within the nation. When this
happens, investment decisions and employment are greatly affected.
The next decision should say the official Cash Rate reduced which encourages
investment within the nation. When this is done, production is increased as the output gap is
maintained in a good position. The output gap is the difference between the actual output and
potential output. That is to say; Y – Y*, where Y is the actual output and Y* is the potential
output. However, potential output is the level that is consistently maintained in the economic
activity without pressure from inflation(Burns and Baffes, 2018). With that, the economy should
always maintain the potential output level with its productive capacity. Otherwise inflation rises
due to demand pressures from key markets when output gap is positive and the potential output
is less than the actual output. Similarly, the same reasoning applies when there is a negative
output gap. Okun’s law states that for every increase in 1.0% of unemployment rate, there is a
2.0% additional in a nation’s GDP which is lower than the potential GDP(Burns and Baffes,
2018).
That is to say; (Y – Y*)/ Y* = c(u-u-), where, Y – actual output, Y*- potential GDP, U-
actual unemployment rate, u- - natural rate of unemployment and c- is the factor relating changes
in the unemployment with the changes in the output. So, unemployment is directly proportional
to the fall in the GDP(Kav, 2012). Hence, demand for imports increases with increase in the
unemployment for rate in the nation. Y= Mx + C, where Y- is the demand, M – level of imports
and C is the constant.
Paraphrase This Document
Need a fresh take? Get an instant paraphrase of this document with our AI Paraphraser
MACROECONOMICS IN GLOBAL ENVIRONMENT 5
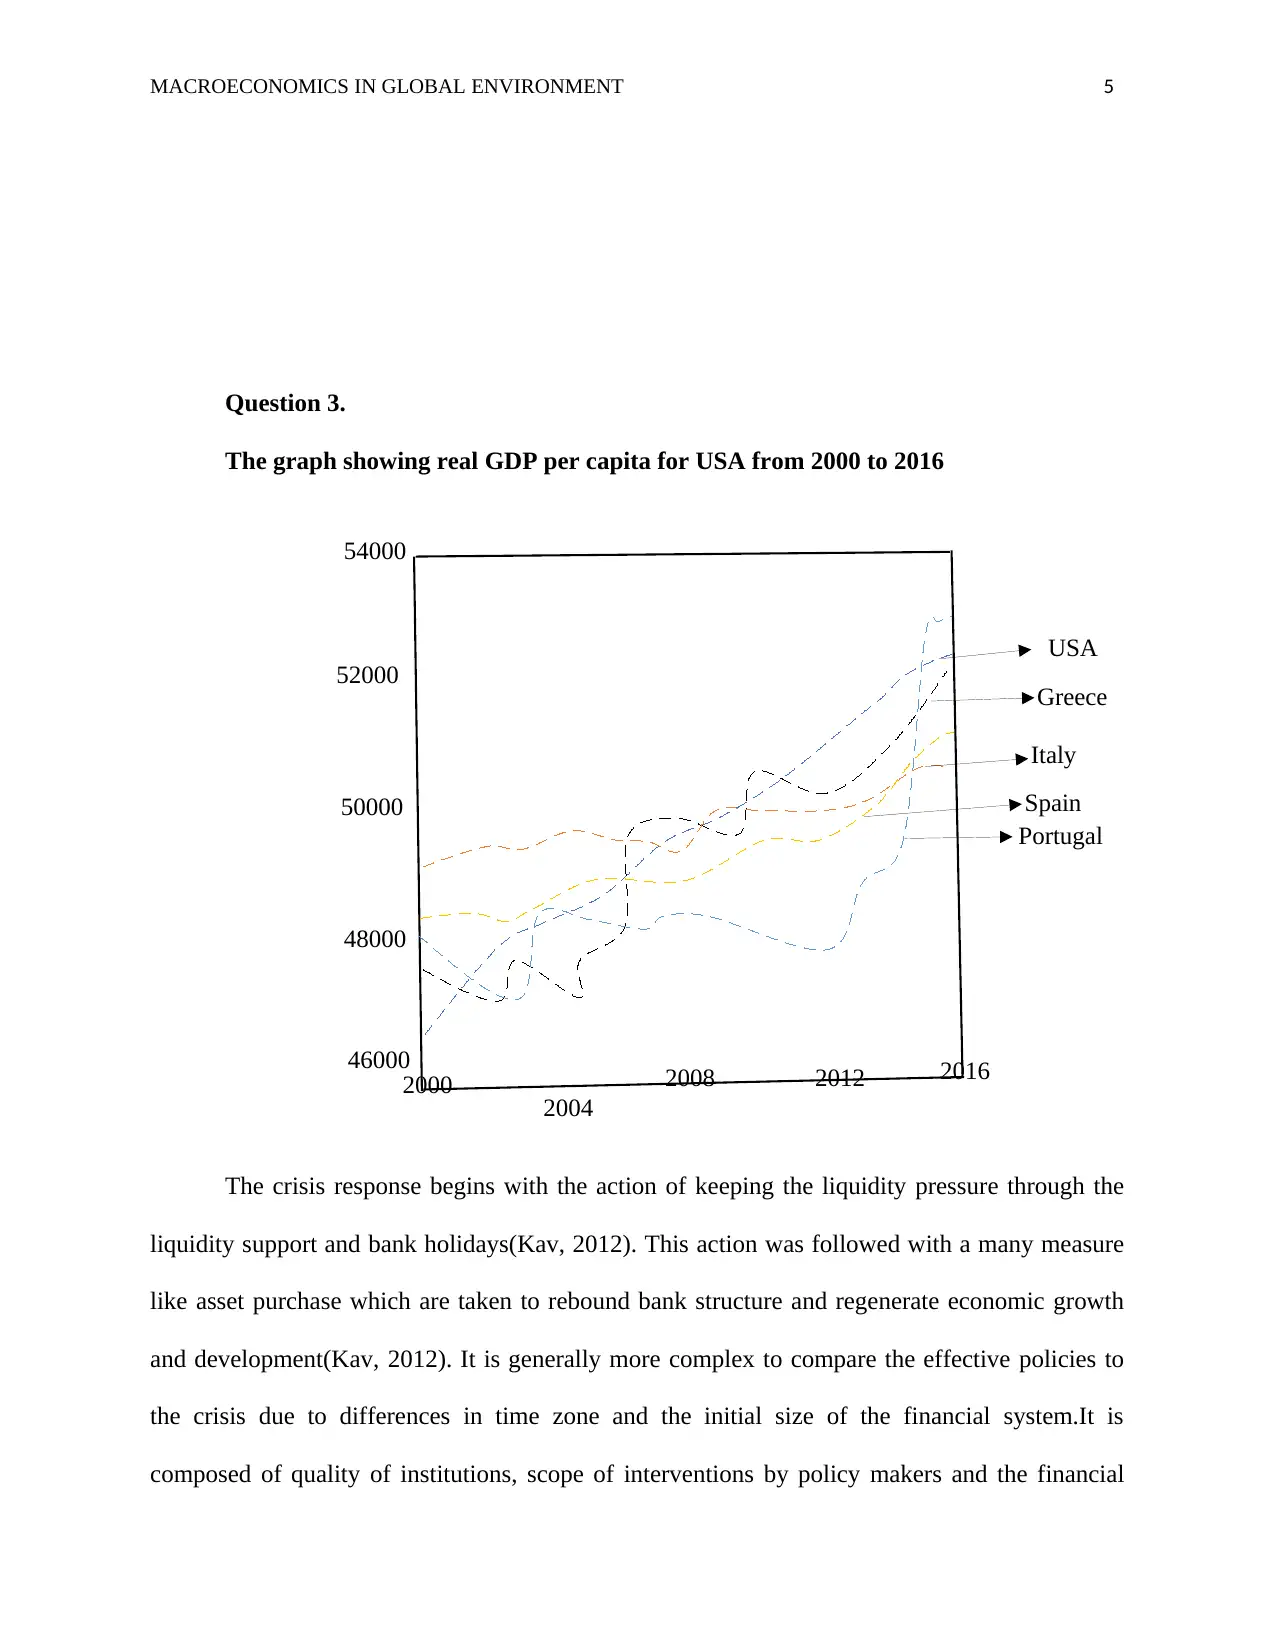
Question 3.
The graph showing real GDP per capita for USA from 2000 to 2016
The crisis response begins with the action of keeping the liquidity pressure through the
liquidity support and bank holidays(Kav, 2012). This action was followed with a many measure
like asset purchase which are taken to rebound bank structure and regenerate economic growth
and development(Kav, 2012). It is generally more complex to compare the effective policies to
the crisis due to differences in time zone and the initial size of the financial system.It is
composed of quality of institutions, scope of interventions by policy makers and the financial
46000
48000
50000
52000
54000
201620122008
2004
2000
Greece
USA
Italy
Spain
Portugal
MACROECONOMICS IN GLOBAL ENVIRONMENT 6
size system of a country. With this evidence, we can now compare the policy responses by the
other countries.Failure to have large financial institutions could have constrained them from
responding to the crisis(Kav, 2012).
The involvement of the large scale and government intervention in the financial
institution and sectors could have helped to immediately respond to the crisis. The real GDP per
capita for USA was increasing from the year of 2000 to 2016. This shows the country was doing
much better since its economic policies were put into consideration.It is seen from the graph that
the real GDP per capita was increasing over time due to good policy makers. USA made full
utilization of their available resources to generate enough income for their citizens which
increased their purchasingpower(Kav, 2012). On the other hand, presence of dormant and
unexploitable resources in Greece, Italy, Portugal and Spain restricted their growth in real GDP
per capita.
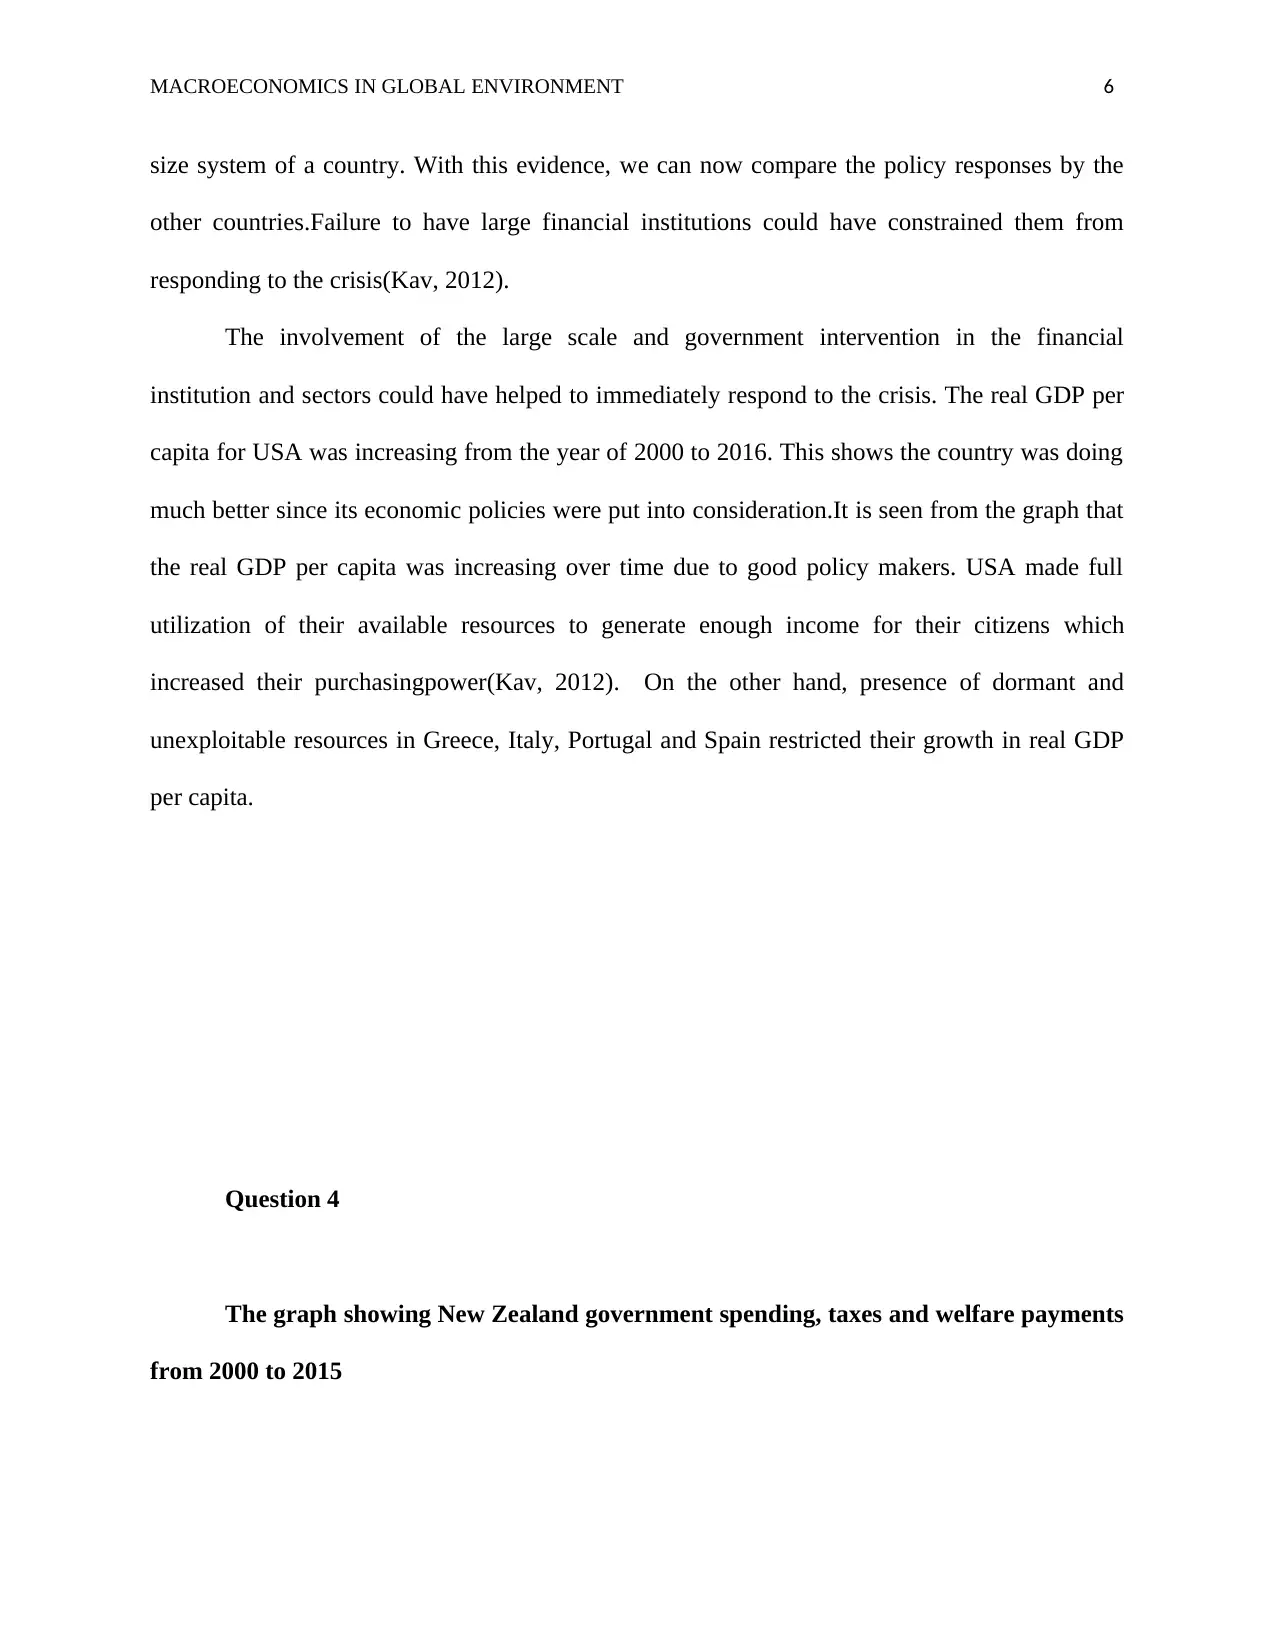
Question 4
The graph showing New Zealand government spending, taxes and welfare payments
from 2000 to 2015
size system of a country. With this evidence, we can now compare the policy responses by the
other countries.Failure to have large financial institutions could have constrained them from
responding to the crisis(Kav, 2012).
The involvement of the large scale and government intervention in the financial
institution and sectors could have helped to immediately respond to the crisis. The real GDP per
capita for USA was increasing from the year of 2000 to 2016. This shows the country was doing
much better since its economic policies were put into consideration.It is seen from the graph that
the real GDP per capita was increasing over time due to good policy makers. USA made full
utilization of their available resources to generate enough income for their citizens which
increased their purchasingpower(Kav, 2012). On the other hand, presence of dormant and
unexploitable resources in Greece, Italy, Portugal and Spain restricted their growth in real GDP
per capita.
Question 4
The graph showing New Zealand government spending, taxes and welfare payments
from 2000 to 2015
⊘ This is a preview!⊘
Do you want full access?
Subscribe today to unlock all pages.
Trusted by 1+ million students worldwide
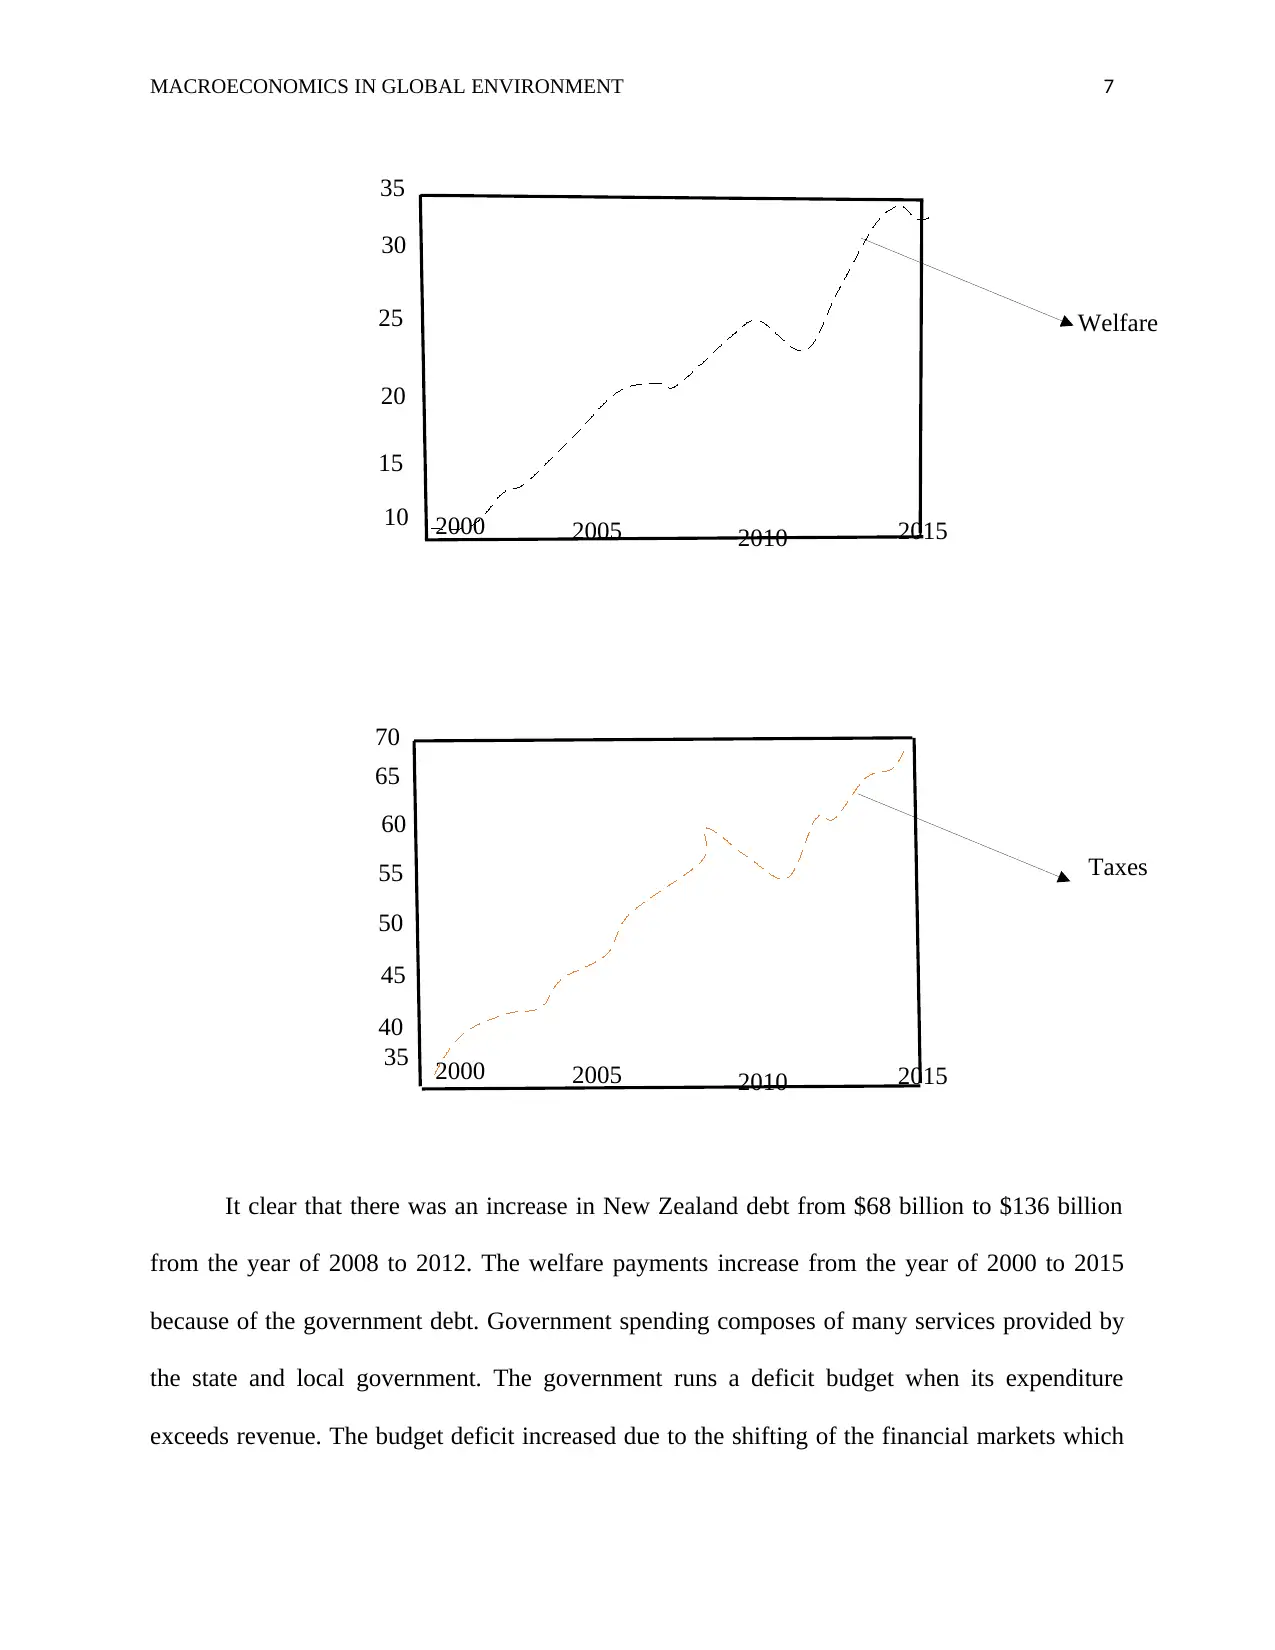
MACROECONOMICS IN GLOBAL ENVIRONMENT 7
It clear that there was an increase in New Zealand debt from $68 billion to $136 billion
from the year of 2008 to 2012. The welfare payments increase from the year of 2000 to 2015
because of the government debt. Government spending composes of many services provided by
the state and local government. The government runs a deficit budget when its expenditure
exceeds revenue. The budget deficit increased due to the shifting of the financial markets which
10
15
20
25
35
201520102000 2005
Welfare
30
35
40
45
55
201520102000 2005
Taxes
60
50
65
70
Paraphrase This Document
Need a fresh take? Get an instant paraphrase of this document with our AI Paraphraser
MACROECONOMICS IN GLOBAL ENVIRONMENT 8
has also increased the burdens in debt. Similarly, the cause could be the increasing import
demand that increases the profits for foreign companies.
Therefore, budget deficit is T- G, in the case where G>T
4019.00 – 11499.00 = $7480 as the budget deficit of New Zealand.The government debt
could have increased due to many reasons like poor financing of the initial debt and lack of
enough resources to pay back the loan.The government did not make any response in repaying
the initial loan but instead the debt increased which indicates lack of response by the government
(Kav, 2012).
Question 5.
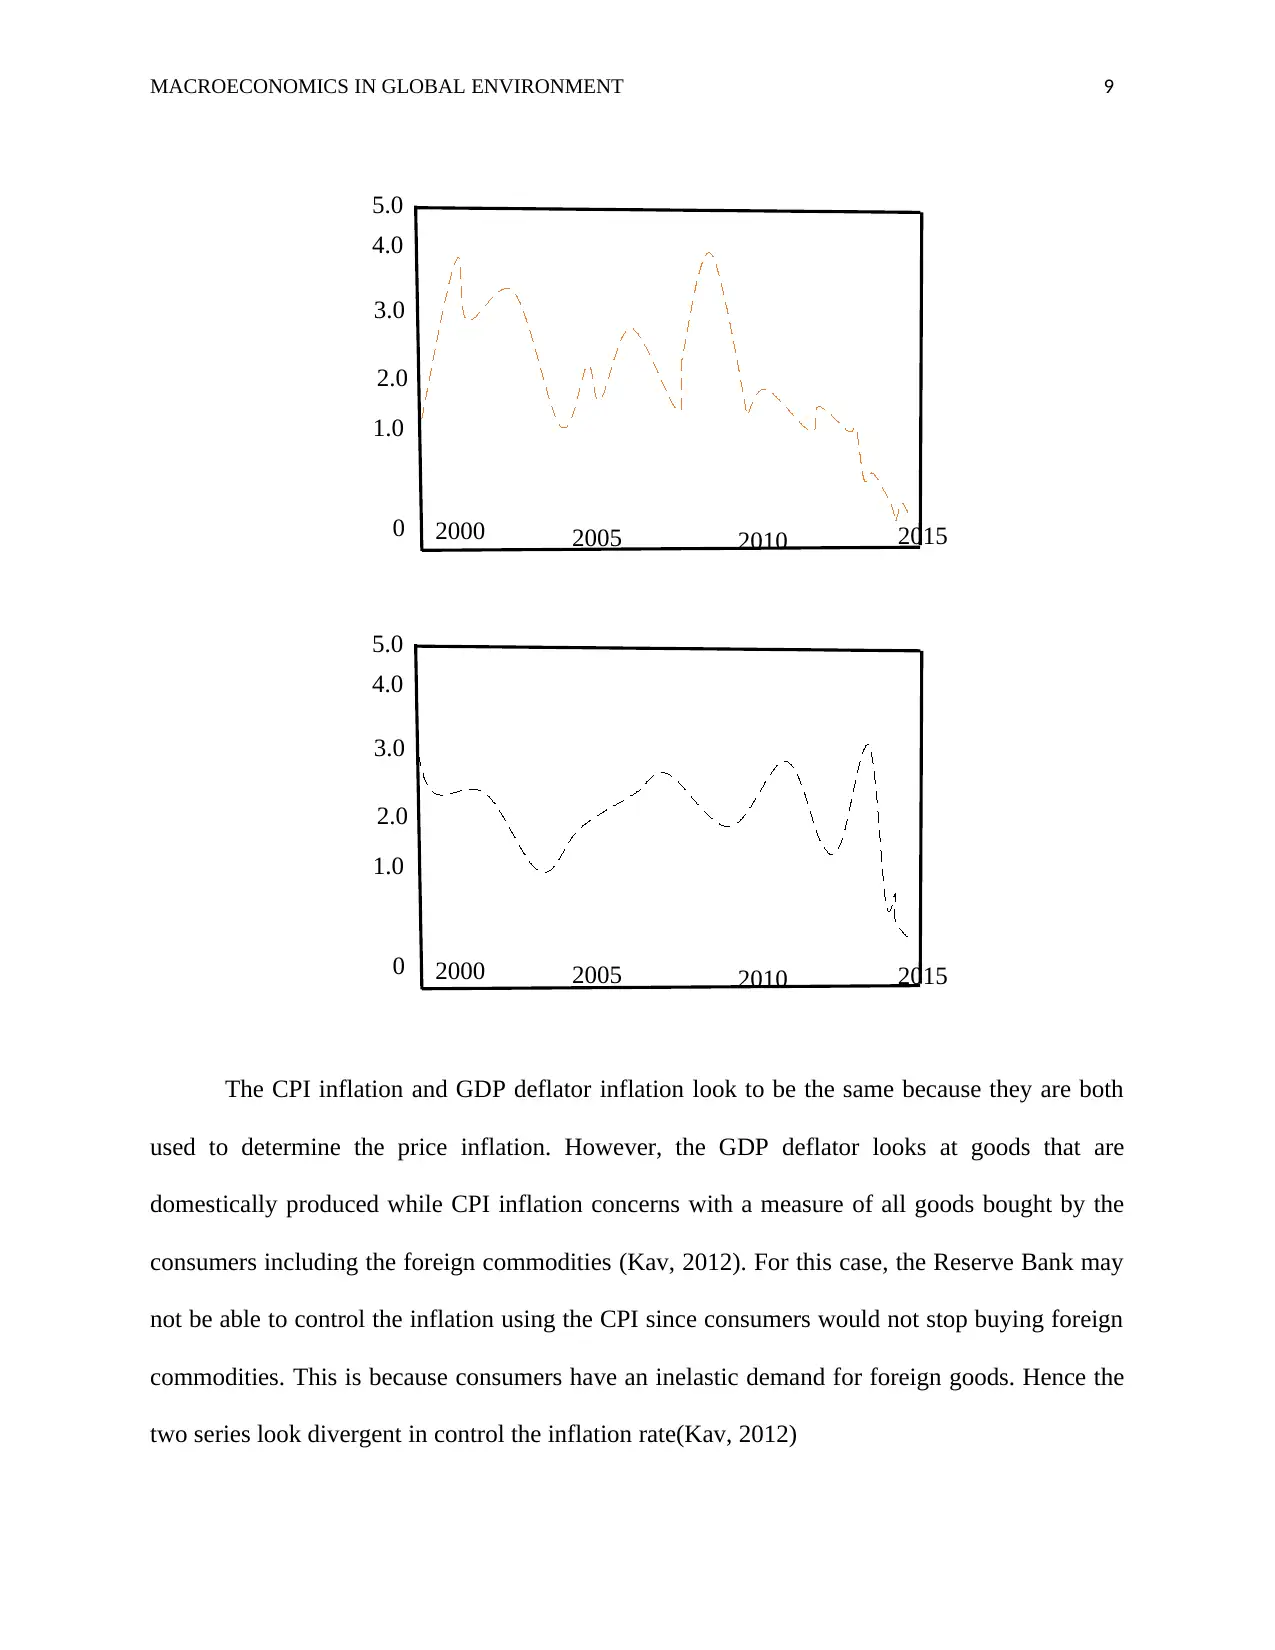
The graph shows inflation measured by GDP deflator and the CPI for New Zealand
from 2000 to 201 respectively.
has also increased the burdens in debt. Similarly, the cause could be the increasing import
demand that increases the profits for foreign companies.
Therefore, budget deficit is T- G, in the case where G>T
4019.00 – 11499.00 = $7480 as the budget deficit of New Zealand.The government debt
could have increased due to many reasons like poor financing of the initial debt and lack of
enough resources to pay back the loan.The government did not make any response in repaying
the initial loan but instead the debt increased which indicates lack of response by the government
(Kav, 2012).
Question 5.
The graph shows inflation measured by GDP deflator and the CPI for New Zealand
from 2000 to 201 respectively.
MACROECONOMICS IN GLOBAL ENVIRONMENT 9
The CPI inflation and GDP deflator inflation look to be the same because they are both
used to determine the price inflation. However, the GDP deflator looks at goods that are
domestically produced while CPI inflation concerns with a measure of all goods bought by the
consumers including the foreign commodities (Kav, 2012). For this case, the Reserve Bank may
not be able to control the inflation using the CPI since consumers would not stop buying foreign
commodities. This is because consumers have an inelastic demand for foreign goods. Hence the
two series look divergent in control the inflation rate(Kav, 2012)
1.0
2.0
3.0
4.0
5.0
201520102000 20050
1.0
2.0
3.0
4.0
5.0
201520102000 20050
⊘ This is a preview!⊘
Do you want full access?
Subscribe today to unlock all pages.
Trusted by 1+ million students worldwide
MACROECONOMICS IN GLOBAL ENVIRONMENT 10
References
Andrew Burns and John Baffes. (2018). Macroeconomic Environment, community markets: A
Longer-Term outlook. Expert Meeting on How to feed the world in 2050. Economic and
social development department. Retrieved from:
http://www.fao.org/3/a-ak967e.pdf
Sudiman Kav. (2012). How the Macroeconomic Environment and Investment Climate Have
Affected the Manufacturing Sector. Trade and Investment Climate. Kingdom of the
Netherlands. Retrieved from:
http://siteresources.worldbank.org/EASTASIAPACIFICEXT/Resources/226300-
1349835451376/Full-PN3-Manufacturing.pdf
1 out of 10
Your All-in-One AI-Powered Toolkit for Academic Success.
+13062052269
info@desklib.com
Available 24*7 on WhatsApp / Email
![[object Object]](/_next/static/media/star-bottom.7253800d.svg)
Unlock your academic potential
Copyright © 2020–2026 A2Z Services. All Rights Reserved. Developed and managed by ZUCOL.