Macroeconomics Project: Economic Analysis of Singapore (Q3 2016)
VerifiedAdded on 2019/09/16
|26
|3666
|327
Project
AI Summary
This macroeconomics project analyzes Singapore's economic performance in Q3 2016, focusing on the slowdown in GDP growth to 0.6%. The project examines key economic concepts such as aggregate expenditure, aggregate demand, aggregate supply, and fiscal policy, providing definitions and real-world examples. It explores the impact of factors like Brexit, manufacturing declines, and contractions in the construction and service sectors. The project also delves into the challenges of deflation and recession, including the role of unemployment and government intervention through fiscal policy. The project further discusses the Spanish economy and its monetary policies. The project concludes with an overview of the economic challenges and potential policy responses. The project utilizes data and analysis to provide insights into Singapore's economic situation and offers a valuable resource for students studying macroeconomics.
MACROECONOMICS PROJECT
Project Group Members:
Neville Derek Augustine
Amethyst Teo Min Qi
Nur Azzira Ashikin Binte Kasim
Nehal Elsayed Mohamed Ali Abdelrahman
Chan Kah Yee
Chan Oh Ching
Project Group Members:
Neville Derek Augustine
Amethyst Teo Min Qi
Nur Azzira Ashikin Binte Kasim
Nehal Elsayed Mohamed Ali Abdelrahman
Chan Kah Yee
Chan Oh Ching
Paraphrase This Document
Need a fresh take? Get an instant paraphrase of this document with our AI Paraphraser
MACROECONOMICS GROUP PROJECT
CONTENT
______________________________________________________________________________
ARTICLE 1 : Singapore’s Economic Growth Slows Sharply to 0.6% in Q3 3
Introduction 5
Definitions and Concepts 6
Analysis
Aggregate Expenditure 8
Aggregate Demand and Aggregate Supply 10
Fiscal Policy 12
Conclusion 13
ARTICLE 2 : Real World Shows Economies Has a Deflation Problem 14
Introduction 17
Definitions and Concepts 18
Analysis
Interest Rates 19
Inflation / Deflation 20
Government Spending 22
Unemployment 23
Conclusion 25
-----------------------------------------------------------------------------------------------------------------------------------
Reference list 26
Page 2 of 26
Project Group Members:
Neville Derek Augustine Nur Azzira Ashikin Binte Kasim Chan Kah Yee
Amethyst Teo Min Qi Nehal Elsayed Mohamed Ali Abdelrahman Chan Oh Ching
MACROECONOMICS GROUP PROJECT
Page 3 of 26
Project Group Members:
Neville Derek Augustine Nur Azzira Ashikin Binte Kasim Chan Kah Yee
Amethyst Teo Min Qi Nehal Elsayed Mohamed Ali Abdelrahman Chan Oh Ching
Page 3 of 26
Project Group Members:
Neville Derek Augustine Nur Azzira Ashikin Binte Kasim Chan Kah Yee
Amethyst Teo Min Qi Nehal Elsayed Mohamed Ali Abdelrahman Chan Oh Ching
⊘ This is a preview!⊘
Do you want full access?
Subscribe today to unlock all pages.
Trusted by 1+ million students worldwide
MACROECONOMICS GROUP PROJECT
Page 4 of 26
Project Group Members:
Neville Derek Augustine Nur Azzira Ashikin Binte Kasim Chan Kah Yee
Amethyst Teo Min Qi Nehal Elsayed Mohamed Ali Abdelrahman Chan Oh Ching
Page 4 of 26
Project Group Members:
Neville Derek Augustine Nur Azzira Ashikin Binte Kasim Chan Kah Yee
Amethyst Teo Min Qi Nehal Elsayed Mohamed Ali Abdelrahman Chan Oh Ching
Paraphrase This Document
Need a fresh take? Get an instant paraphrase of this document with our AI Paraphraser
MACROECONOMICS GROUP PROJECT
INTRODUCTION
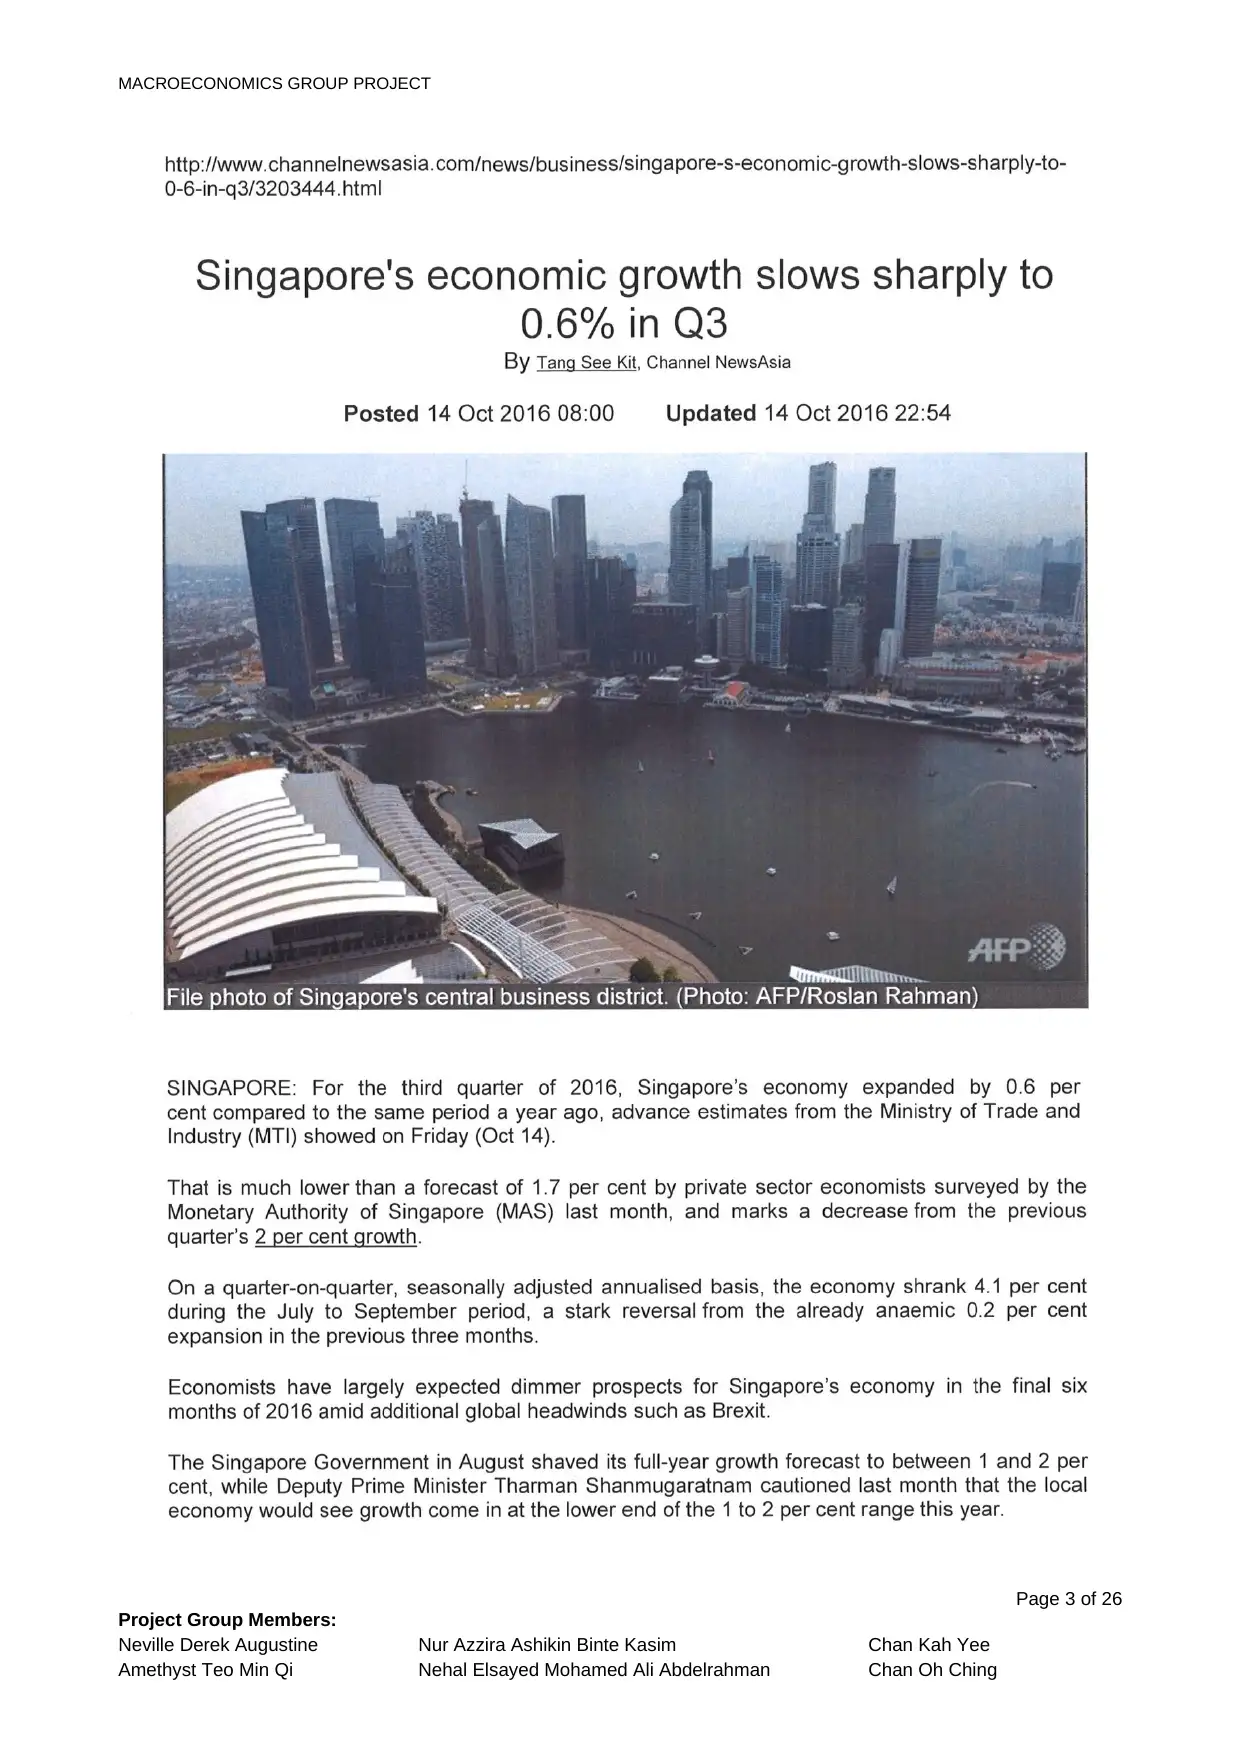
Article: Singapore’s Economic Growth slows sharply to 0.6% in Q3
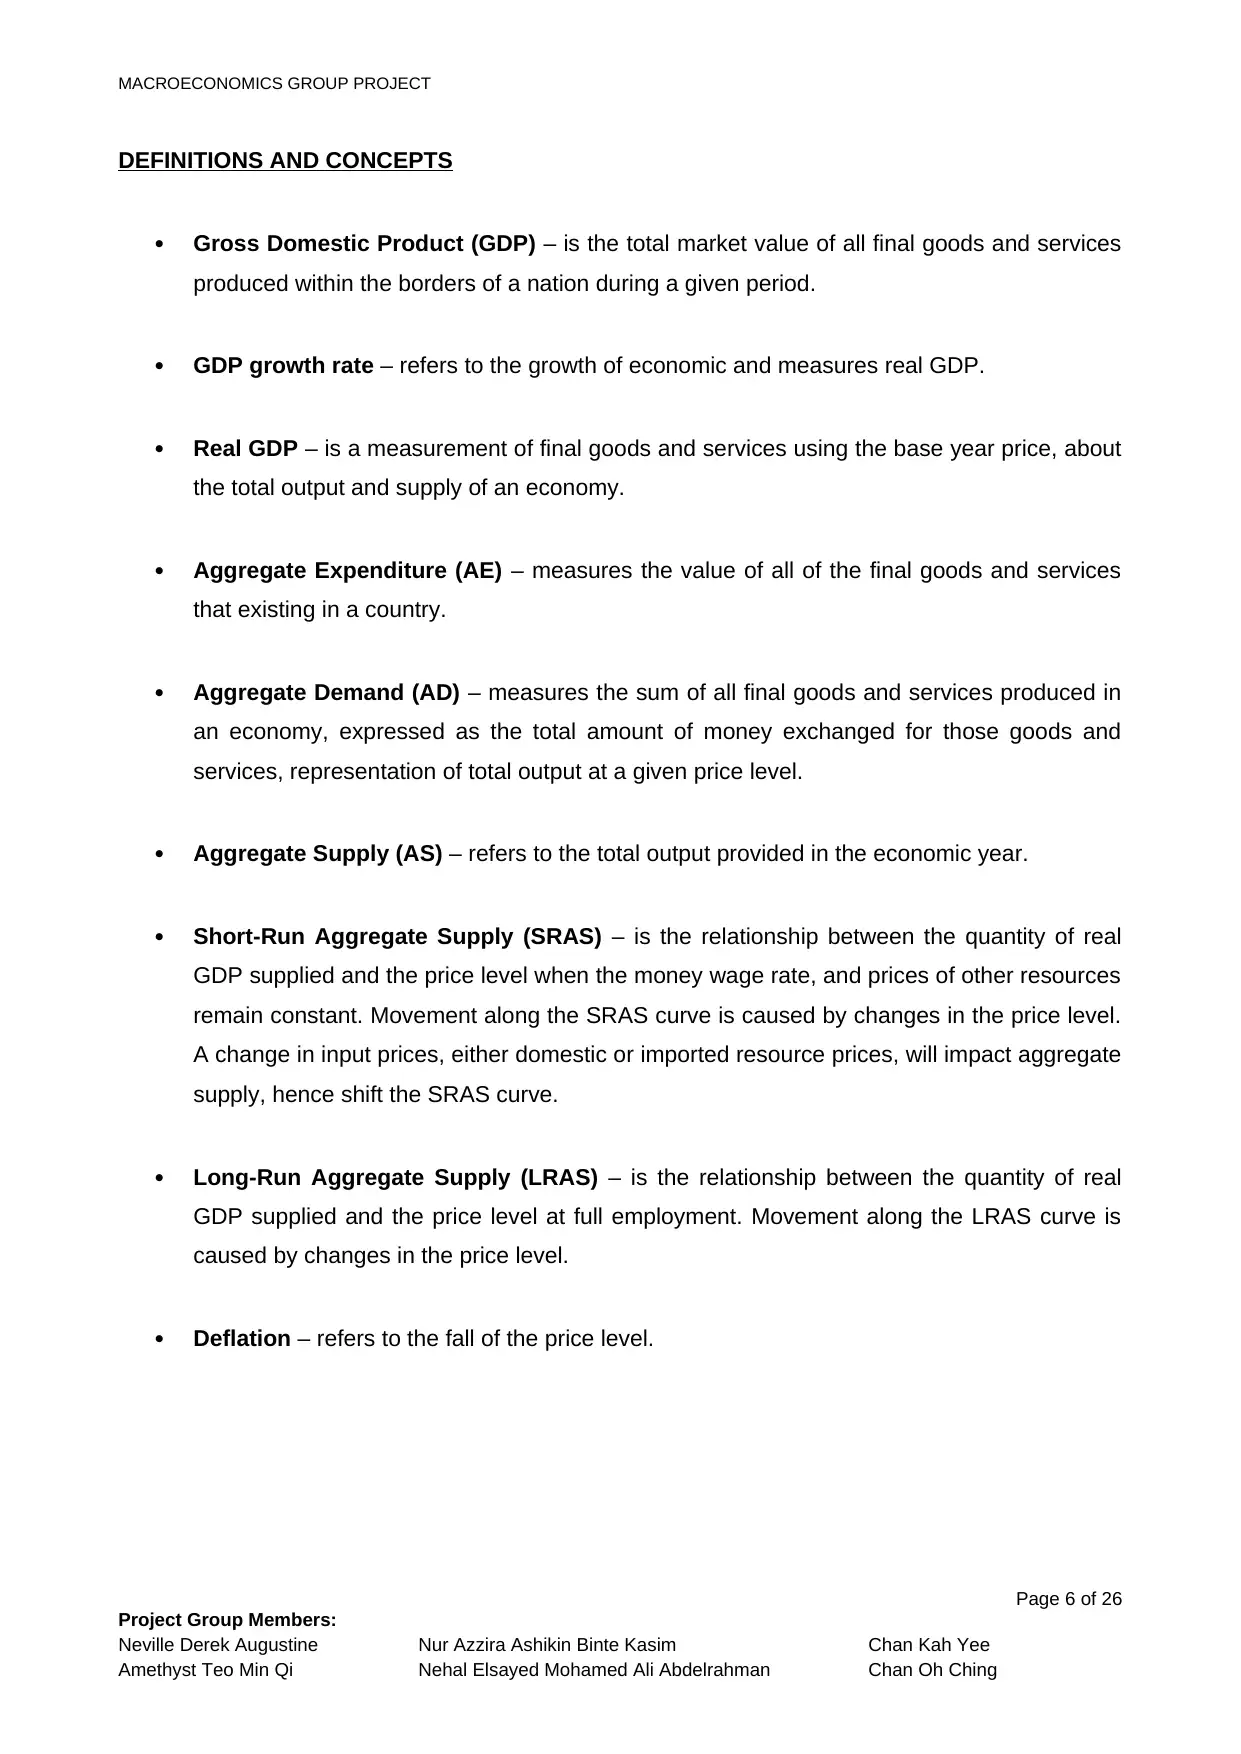
It was reported that Singapore GDP have declining to 0.6% in Q3 FY2016, in comparison to 1.8%
in Q3 the previous year. It was significantly weaker, if not the weakest growth in seven years than
the predicted rate of 1.7% forecast by the economists surveyed.
Reasons contributing to a slower Singapore economic growth are;
manufacturers decline in output;
contraction in private sector construction and;
continuous drop in service segment from beginning of the year.
The continuous decline of services segment, also the largest sector of the economy, has proven
recession is ingrained in Singapore’s economy. Additionally with weak indicators from the external
environment growth, we are likely to face minimal growth rate in 2017. (Husna, 2016)
Page 5 of 26
Project Group Members:
Neville Derek Augustine Nur Azzira Ashikin Binte Kasim Chan Kah Yee
Amethyst Teo Min Qi Nehal Elsayed Mohamed Ali Abdelrahman Chan Oh Ching
INTRODUCTION
Article: Singapore’s Economic Growth slows sharply to 0.6% in Q3
It was reported that Singapore GDP have declining to 0.6% in Q3 FY2016, in comparison to 1.8%
in Q3 the previous year. It was significantly weaker, if not the weakest growth in seven years than
the predicted rate of 1.7% forecast by the economists surveyed.
Reasons contributing to a slower Singapore economic growth are;
manufacturers decline in output;
contraction in private sector construction and;
continuous drop in service segment from beginning of the year.
The continuous decline of services segment, also the largest sector of the economy, has proven
recession is ingrained in Singapore’s economy. Additionally with weak indicators from the external
environment growth, we are likely to face minimal growth rate in 2017. (Husna, 2016)
Page 5 of 26
Project Group Members:
Neville Derek Augustine Nur Azzira Ashikin Binte Kasim Chan Kah Yee
Amethyst Teo Min Qi Nehal Elsayed Mohamed Ali Abdelrahman Chan Oh Ching
MACROECONOMICS GROUP PROJECT
DEFINITIONS AND CONCEPTS
Gross Domestic Product (GDP) – is the total market value of all final goods and services
produced within the borders of a nation during a given period.
GDP growth rate – refers to the growth of economic and measures real GDP.
Real GDP – is a measurement of final goods and services using the base year price, about
the total output and supply of an economy.
Aggregate Expenditure (AE) – measures the value of all of the final goods and services
that existing in a country.
Aggregate Demand (AD) – measures the sum of all final goods and services produced in
an economy, expressed as the total amount of money exchanged for those goods and
services, representation of total output at a given price level.
Aggregate Supply (AS) – refers to the total output provided in the economic year.
Short-Run Aggregate Supply (SRAS) – is the relationship between the quantity of real
GDP supplied and the price level when the money wage rate, and prices of other resources
remain constant. Movement along the SRAS curve is caused by changes in the price level.
A change in input prices, either domestic or imported resource prices, will impact aggregate
supply, hence shift the SRAS curve.
Long-Run Aggregate Supply (LRAS) – is the relationship between the quantity of real
GDP supplied and the price level at full employment. Movement along the LRAS curve is
caused by changes in the price level.
Deflation – refers to the fall of the price level.
Page 6 of 26
Project Group Members:
Neville Derek Augustine Nur Azzira Ashikin Binte Kasim Chan Kah Yee
Amethyst Teo Min Qi Nehal Elsayed Mohamed Ali Abdelrahman Chan Oh Ching
⊘ This is a preview!⊘
Do you want full access?
Subscribe today to unlock all pages.
Trusted by 1+ million students worldwide
MACROECONOMICS GROUP PROJECT
Recession – relates to any fall in economic growth for more than two fiscal quarters
measure by the Real GDP.
Unemployment – refers to the percentage of the total workforce unemployed but ready to
work and actively look for jobs.
Fiscal Policy – is used to increase economic growth and push the unemployment rate
down by controlling inflation through the government spending and taxes.
Expansionary Fiscal Policy – is used to increase inflation by creating a budget surplus
through increasing government spending and decreasing tax.
Automatic Stabilizers – is a tool that despite no policy action by the government will
decrease the rate of fluctuation in real GDP.
(Investopedia, 2016)
Page 7 of 26
Project Group Members:
Neville Derek Augustine Nur Azzira Ashikin Binte Kasim Chan Kah Yee
Amethyst Teo Min Qi Nehal Elsayed Mohamed Ali Abdelrahman Chan Oh Ching
Paraphrase This Document
Need a fresh take? Get an instant paraphrase of this document with our AI Paraphraser
MACROECONOMICS GROUP PROJECT
ANALYSIS
Aggregate Expenditure
Aggregate Expenditure (AE) is one of the method that to use to measure the total economic
activities in a country. It also known as Gross Domestic Product (GDP)
AE and GDP both function of Consumption (C), Investment (I), Government Expenditure (G), Net
Export (X – M).
Following will be the calculation of GDP and AE:
GDP = AE = C + I + G + X – M
As mentioned in the article, experts have expected a gloomy prospect of Singapore economy in
the 3rd and 4th quarter of 2016 amid additional global headwinds such as British exit from Europe,
also known as Brexit.
With the exit of British from Europe, it will eventually result in a huge impact on the world’s
economy. The Pound Sterling exchange rate is depreciating. When the UK exchange rate
depreciated, the value of Pound Sterling is weaker against Singapore Dollars. UK will cut down
their import goods from Singapore. Therefore, when Pound Sterling decreased, it will cause a fall
in Singapore export factor. (GRACE LEONG 2016)
When there is a fall in export, AE will drop and Real GDP will go down
AE = C + I + G + X – M
Export ↓
AE ↓ (AE curve shifts downwards)
Real GDP ↓
Page 8 of 26
Project Group Members:
Neville Derek Augustine Nur Azzira Ashikin Binte Kasim Chan Kah Yee
Amethyst Teo Min Qi Nehal Elsayed Mohamed Ali Abdelrahman Chan Oh Ching
MACROECONOMICS GROUP PROJECT
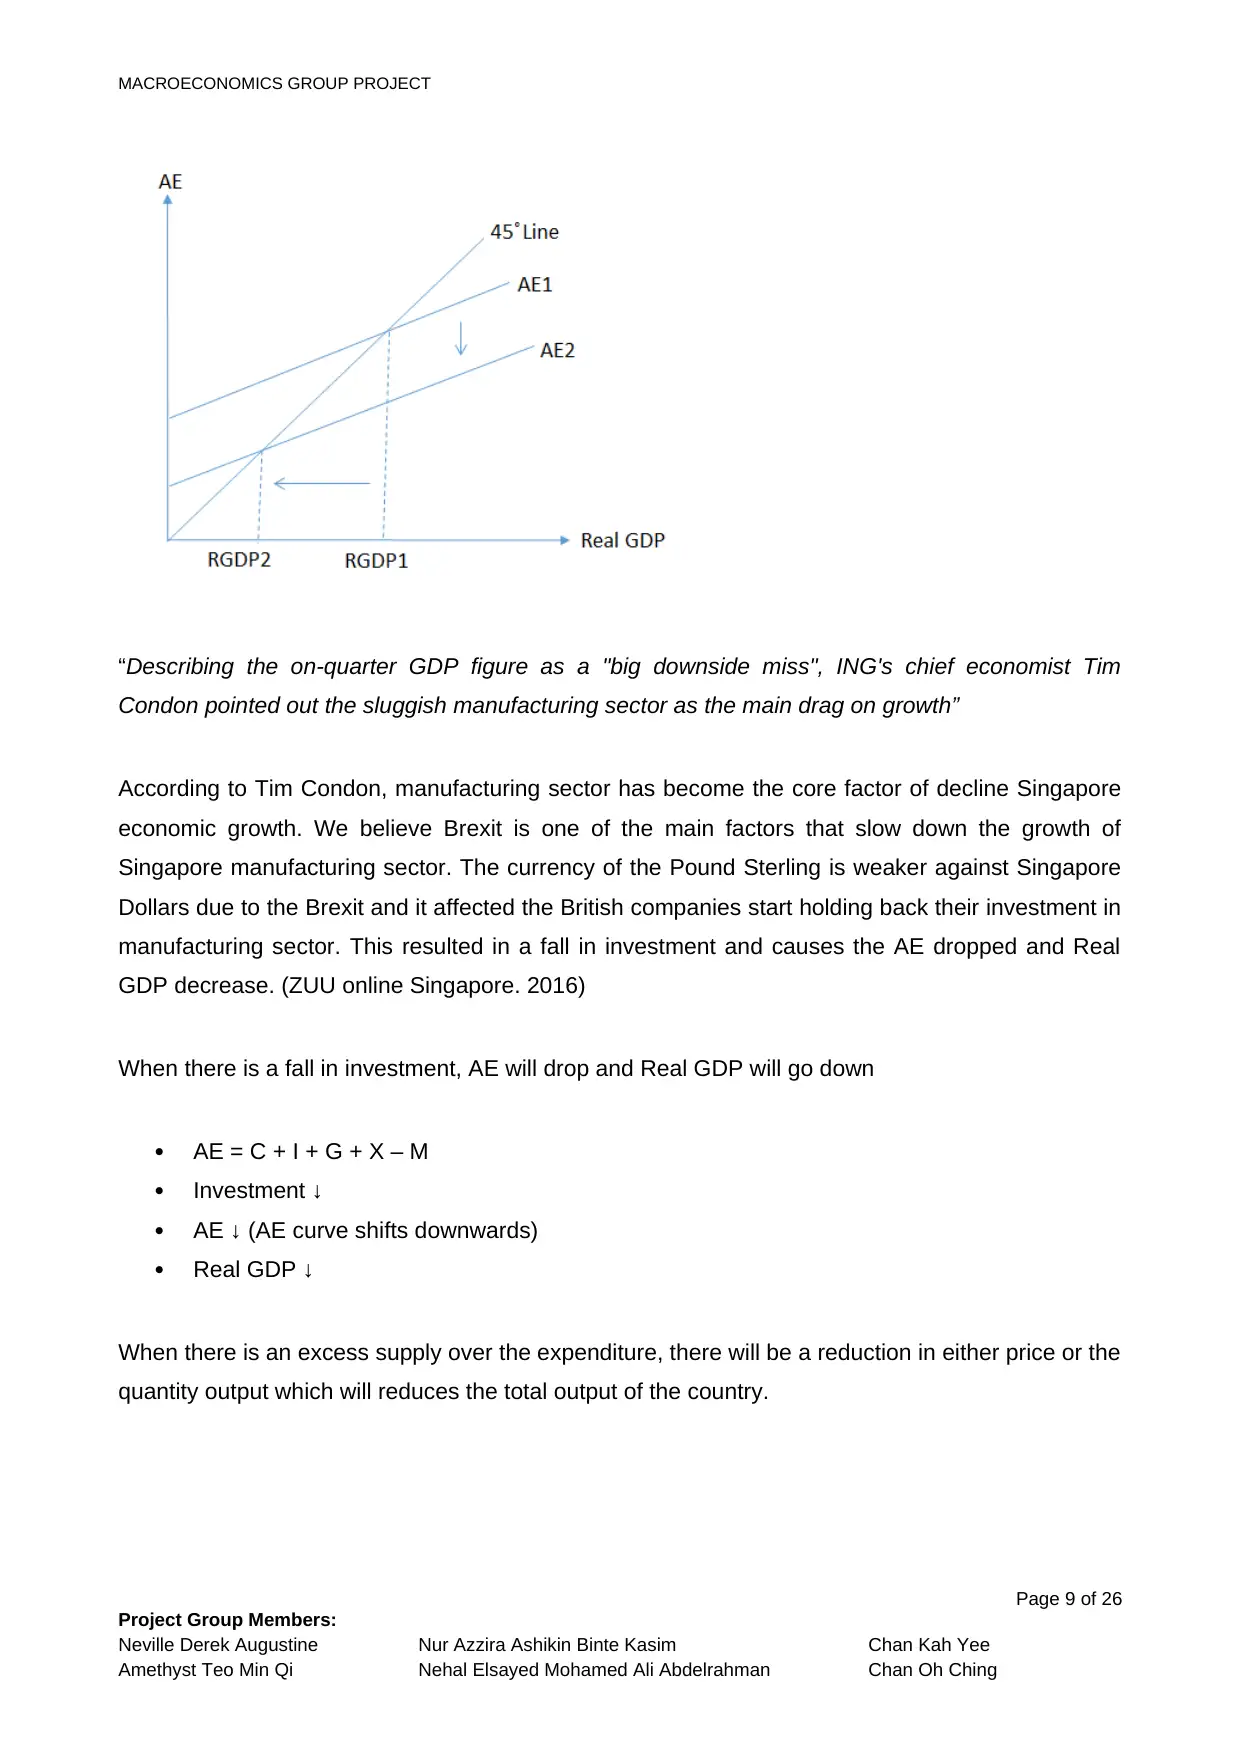
“Describing the on-quarter GDP figure as a "big downside miss", ING's chief economist Tim
Condon pointed out the sluggish manufacturing sector as the main drag on growth”
According to Tim Condon, manufacturing sector has become the core factor of decline Singapore
economic growth. We believe Brexit is one of the main factors that slow down the growth of
Singapore manufacturing sector. The currency of the Pound Sterling is weaker against Singapore
Dollars due to the Brexit and it affected the British companies start holding back their investment in
manufacturing sector. This resulted in a fall in investment and causes the AE dropped and Real
GDP decrease. (ZUU online Singapore. 2016)
When there is a fall in investment, AE will drop and Real GDP will go down
AE = C + I + G + X – M
Investment ↓
AE ↓ (AE curve shifts downwards)
Real GDP ↓
When there is an excess supply over the expenditure, there will be a reduction in either price or the
quantity output which will reduces the total output of the country.
Page 9 of 26
Project Group Members:
Neville Derek Augustine Nur Azzira Ashikin Binte Kasim Chan Kah Yee
Amethyst Teo Min Qi Nehal Elsayed Mohamed Ali Abdelrahman Chan Oh Ching
⊘ This is a preview!⊘
Do you want full access?
Subscribe today to unlock all pages.
Trusted by 1+ million students worldwide
MACROECONOMICS GROUP PROJECT
Aggregate Demand and Aggregate Supply
The main drag on Singapore’s economic growth is a downturn in manufacturing sector.
“Manufacturing activity plunged 1.1 per cent over the same period last year, reversing from the 1.4
per cent expansion in the previous quarter”. The transport engineering, biomedical manufacturing
and general manufacturing clusters output decline has dragged down this sector. Uncertain global
financial markets and weak global demand has resulted in manufacturing contraction in Singapore.
It has a direct impact on the decline in Singapore's exports. When overseas demand weakens,
Singapore's exports fall, aggregate demand and real GDP will decline. Insufficient demand will
lead to a decrease in productivity. Subsequently, businesses will implement cost reduction and
layoffs to sustain their operations.
Manufacturing Sector Downturn
AD = C + I + G + X - M
Exports ↓
AD ↓ (AD curve shifts leftwards)
Price Level ↓ (Deflation)
Real GDP ↓ (Recession, High Unemployment)
“The construction sector slowed marginally to 2.5 per cent growth on a year-on-year basis in the
third quarter, compared to 2.6 per cent in the previous quarter”. This was mainly due to a
significant reduction in private sector construction activities. When the global economy is unstable,
the construction sector has also been hit. People are more cautious about spending money on
property and investment. Businesses stop expanding and reduce their investment and borrowing,
this will affect the decline in corporate bank loans. Some businesses suffered loss of profits or
even shut down. When investment is reduced, aggregate demand and real GDP will decline.
Furthermore, people will face a lack of employment opportunities.
Construction Sector Slowdown
AD = C + I + G + X - M
Investment ↓
AD ↓ (AD curve shifts leftwards)
Price Level ↓ (Deflation)
Real GDP ↓ (Recession, High Unemployment)
Page 10 of 26
Project Group Members:
Neville Derek Augustine Nur Azzira Ashikin Binte Kasim Chan Kah Yee
Amethyst Teo Min Qi Nehal Elsayed Mohamed Ali Abdelrahman Chan Oh Ching
Paraphrase This Document
Need a fresh take? Get an instant paraphrase of this document with our AI Paraphraser
MACROECONOMICS GROUP PROJECT
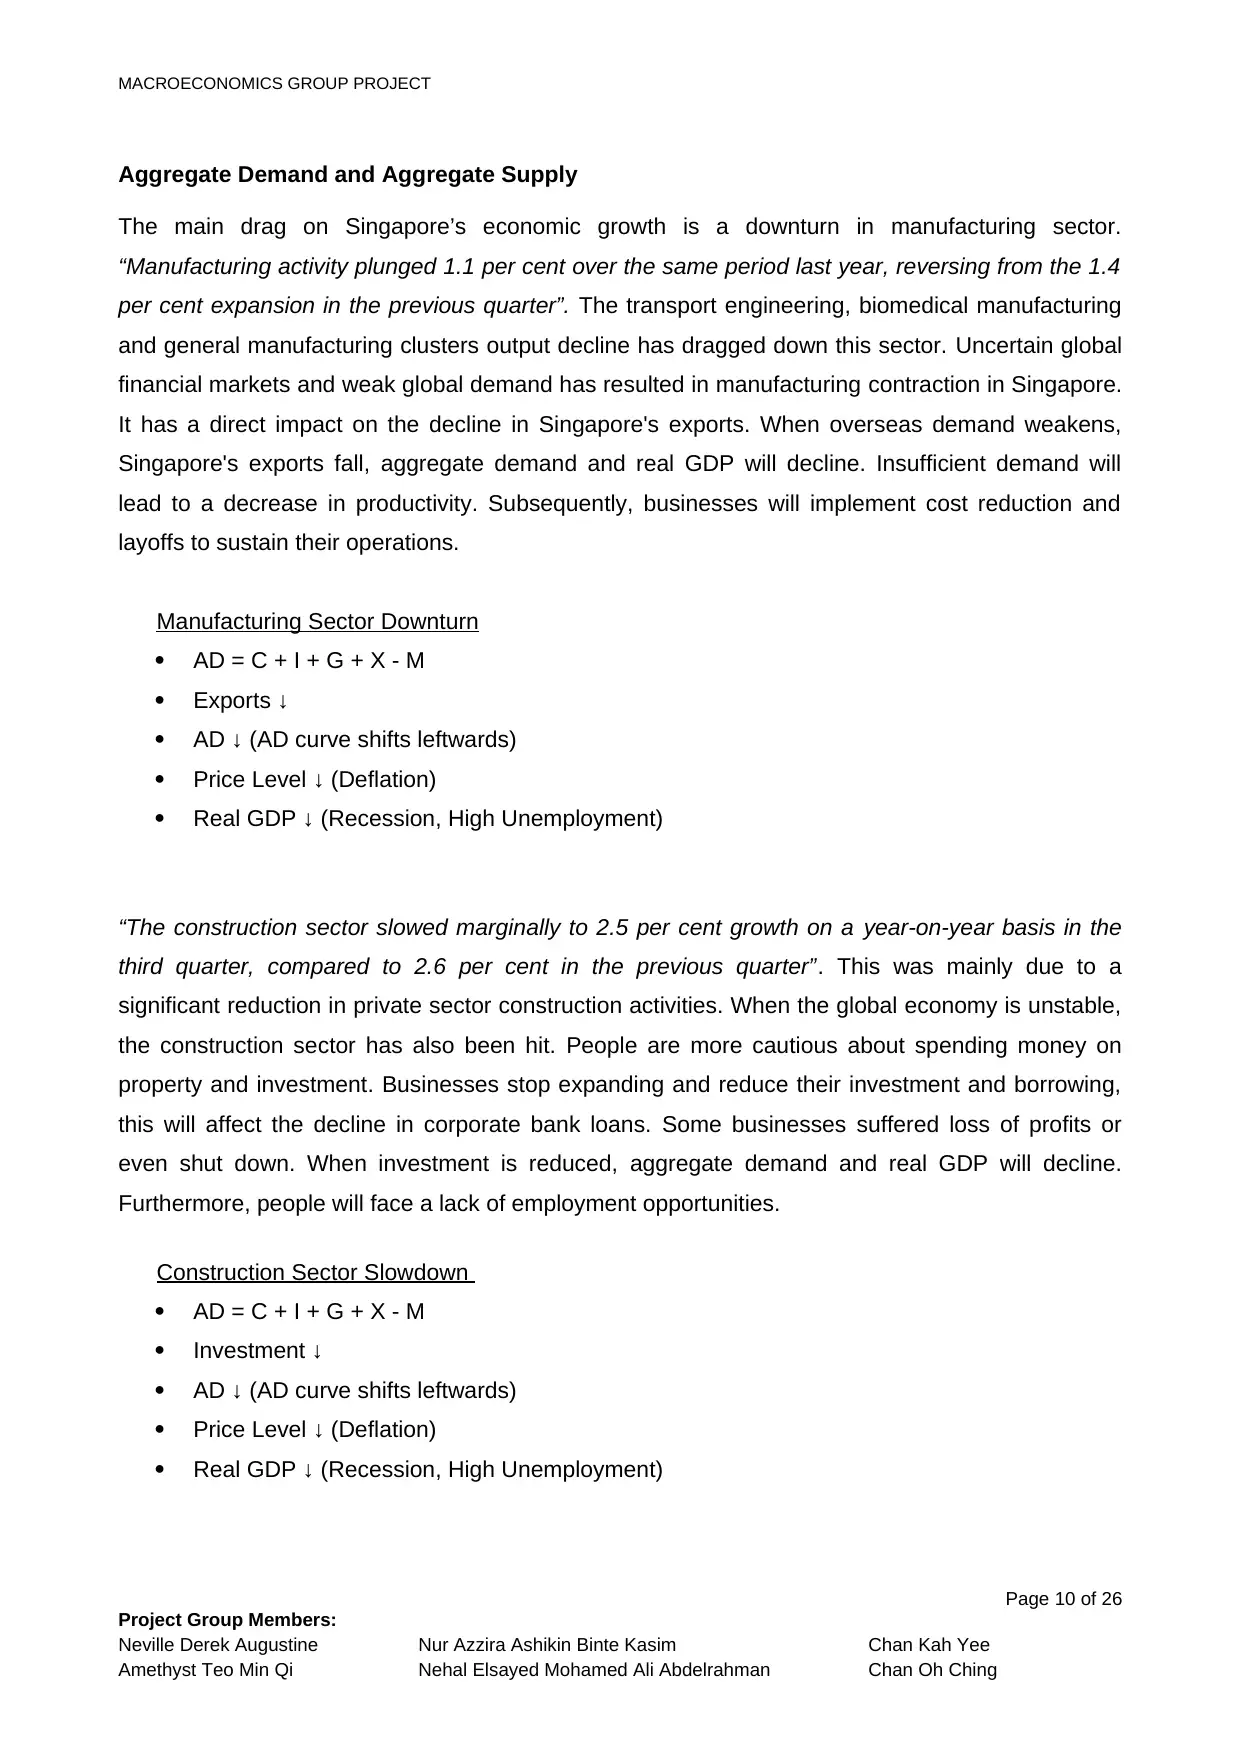
“Meanwhile, the services producing industries recorded a slight contraction of 0.1 per cent, a
reversal from the 1.2 per cent expansion in the preceding quarter, pulled down primarily by a
contraction in the wholesale and retail trade sector”. In order to overcome the financial crisis, firms
in hardest-hit sectors have had to cut down its operating costs by reducing manpower. By then
Singapore’s total employment rate will contract and unemployment will rise. This will have a
negative impact on the retail sector. When people's income is reduced, their purchasing power
decreases, consumption and aggregate demand will fall, and then the real GDP will decline. The
shrinking of the retail sector reflects a fall in consumer confidence and lead to a recession in
Singapore. (REACH Singapore. 2016)
Retail Sector Contraction
AD = C + I + G + X - M
Consumption ↓
AD ↓ (AD curve shifts leftwards)
Price Level ↓ (Deflation)
Real GDP ↓ (Recession, High Unemployment)
Page 11 of 26
Project Group Members:
Neville Derek Augustine Nur Azzira Ashikin Binte Kasim Chan Kah Yee
Amethyst Teo Min Qi Nehal Elsayed Mohamed Ali Abdelrahman Chan Oh Ching
MACROECONOMICS GROUP PROJECT
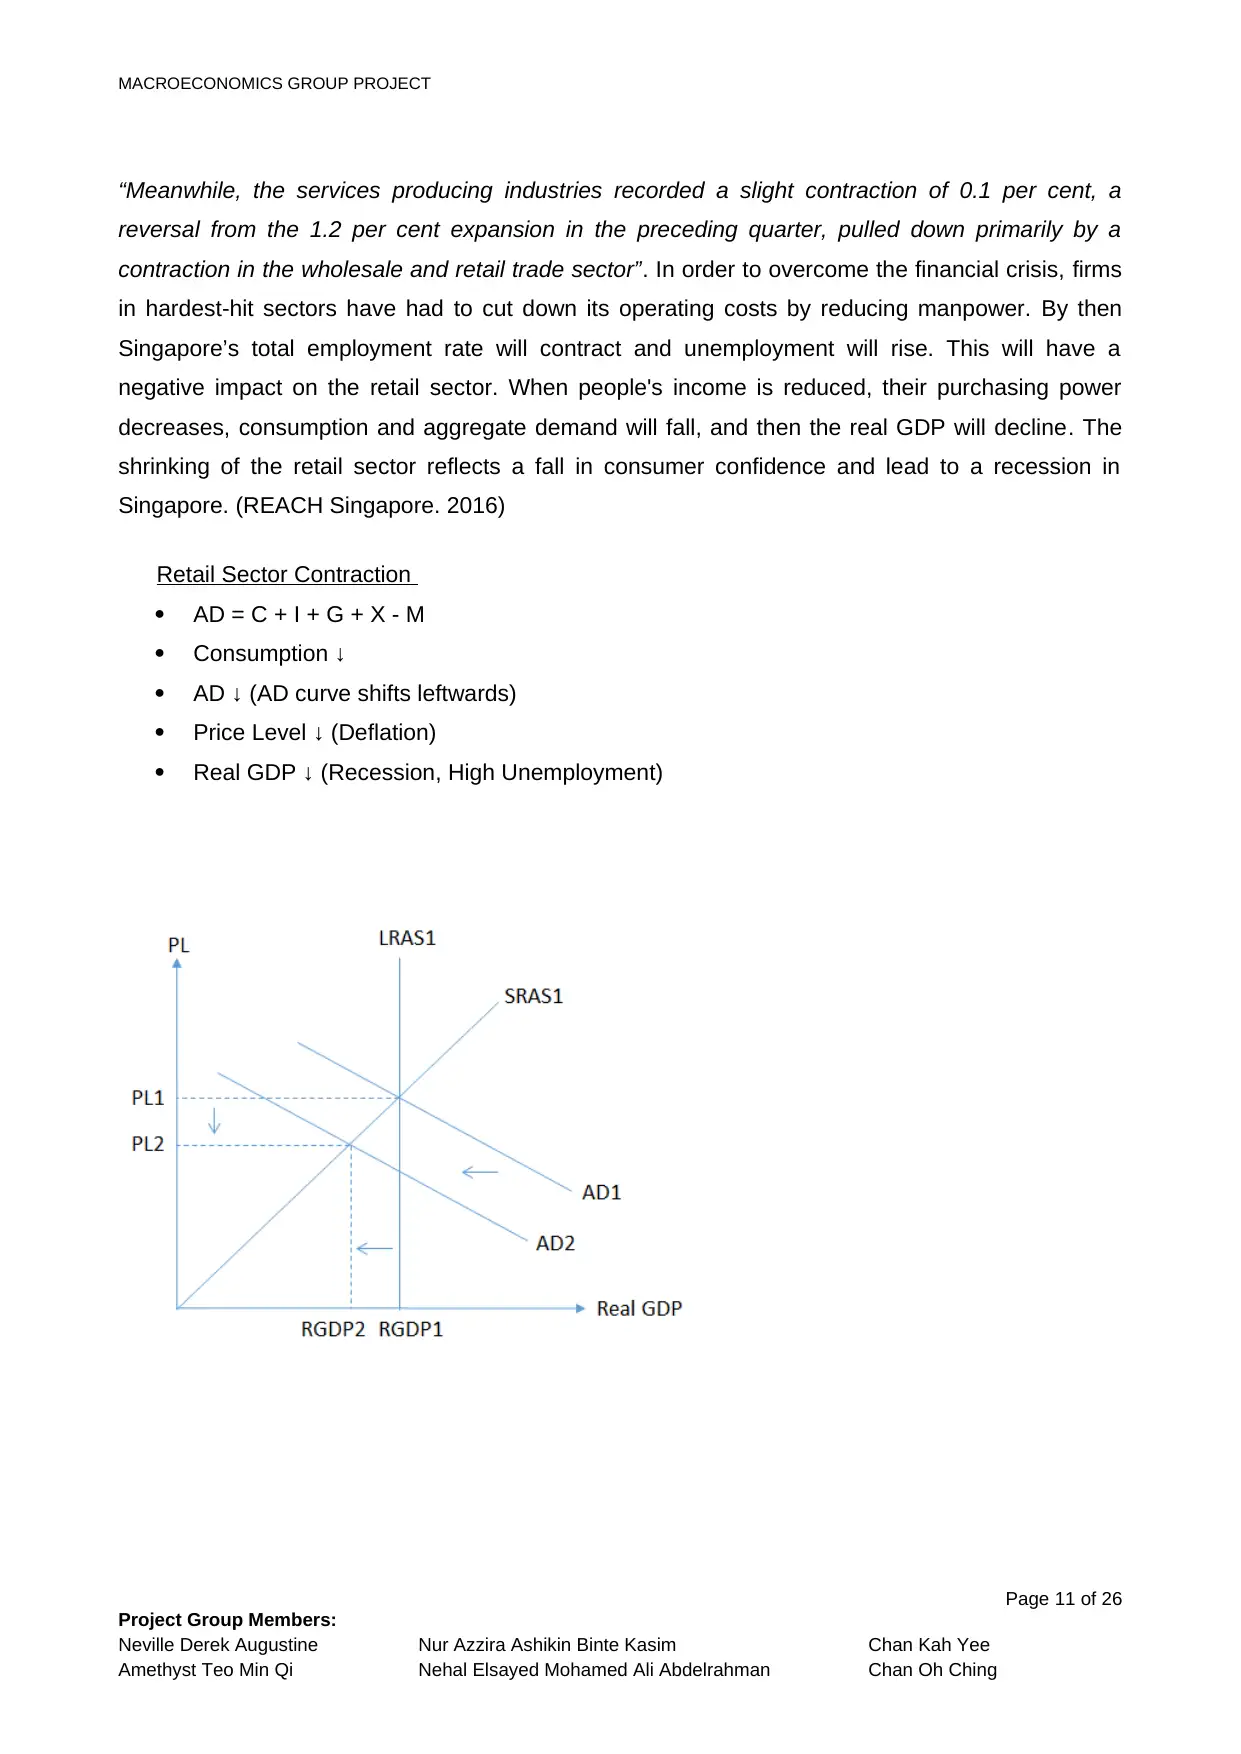
Fiscal Policy
In a recession, Singapore government can implement expansionary fiscal policy, which includes
increase government spending and/or decrease taxes to reduce unemployment and help the
economy out of recession. (investopedia. 2016)
The government can spend more on infrastructure spending by building transportation and
communications systems, and public institutions e.g. schools, post offices, prisons and so
forth. When government spending increases, aggregate demand will also increase, this will help to
create jobs and wages, and reduce cyclical unemployment.
At the same time, the government may reduce corporate income tax and personal income tax to
boost spending. When the corporate income tax rate is low, firms are confident that there are more
profit margins to expand their business and investment. By then, people will have more jobs and
overall employment rate will rise. Business expansion and investment will directly drive economic
growth. (economicshelp. 2016)
Lowering personal income tax may increase consumers spending. When people are paying less in
taxes, they have more disposable income to consume and invest. When the consumer's
consumption level is high, aggregate demand and real GDP will increase, this may lead to higher
economic growth.
Expansionary Fiscal Policy
Page 12 of 26
Project Group Members:
Neville Derek Augustine Nur Azzira Ashikin Binte Kasim Chan Kah Yee
Amethyst Teo Min Qi Nehal Elsayed Mohamed Ali Abdelrahman Chan Oh Ching
⊘ This is a preview!⊘
Do you want full access?
Subscribe today to unlock all pages.
Trusted by 1+ million students worldwide
1 out of 26
Related Documents


Your All-in-One AI-Powered Toolkit for Academic Success.
+13062052269
info@desklib.com
Available 24*7 on WhatsApp / Email
![[object Object]](/_next/static/media/star-bottom.7253800d.svg)
Unlock your academic potential
Copyright © 2020–2026 A2Z Services. All Rights Reserved. Developed and managed by ZUCOL.