University of Maryland Global Campus Macroeconomics GDP Report
VerifiedAdded on 2022/08/22
|12
|1603
|20
Report
AI Summary
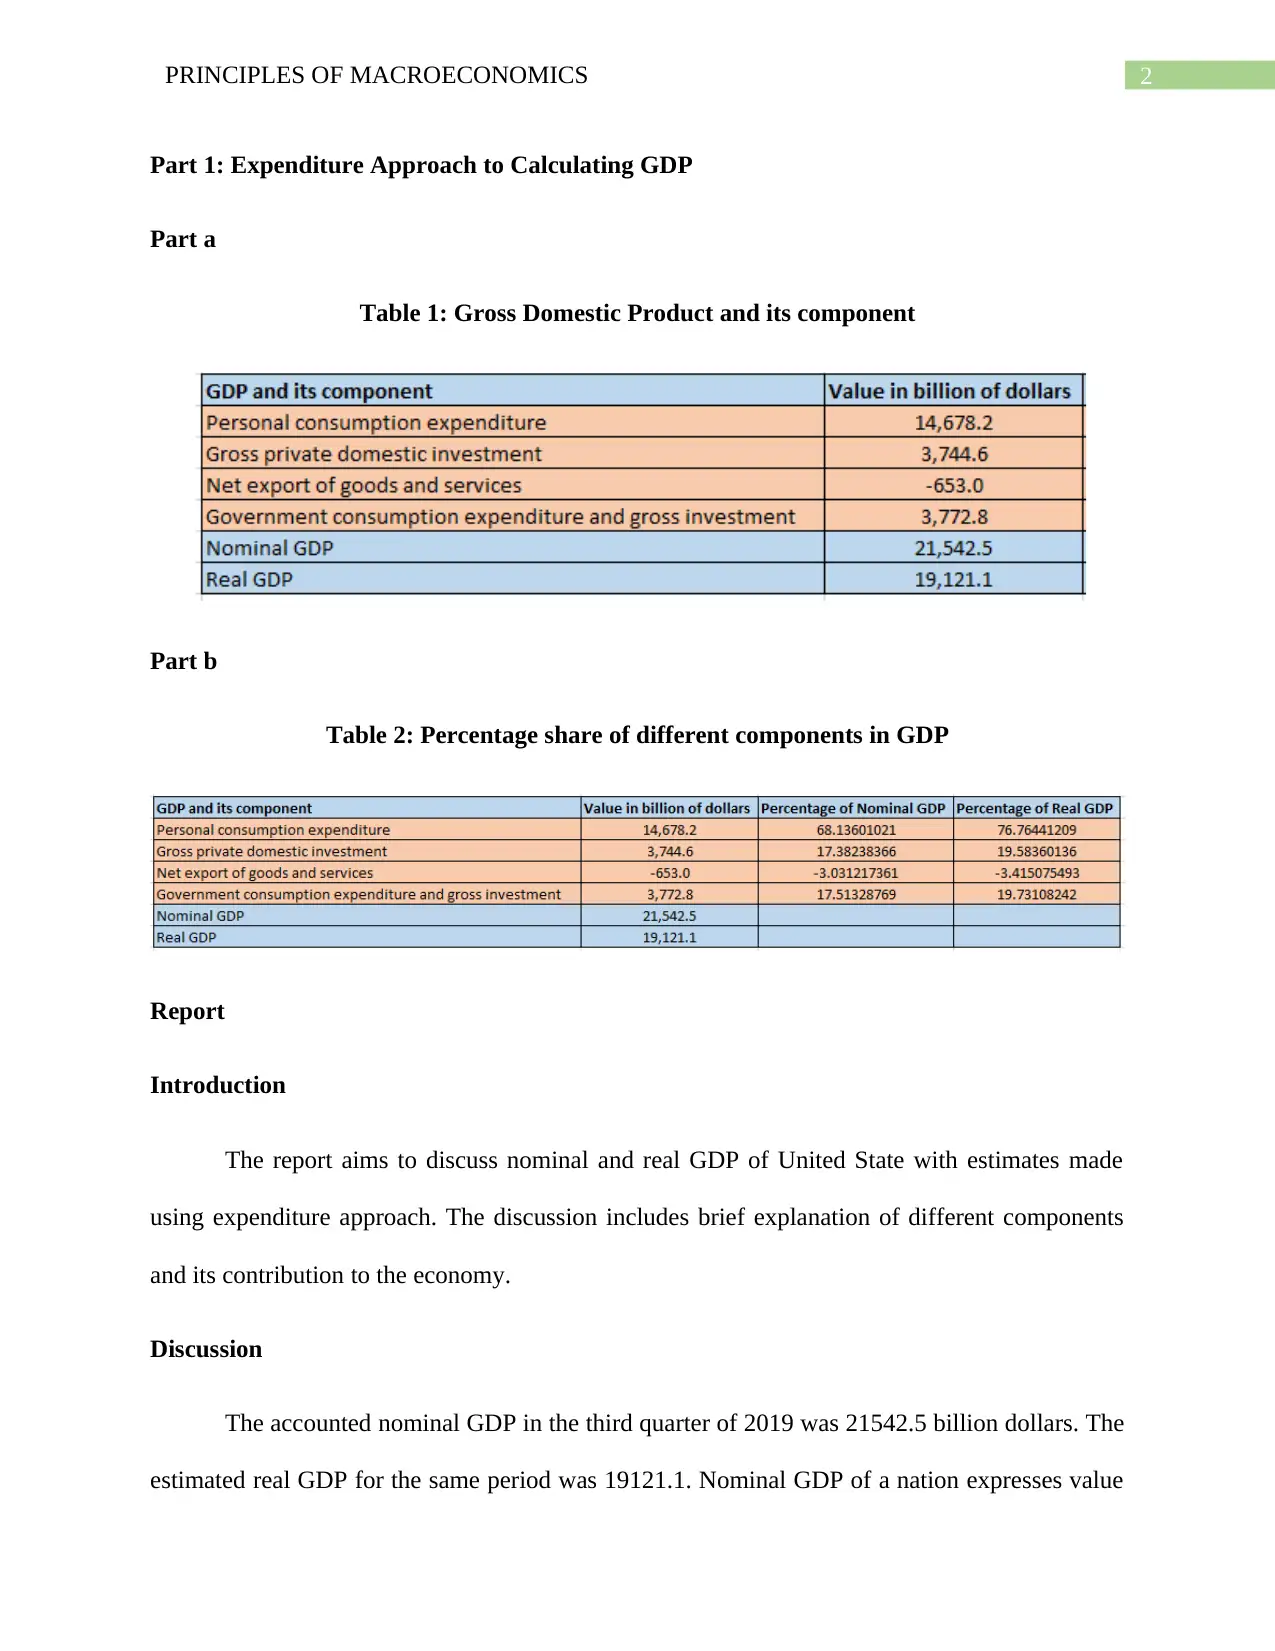
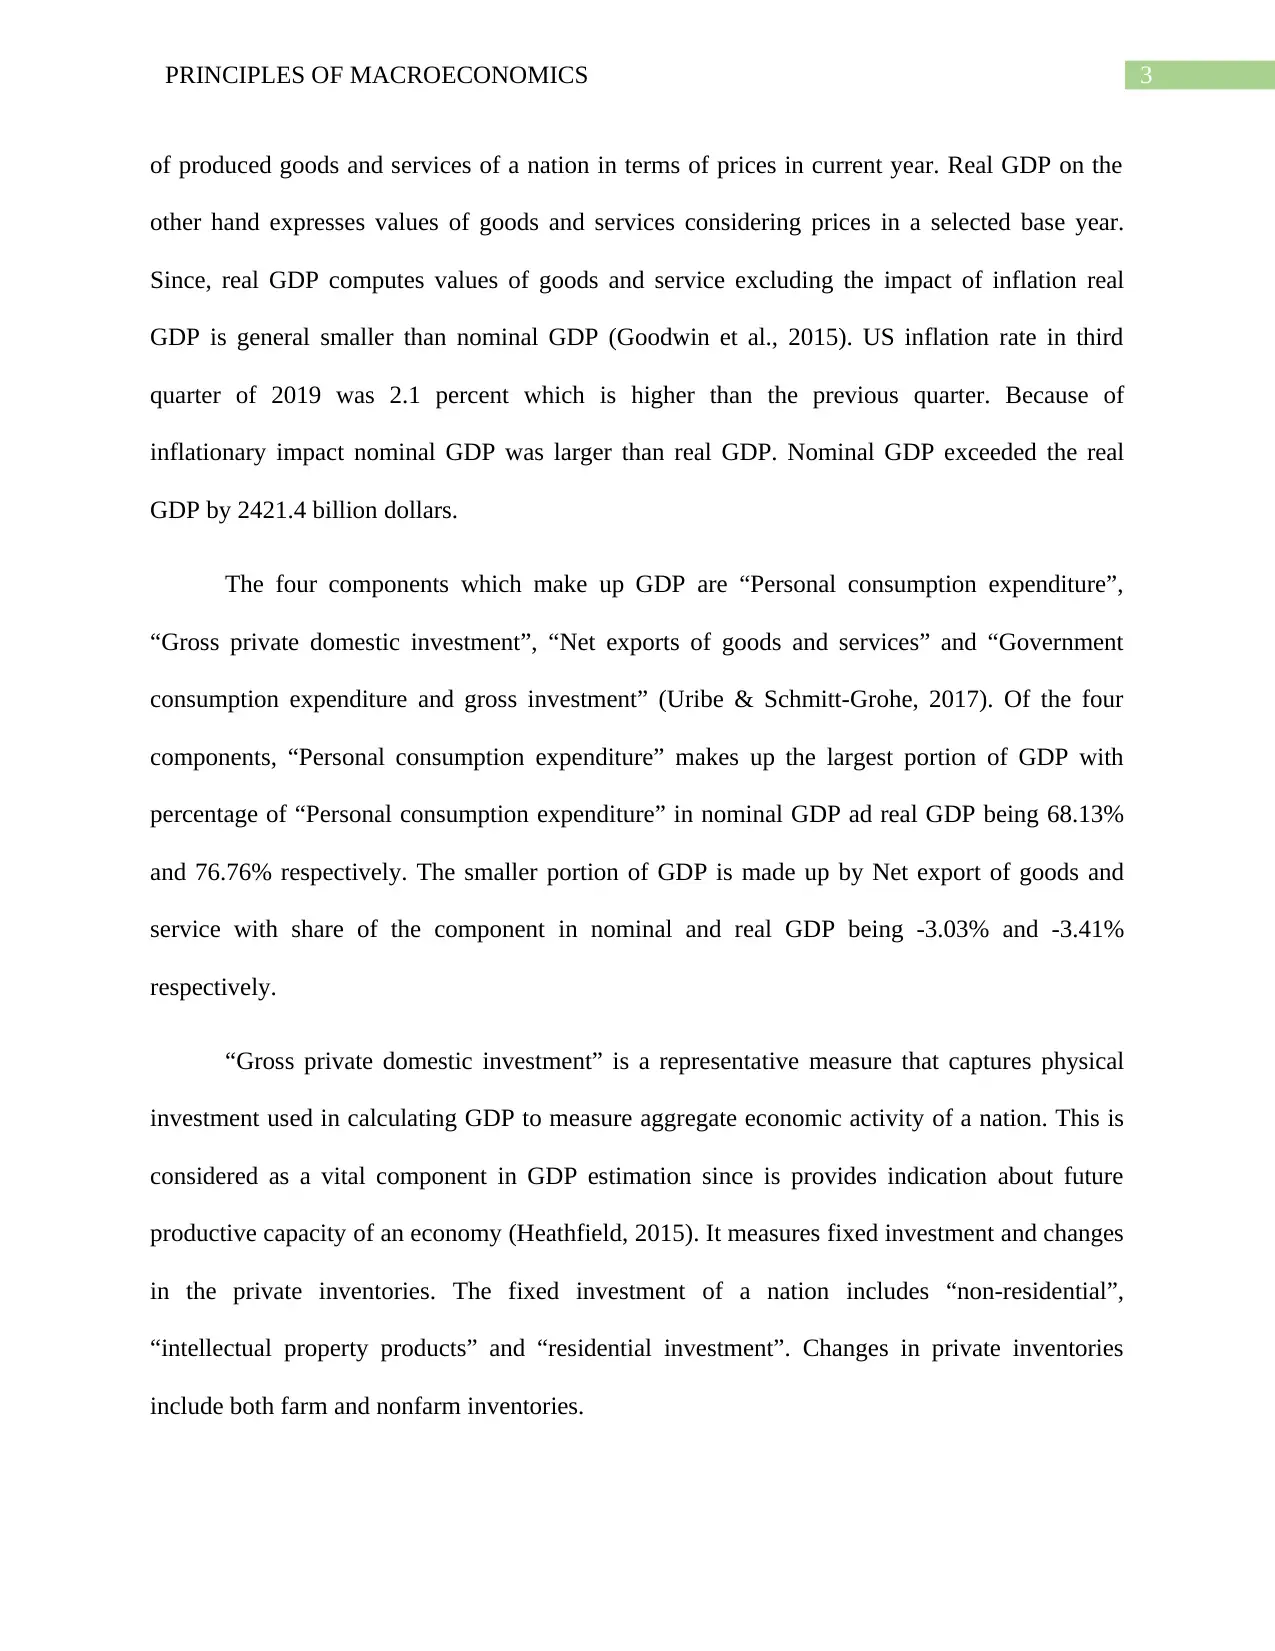
This report provides a detailed analysis of the United States' Gross Domestic Product (GDP), employing both the expenditure and income approaches. The report begins by examining nominal and real GDP, highlighting the impact of inflation and explaining the key components of GDP, including personal consumption expenditure, gross private domestic investment, net exports, and government consumption expenditure. The analysis includes percentage shares and contributions of each component. The second part of the report shifts to the income approach, discussing GDP, Gross National Product (GNP), Net National Product, National Income, and Personal Income. It highlights the differences between these measures and their relevance in understanding economic growth and income distribution. The report concludes by emphasizing the consistency between the two approaches and the significance of compensation of employees in national income.

PRINCIPLES OF MACROECONOMICS
Principles of Macroeconomics
Name of the Student
Name of the University
Course ID
Principles of Macroeconomics
Name of the Student
Name of the University
Course ID
Secure Best Marks with AI Grader
Need help grading? Try our AI Grader for instant feedback on your assignments.

1PRINCIPLES OF MACROECONOMICS
Table of Contents
Part 1: Expenditure Approach to Calculating GDP.........................................................................2
Part a............................................................................................................................................2
Part b............................................................................................................................................2
Report..........................................................................................................................................2
Part 2: Income Approach to Calculating GDP................................................................................5
Report..........................................................................................................................................6
References........................................................................................................................................9

2PRINCIPLES OF MACROECONOMICS
Part 1: Expenditure Approach to Calculating GDP
Part a
Table 1: Gross Domestic Product and its component
Part b
Table 2: Percentage share of different components in GDP
Report
Introduction
The report aims to discuss nominal and real GDP of United State with estimates made
using expenditure approach. The discussion includes brief explanation of different components
and its contribution to the economy.
Discussion
The accounted nominal GDP in the third quarter of 2019 was 21542.5 billion dollars. The
estimated real GDP for the same period was 19121.1. Nominal GDP of a nation expresses value

3PRINCIPLES OF MACROECONOMICS
of produced goods and services of a nation in terms of prices in current year. Real GDP on the
other hand expresses values of goods and services considering prices in a selected base year.
Since, real GDP computes values of goods and service excluding the impact of inflation real
GDP is general smaller than nominal GDP (Goodwin et al., 2015). US inflation rate in third
quarter of 2019 was 2.1 percent which is higher than the previous quarter. Because of
inflationary impact nominal GDP was larger than real GDP. Nominal GDP exceeded the real
GDP by 2421.4 billion dollars.
The four components which make up GDP are “Personal consumption expenditure”,
“Gross private domestic investment”, “Net exports of goods and services” and “Government
consumption expenditure and gross investment” (Uribe & Schmitt-Grohe, 2017). Of the four
components, “Personal consumption expenditure” makes up the largest portion of GDP with
percentage of “Personal consumption expenditure” in nominal GDP ad real GDP being 68.13%
and 76.76% respectively. The smaller portion of GDP is made up by Net export of goods and
service with share of the component in nominal and real GDP being -3.03% and -3.41%
respectively.
“Gross private domestic investment” is a representative measure that captures physical
investment used in calculating GDP to measure aggregate economic activity of a nation. This is
considered as a vital component in GDP estimation since is provides indication about future
productive capacity of an economy (Heathfield, 2015). It measures fixed investment and changes
in the private inventories. The fixed investment of a nation includes “non-residential”,
“intellectual property products” and “residential investment”. Changes in private inventories
include both farm and nonfarm inventories.
Secure Best Marks with AI Grader
Need help grading? Try our AI Grader for instant feedback on your assignments.

4PRINCIPLES OF MACROECONOMICS
The “net export of goods and services” represents trade balance of a nation. It is
computed as a difference between total export and total import. Net export of a nation becomes
negative when import of the nation exceeds that of its export (Agenor & Montiel, 2015). For the
accounting period, total value of goods and service exported was 2504.0 billion dollars. As
against this total value of goods and service imported was 3166.7 billion dollars. Since import
exceeded the export, net export is negative indicating a trade deficit.
As obtained from the data table, the speeding on national defense recorded in the last
quarter was 849.3 billion dollars. The percentage of national defense in “Government
consumption expenditures and gross investment” is computed as
Spending on National Defense
Government consumption expenditure∧gross investment ×100
¿ 849.3
3772.8 ×100
¿ 22.51 %
The percentage of National defense out of GDP is
Spending on National Defense
Nominal GDP × 100
¿ 849.3
21542.5 ×100
¿ 3.94 %
Real GDP in the third quarter increased by 2.1 percent. The increase in real GDP of the
nation was mainly contributed from an increase in personal consumption expenditure, spending
made by federal government, residential investment, expansion of export and spending by state

5PRINCIPLES OF MACROECONOMICS
and local government. The positive contribution of these components were somewhat offset
because of negative contribution coming from fixed investment in nonresidential segment and
investment in private inventory. Increase in import constituted another leakage offsetting positive
impact of some components.
Conclusion
The data collected for the exercise gives necessary information related to nominal GDP
and real GDP of United State. By providing information related to different components of GDP
it helps to understand contribution made by different expenditure components in the nation’s
GDP. It has been observed that the largest component of GDP of the nation is consumption
expenditure while the smallest component is net export of goods and services. The data set not
only contains information regarding GDP and aggregate expenditure of different components but
also contains sub parts of different expenditure components. From the data set the information
regarding spending on national defense is also obtained which is useful for understanding how
much US spends on security of the nation. The original data set provides information on
accounted GDP in the previous quarter helping to analyze direction of economic growth of the
nation.
Part 2: Income Approach to Calculating GDP
Table 3: GDP, GNP, NNP, National income and Personal income

6PRINCIPLES OF MACROECONOMICS
Paraphrase This Document
Need a fresh take? Get an instant paraphrase of this document with our AI Paraphraser

7PRINCIPLES OF MACROECONOMICS
Table 4: Calculation of Net national product
Report
Introduction
This report discusses GDP estimates computed using income approach. Apart from GDP,
the report includes discussion regarding other measures such as Gross National Product, Net
National Product, National Income and Personal Income.
Discussion
“Gross Domestic Product” computes value of finished goods and services that are
marketed in an accounting year within the national boundary. Gross National Product measures
also measures value of all the products and services it however not bounded by national
boundary (Heijdra, 2017). GNP in addition to GDP include “net property income from abroad”.
One aspect following which GDP differs from GNP is that GDP includes income earned by
foreign multinational while GNP excludes income of foreign multination when they sent profit to
their own country.
In order to determine GNP from GDP, one must add income receipt from rest of the
world to GDP while income payments made to rest of the world must be subtracted.
National income implies total amount of product and service that a nation produces
within a given time. It actually measures monetary values of goods and services produced within
the economy in the chosen accounting period (Coppock & Mateer, 2017). The level and growth

8PRINCIPLES OF MACROECONOMICS
in national income estimate is vital for measuring economic growth, changes in standard of
living and changes in income distribution.
As obtained from the data table GNP is higher in this compared to NI. GNP is higher by
3588 billion dollars.
For determining NI from GNP, “consumption of fixed capital” and “statistical
discrepancy” need to be subtracted from measured GNP.
National income is composed of different categories (Sadat, 2017). Of these categories,
compensation of employees constitutes the largest portion of NI with accounted share being
nearly 63 percent. Compensation of employees have two main categories such as wages and
salaries and supplement to wage and salaries.
Conclusion
The data exercise includes data on different measures related to aggregate output and
aggregate income of United State. Data on different estimates related to national aggregate help
to understand the difference between different measures. The estimated GDP obtained using
income approach is same as that obtained under expenditure approach supporting the assumption
that GDP obtained using any of the available method gives identical result. Though both GDP
and GNP measure total value of goods and services they differ in terms of measured items. The
estimated GNP is higher than GDP suggesting net income from abroad is positive making
positive contribution to the economy. National income include income earned by different factor
of production is less than GNP since it is obtained after subtracting “consumption of fixed
capital” and “statistical discrepancy” from GNP. The most significant component in the
estimated NI is compensation of employees. The data set also includes data on personal income

9PRINCIPLES OF MACROECONOMICS
which reflects income of an average household. The data exercise thus is useful in understanding
and interpreting different important measures related to national income estimates.
which reflects income of an average household. The data exercise thus is useful in understanding
and interpreting different important measures related to national income estimates.
Secure Best Marks with AI Grader
Need help grading? Try our AI Grader for instant feedback on your assignments.

10PRINCIPLES OF MACROECONOMICS
References
Agenor, P. R., & Montiel, P. J. (2015). Development macroeconomics. Princeton university
press.
Coppock, L., & Mateer, D. (2017). Principles of macroeconomics. WW Norton.
Goodwin, N., Harris, J. M., Nelson, J. A., Roach, B., & Torras, M. (2015). Macroeconomics in
context. Routledge.
Heathfield, D. F. (Ed.). (2015). Topics in applied macroeconomics. Macmillan International
Higher Education.
Heijdra, B. J. (2017). Foundations of modern macroeconomics. Oxford university press.
Sadat, S. D. (2017). Rethinking Macroeconomics: An Introduction. International Journal of
Economics, Management and Accounting, 25(3), 635-639.
Uribe, M., & Schmitt-Grohe, S. (2017). Open economy macroeconomics. Princeton University
Press.

11PRINCIPLES OF MACROECONOMICS
1 out of 12
Related Documents

Your All-in-One AI-Powered Toolkit for Academic Success.
+13062052269
info@desklib.com
Available 24*7 on WhatsApp / Email
Unlock your academic potential
© 2024 | Zucol Services PVT LTD | All rights reserved.