Economics Assignment: Real GDP, Business Cycles, Malaysia's Economy
VerifiedAdded on 2023/06/03
|14
|3578
|232
Essay
AI Summary
This economics assignment provides a comprehensive analysis of key economic concepts. It begins by defining and differentiating between Real and Gross Domestic Product (GDP), explaining how their calculation avoids double-counting and accounts for price level changes. The assignment then identifies and explains the phases of a business cycle, including recovery, boom, recession, and depression. It relates business cycles to the long-run trend of real GDP in Malaysia from 1980 to 2017, using a graph to illustrate the cyclical patterns within the overall economic growth. Furthermore, it provides solutions to firm-level problems in business cycles, distinguishing between preventive and relief measures that businesses can implement. Finally, the assignment evaluates the Malaysian economy for the current and upcoming year, analyzing consumer consumption, savings, investment, and inflation using economic data to provide a detailed overview of the country's economic performance and outlook.
ECONOMICS ASSIGNMENT 1
ECONOMICS ASSIGNMENT
(Name)
The Name of the Class (Course)
Professor (Tutor)
The Name of the School (University)
The City and State where it is located
The Date
ECONOMICS ASSIGNMENT
(Name)
The Name of the Class (Course)
Professor (Tutor)
The Name of the School (University)
The City and State where it is located
The Date
Paraphrase This Document
Need a fresh take? Get an instant paraphrase of this document with our AI Paraphraser
ECONOMICS ASSIGNMENT 2
Differences in Real and Gross Domestic Product
Gross domestic product refers to the total value of goods and services produced in a
certain territory usually a country within a period normally measured in a quarterly or annual
basis (Robert, C, 2014 pp 84). On the other hand, Real Domestic Product refers to the Gross
Domestic Product but adjusted for prices to account for inflationary or deflationary pressures in
the economy (Sumner, S, B, 2014 pp 315). The real domestic product gives a better and
complete assessment of the economic performance of a country as output can be measured for its
true value and avoids distortions such as a perceived increase in the size of the economy that is
only due to increases in prices. Increases in prices have the shortcoming of showing increased
levels of output produced that is nonexistent and can be attributed to the higher prices of goods
and services (Oulton, N, 2013 pp R59-65).
Calculations of Real Gross Domestic Product faces the problem of double counting that
arises due to counting of the value of an item multiple times (Oulton, N, 2013 pp R59-65). For
example, an item such as a finished book would have each producer at each stage of production
declaring the final value of their. The wood harvester will declare the value of the tree cut down
while the processing plant would also declare their final value. The same will apply to the book
publisher. Any person calculating the value of economic production will therefore be faced by
this problem of accounting for intermediate items. In order to minimize and eliminate the
problem, economists may use two methods; the final product approach or the value added
approach (Oulton, N, 2013 pp R59-69). The final product approach faces the same problem of
double counting though at a minimal level.
ECONOMICS ASSIGNMENT 3
Therefore, the most optimum method of determining the real GDP is use of value added
method. Using this method, instead of calculating each finished product and adding its value, the
value added at each chain of production is added together to get the total value of the item thus
eliminating the double counting problem (Zulkhibri & Abdul Rani 2016 pp 372-392). In the example
above of a book production, it would begin by accounting for the price of the cut wooden piece,
then added to the value that a processor adds to make it into a sheet of paper. The publisher
would also declare the value digit increased on the sheet of paper rather than the final value of
the item.
Changes in prices of goods and services affect nominal tabulation of Gross Domestic
Price given that the figures are arrived at by adding together the value of goods and services.
Increase in the general prices of commodities will therefore result in a higher nominal value for
the GDP over time although real output has not increased. As result the need arises to adjust the
GDP to base prices in order to determine the real values of the Gross Domestic Product.
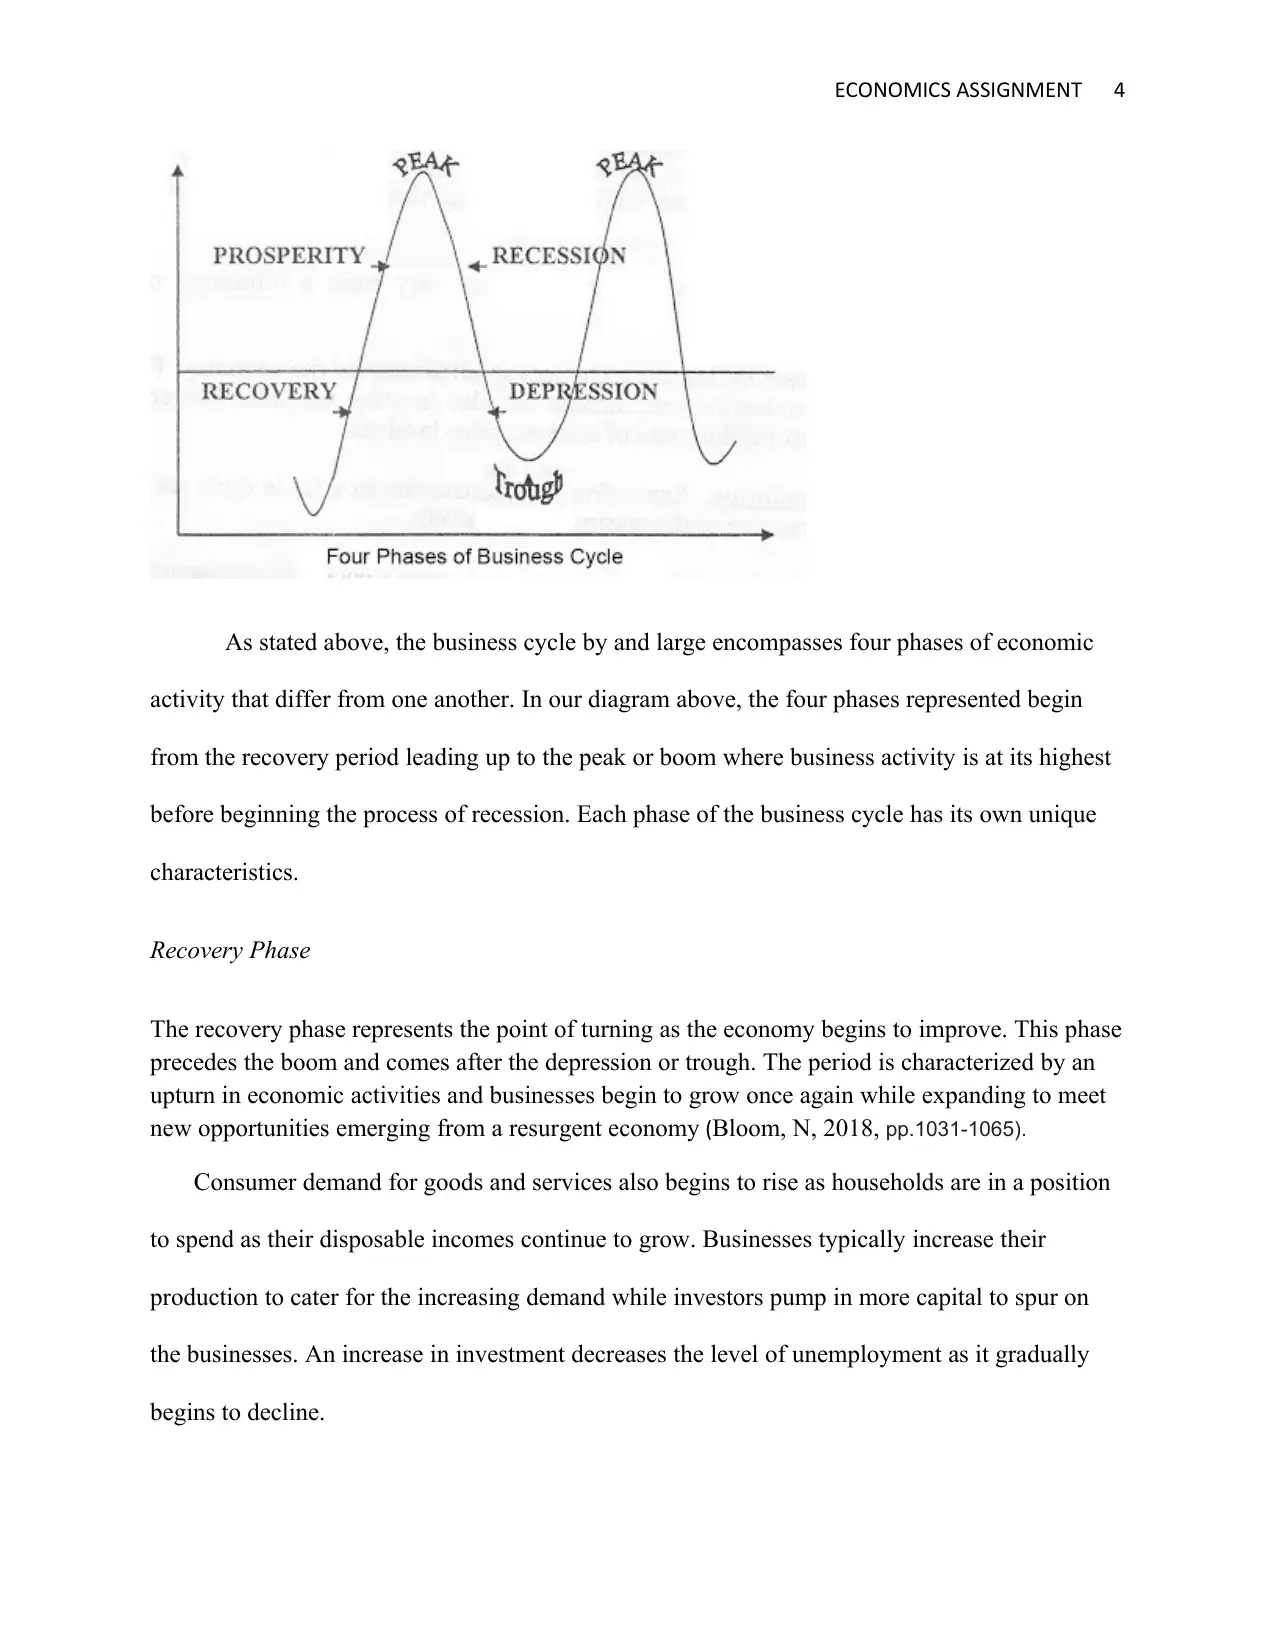
Phases of a Business Cycle
The business cycle is the regular up and down movement of the Gross Domestic Product
as measured at particular points in time (Gabisch & Lorenz 2013 pp230). These fluctuations in the
rate of economic activity are measured by the real Gross Domestic Output. Also referred to as
the economic cycle, the length of a business cycle begins with a recovery period, followed by a
boom, a recession as the economy is slowing down before hitting the trough. The end of the
cycle is the beginning of the recovery period again. This cycle can be represented in a diagram as
shown below.
Therefore, the most optimum method of determining the real GDP is use of value added
method. Using this method, instead of calculating each finished product and adding its value, the
value added at each chain of production is added together to get the total value of the item thus
eliminating the double counting problem (Zulkhibri & Abdul Rani 2016 pp 372-392). In the example
above of a book production, it would begin by accounting for the price of the cut wooden piece,
then added to the value that a processor adds to make it into a sheet of paper. The publisher
would also declare the value digit increased on the sheet of paper rather than the final value of
the item.
Changes in prices of goods and services affect nominal tabulation of Gross Domestic
Price given that the figures are arrived at by adding together the value of goods and services.
Increase in the general prices of commodities will therefore result in a higher nominal value for
the GDP over time although real output has not increased. As result the need arises to adjust the
GDP to base prices in order to determine the real values of the Gross Domestic Product.
Phases of a Business Cycle
The business cycle is the regular up and down movement of the Gross Domestic Product
as measured at particular points in time (Gabisch & Lorenz 2013 pp230). These fluctuations in the
rate of economic activity are measured by the real Gross Domestic Output. Also referred to as
the economic cycle, the length of a business cycle begins with a recovery period, followed by a
boom, a recession as the economy is slowing down before hitting the trough. The end of the
cycle is the beginning of the recovery period again. This cycle can be represented in a diagram as
shown below.
⊘ This is a preview!⊘
Do you want full access?
Subscribe today to unlock all pages.
Trusted by 1+ million students worldwide
ECONOMICS ASSIGNMENT 4
As stated above, the business cycle by and large encompasses four phases of economic
activity that differ from one another. In our diagram above, the four phases represented begin
from the recovery period leading up to the peak or boom where business activity is at its highest
before beginning the process of recession. Each phase of the business cycle has its own unique
characteristics.
Recovery Phase
The recovery phase represents the point of turning as the economy begins to improve. This phase
precedes the boom and comes after the depression or trough. The period is characterized by an
upturn in economic activities and businesses begin to grow once again while expanding to meet
new opportunities emerging from a resurgent economy (Bloom, N, 2018, pp.1031-1065).
Consumer demand for goods and services also begins to rise as households are in a position
to spend as their disposable incomes continue to grow. Businesses typically increase their
production to cater for the increasing demand while investors pump in more capital to spur on
the businesses. An increase in investment decreases the level of unemployment as it gradually
begins to decline.
Paraphrase This Document
Need a fresh take? Get an instant paraphrase of this document with our AI Paraphraser
ECONOMICS ASSIGNMENT 5
As a majority of consumers have the ability to spend, it drives up prices for goods and services
which translates to more profits for businesses (Bloom, N, 2018 pp.1031-1065).
A good economic climate leads to increased credit availability from financial institutions
seeking to capitalize on the expanding business by providing extra capital. This phase involves a
mostly expansionary business climate and the real GDP begins to steadily rise.
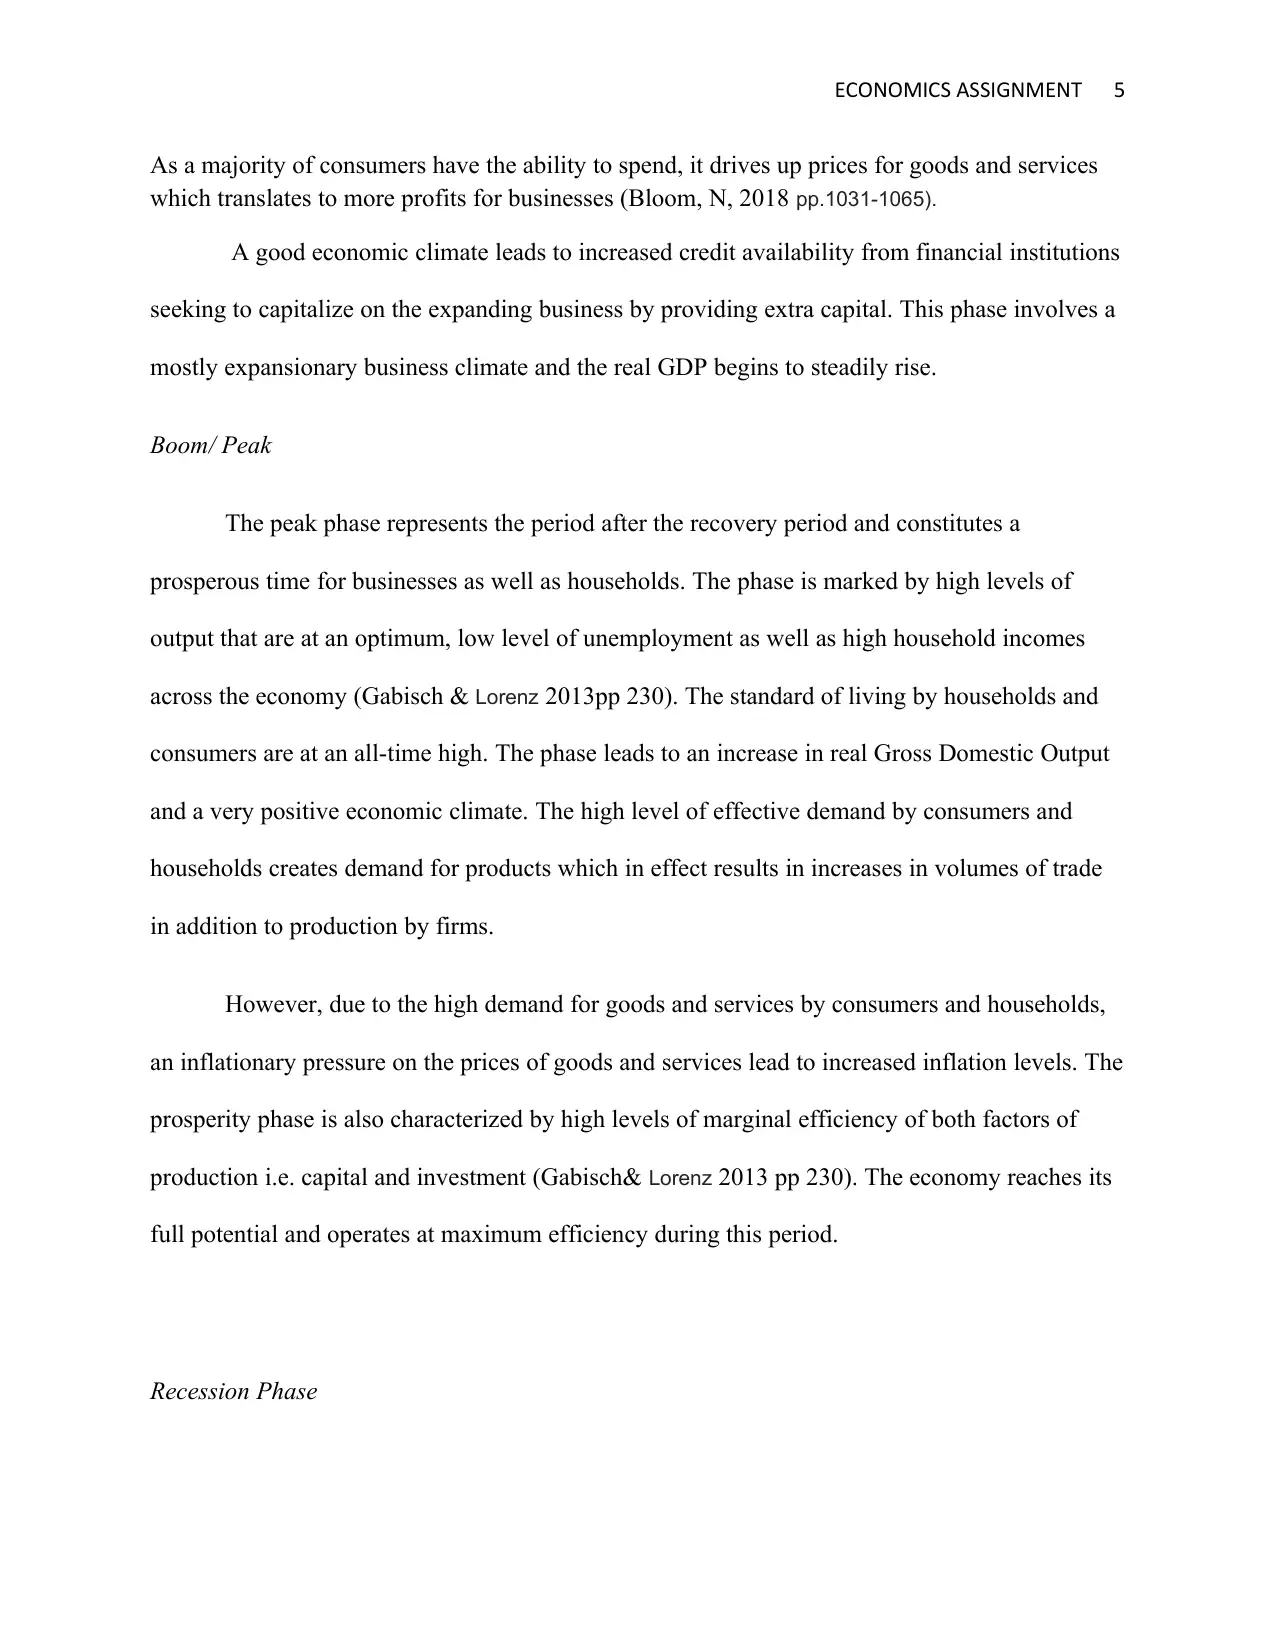
Boom/ Peak
The peak phase represents the period after the recovery period and constitutes a
prosperous time for businesses as well as households. The phase is marked by high levels of
output that are at an optimum, low level of unemployment as well as high household incomes
across the economy (Gabisch & Lorenz 2013pp 230). The standard of living by households and
consumers are at an all-time high. The phase leads to an increase in real Gross Domestic Output
and a very positive economic climate. The high level of effective demand by consumers and
households creates demand for products which in effect results in increases in volumes of trade
in addition to production by firms.
However, due to the high demand for goods and services by consumers and households,
an inflationary pressure on the prices of goods and services lead to increased inflation levels. The
prosperity phase is also characterized by high levels of marginal efficiency of both factors of
production i.e. capital and investment (Gabisch& Lorenz 2013 pp 230). The economy reaches its
full potential and operates at maximum efficiency during this period.
Recession Phase
As a majority of consumers have the ability to spend, it drives up prices for goods and services
which translates to more profits for businesses (Bloom, N, 2018 pp.1031-1065).
A good economic climate leads to increased credit availability from financial institutions
seeking to capitalize on the expanding business by providing extra capital. This phase involves a
mostly expansionary business climate and the real GDP begins to steadily rise.
Boom/ Peak
The peak phase represents the period after the recovery period and constitutes a
prosperous time for businesses as well as households. The phase is marked by high levels of
output that are at an optimum, low level of unemployment as well as high household incomes
across the economy (Gabisch & Lorenz 2013pp 230). The standard of living by households and
consumers are at an all-time high. The phase leads to an increase in real Gross Domestic Output
and a very positive economic climate. The high level of effective demand by consumers and
households creates demand for products which in effect results in increases in volumes of trade
in addition to production by firms.
However, due to the high demand for goods and services by consumers and households,
an inflationary pressure on the prices of goods and services lead to increased inflation levels. The
prosperity phase is also characterized by high levels of marginal efficiency of both factors of
production i.e. capital and investment (Gabisch& Lorenz 2013 pp 230). The economy reaches its
full potential and operates at maximum efficiency during this period.
Recession Phase
ECONOMICS ASSIGNMENT 6
After the boom, economic activities begin to slow down as business enthusiasm gives way to
gloom. Consumer demand begins to fall during this period leading to steady decreases in
supplies of output to a market that is slowing down (Bloom, N, 2018 pp.1031-1065).
Firms have to begin laying-off their workers due to the decreased demand for their goods
and services resulting in increasing unemployment rates. Low and reducing consumer spending
power means that prices of commodities begin to decline to their pre-boom levels. Investment
levels drop while financial institutions shy away from providing credit to businesses on the wane
in a not so ideal business climate.
Depression Phase
The recession period normally does not last for extended periods of time and ultimately gives
way to the depression phase. The period is also referred to as the trough. Its features include a
reduction in the prices of goods thus dampening business enthusiasm leading to a decline in
output and volume of trade. Households experience very low incomes accompanied by
considerably high levels of unemployment. During this period, resources are under-utilized
resulting in a drop in the marginal efficiency of both capital and Investment (Bloom, N, 2018
pp.1031-1065).
The business cycle then repeats itself; the depression period is then followed by a
recovery phase where the business environment begins to improve.
⊘ This is a preview!⊘
Do you want full access?
Subscribe today to unlock all pages.
Trusted by 1+ million students worldwide
ECONOMICS ASSIGNMENT 7
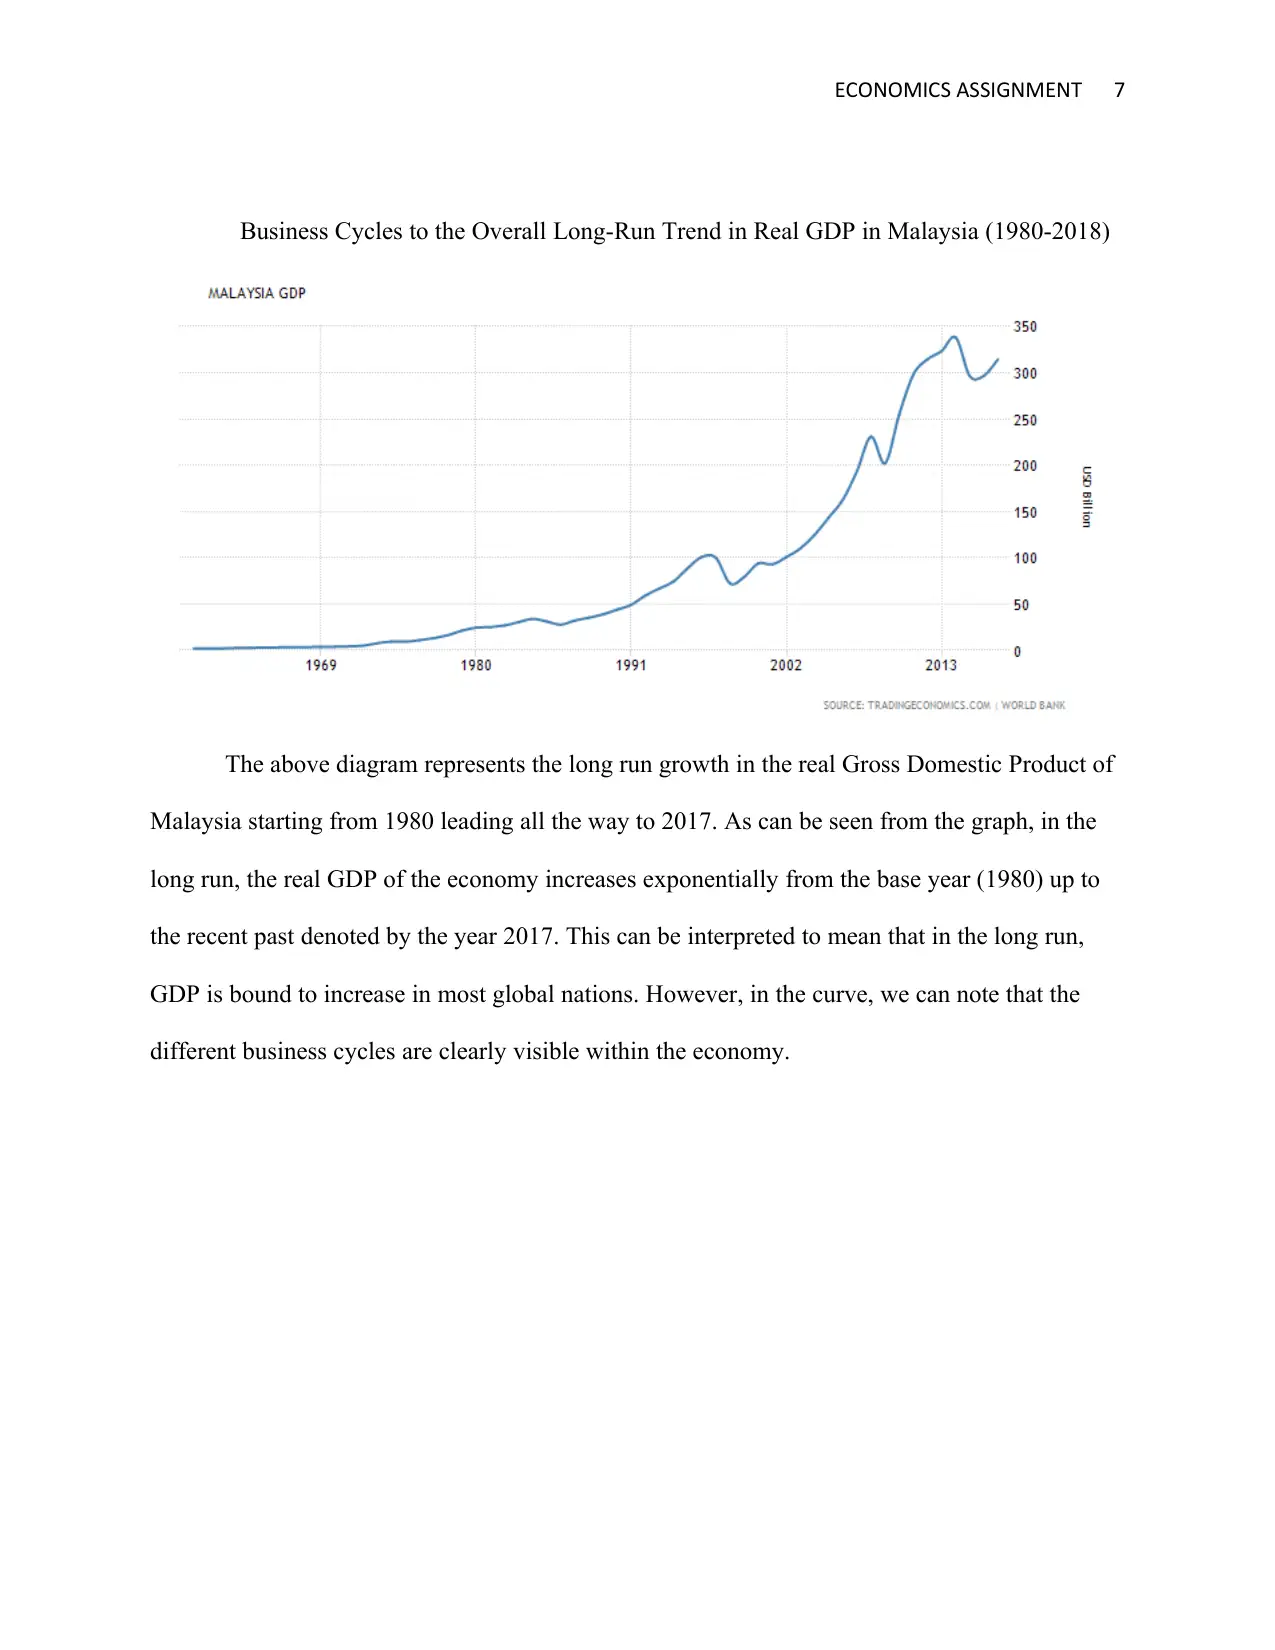
Business Cycles to the Overall Long-Run Trend in Real GDP in Malaysia (1980-2018)
The above diagram represents the long run growth in the real Gross Domestic Product of
Malaysia starting from 1980 leading all the way to 2017. As can be seen from the graph, in the
long run, the real GDP of the economy increases exponentially from the base year (1980) up to
the recent past denoted by the year 2017. This can be interpreted to mean that in the long run,
GDP is bound to increase in most global nations. However, in the curve, we can note that the
different business cycles are clearly visible within the economy.
Paraphrase This Document
Need a fresh take? Get an instant paraphrase of this document with our AI Paraphraser
ECONOMICS ASSIGNMENT 8
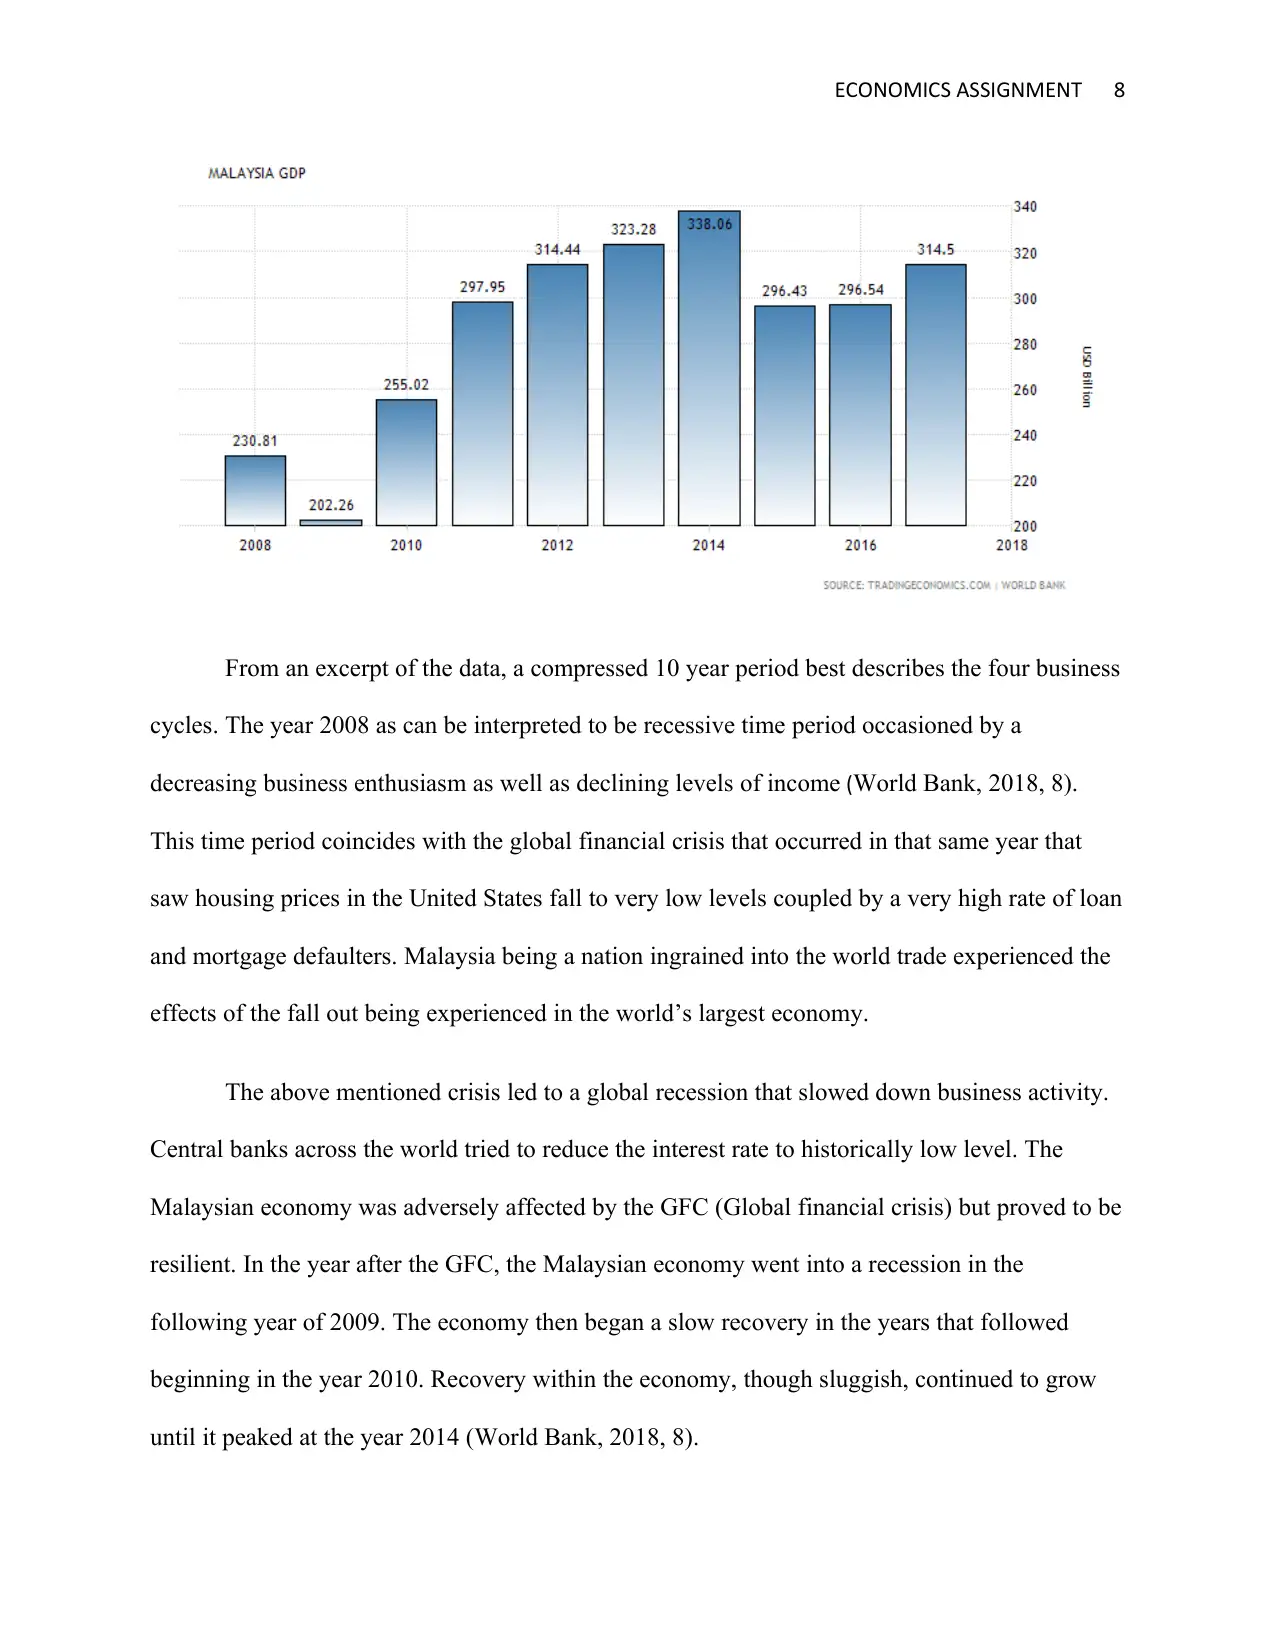
From an excerpt of the data, a compressed 10 year period best describes the four business
cycles. The year 2008 as can be interpreted to be recessive time period occasioned by a
decreasing business enthusiasm as well as declining levels of income (World Bank, 2018, 8).
This time period coincides with the global financial crisis that occurred in that same year that
saw housing prices in the United States fall to very low levels coupled by a very high rate of loan
and mortgage defaulters. Malaysia being a nation ingrained into the world trade experienced the
effects of the fall out being experienced in the world’s largest economy.
The above mentioned crisis led to a global recession that slowed down business activity.
Central banks across the world tried to reduce the interest rate to historically low level. The
Malaysian economy was adversely affected by the GFC (Global financial crisis) but proved to be
resilient. In the year after the GFC, the Malaysian economy went into a recession in the
following year of 2009. The economy then began a slow recovery in the years that followed
beginning in the year 2010. Recovery within the economy, though sluggish, continued to grow
until it peaked at the year 2014 (World Bank, 2018, 8).
ECONOMICS ASSIGNMENT 9
The 2014 financial year is representative of a boom in the business cycle. True to the true
nature of a business cycle, after the boom of the year 2014, the Malaysian economy began
sliding ever so closer towards recession but was resilient to recover in the two years that
followed. A similar trend of business cycle can be noted in the years around 1998-1999 in the
line graph above which depicts a slowing down of economic activity in the country (Sherman, H,
2014 pp 93). This period also experienced a global crisis when the Dot.com bubble bust to send
many investors reeling. Within the modern day globalized modern way of doing business, a
crisis in one part of the world reverberates across the world as financial markets are
interconnected and rely on the same pool of investors.
Any shaky and wavy portions in the line graph points to a more pronounced business
cycle incidence in the economy (World Bank, 2018, 7).
Solutions to the Firm Level Problems in Business Cycles (Preventive and Relief)
Businesses have to take measures to mitigate the effects of business cycles that can have
very positive results for a business today and gloom tomorrow. A majority of measures that
businesses can employ can be classified into either preventive or relief measures.
Preventive Measures
Encompasses measures employed during the peak/boom period which aim at controlling
procurements to the firm as well as avoiding being bound by restrictive loans and credit. To be
effectively employed, the firms managers must differentiate the general economic business cycle
form that of the firm and know their relationship (Gabisch & Lorenz 2013 pp 115). They also
have to be equipped with knowledge regarding the cyclical movements of prices of commodities
⊘ This is a preview!⊘
Do you want full access?
Subscribe today to unlock all pages.
Trusted by 1+ million students worldwide
ECONOMICS ASSIGNMENT 10
in relation to the ongoing business cycle in the region of their operation. During the boom phase,
the firm must limit out of control expansion that cannot be sustained during harsher economic
times.
The firm ought not to go on an expansion spree to meet a short term cyclical demand that
will not be there during the next business cycle. Any expansions have to be warranted and within
the firms capacity to keep them running when demand falls (Gabisch & Lorenz 2013 pp115). The
firm ought to also avoid sharp drops in production capacity that impairs the limit to which the
firm can produce up to. In tough economic conditions, cut backs should not degrade working
conditions of employees or increase cost of production per unit of commodity.
During favorable economic times, the firm must avoid rush commitments that exceed its
capacity to meet them or stretch its available resources to the limit. The firm should sign supply
or purchase contracts that are within its ability to honor them (Sherman, H, 2014 pp 34). The
firm managers ought to refrain from rigid credit structures that leave little room for
maneuverability and seek flexible terms that be amended or changed in accordance with the
prevailing economic cycle.
Relief measures
Relief measures are steps that a firm makes available for implementation during poor
economic conditions such as a depression. The firm should minimize the cost of production to
bare minimum through automation of the manufacturing processes. The production processes
should ensure quality is maintained coupled with a flexible human resource that can be
redeployed as needs demand (Gabisch, G, 2013 pp115). The firm should ensure it has market
awareness at all times driven by a well-functioning marketing strategy that takes into account the
Paraphrase This Document
Need a fresh take? Get an instant paraphrase of this document with our AI Paraphraser
ECONOMICS ASSIGNMENT 11
prevailing market conditions and aims to maximize sales. Diversification of product offering is
important for them to enable it stay afloat more so to mitigate instances where one product may
be performing poorly in the market.
Evaluate the Malaysian Economy for the Remaining of this Year and Next Year Using the
Concepts of Consumer Consumptions, Savings, Investment, and Inflation
The Malaysian economy grew its GDP in the first quarter of 2018 by 5.4% which was
below the regions average of 6.6%. The growth can be attributed to the currently prevailing
global economic resurgence fuelled by the high prices of commodity goods as well as boom in
the real estate sector (World Bank, 2018, 8). Strong consumer consumption has been the driving
factor behind Malaysia’s growth in the year. Real GDP has continued to grow exponentially
throughout the year fuelled by increase in investment from the private investment and decrease
in local government borrowing that has limited incidences of crowding out effect.
Private consumption has thus far in the first quarter of 2018 remained the strongest driver
of economic growth in the country and accounts for the highest growth rates of any economic
indicator with an improved rate of 6.9% (World Bank, 2018, 8). Consumption has continued to
increase because of the stable working conditions where most employees feel secure about the
economy and the safety of their jobs. Public consumption has however remained at lower levels.
Public expenditure has remained relatively low with growth in the first quarter of 2018 at a paltry
0.4%. The income helped drive this consumption craze by promoting policies that improved
consumer sentiment (Eriksson & Hermansson 2014 pp279-299)
Gross national savings is the difference between the GNI and total combined total
consumption (Trading Economics, 2018, 71). Gross savings rate in the country was measured at
ECONOMICS ASSIGNMENT 12
28.7% in the first quarter of 2018 which had remained unchanged from the previous quarters’
estimates. For the next phase of the year, the savings rate is not expected to exceed 30% ending
the year at an estimated low of 28.1% (World Bank, 2018, 8). A robust saving culture lays the
foundation for increased investment in the economy as banks find themselves with enough
capital to lend it back to the society at a cheaper interest rate.
Investment in the economy has reduced somewhat despite government’s effort to
strengthen investment particularly in key sectors the economy.
The inflation rate for the first quarter of 2018 has moderated at 1.8%. This is a
considerable drop for what was forecasted mainly because of external matters. Global crude oil
determines the rate of inflation as it critical in the transportation of various commodities into the
country, with foodstuffs taking a huge share of that. However, this position has shifted with the
decrease in global crude oil prices that have resulted in a revision of the inflation for the last
quarter of the year to reflect the development (World Bank, 2018, 8). The price of foodstuffs has
as a result stabilized amid a constant importation of fresh supplies. However, inflation as a
parameter of economic development has raised fears concerning its inflationary impact on the
lower wage earners who spend a majority of their income on foodstuffs.
During the last quarter of this year (2018) the inflation rate is expected to average around
the 1.4% rate a drop from the previous 1.8% rate. The drop is attributed to a scheduled reduction
of tax on goods and services tax (GST) that begun on first June. The tax zero rates the
commodities. For 2019, the inflation rate is expected to rise to 2.2% points.
The economy is forecasted to grow at 5.4% during the 2018 financial year mainly
attributive to strong consumption in the economy by households (Trading Economics, 2018, 7).
⊘ This is a preview!⊘
Do you want full access?
Subscribe today to unlock all pages.
Trusted by 1+ million students worldwide
1 out of 14
Related Documents


Your All-in-One AI-Powered Toolkit for Academic Success.
+13062052269
info@desklib.com
Available 24*7 on WhatsApp / Email
![[object Object]](/_next/static/media/star-bottom.7253800d.svg)
Unlock your academic potential
Copyright © 2020–2026 A2Z Services. All Rights Reserved. Developed and managed by ZUCOL.