Report on Management Accounting: Cost Allocation and Ethical Dilemmas
VerifiedAdded on 2023/01/05
|13
|2374
|48
Report
AI Summary
This report provides a detailed analysis of management accounting principles and techniques. It begins with an introduction to management accounting and then delves into various costing methods, including job costing, unit costing, and break-even analysis. The report explores different cost allocation methods such as direct, step-down, and reciprocal methods, comparing their application and accuracy. It examines break-even analysis, calculating break-even points under different sales mixes and considering operational income. The report also addresses an ethical dilemma faced by a sales manager in the context of budgeting, evaluating the implications of unethical behavior. The conclusion summarizes the key findings, emphasizing the importance of cost accounting in management decision-making. References to relevant literature are also provided.

Management Accounting
1
1
Paraphrase This Document
Need a fresh take? Get an instant paraphrase of this document with our AI Paraphraser
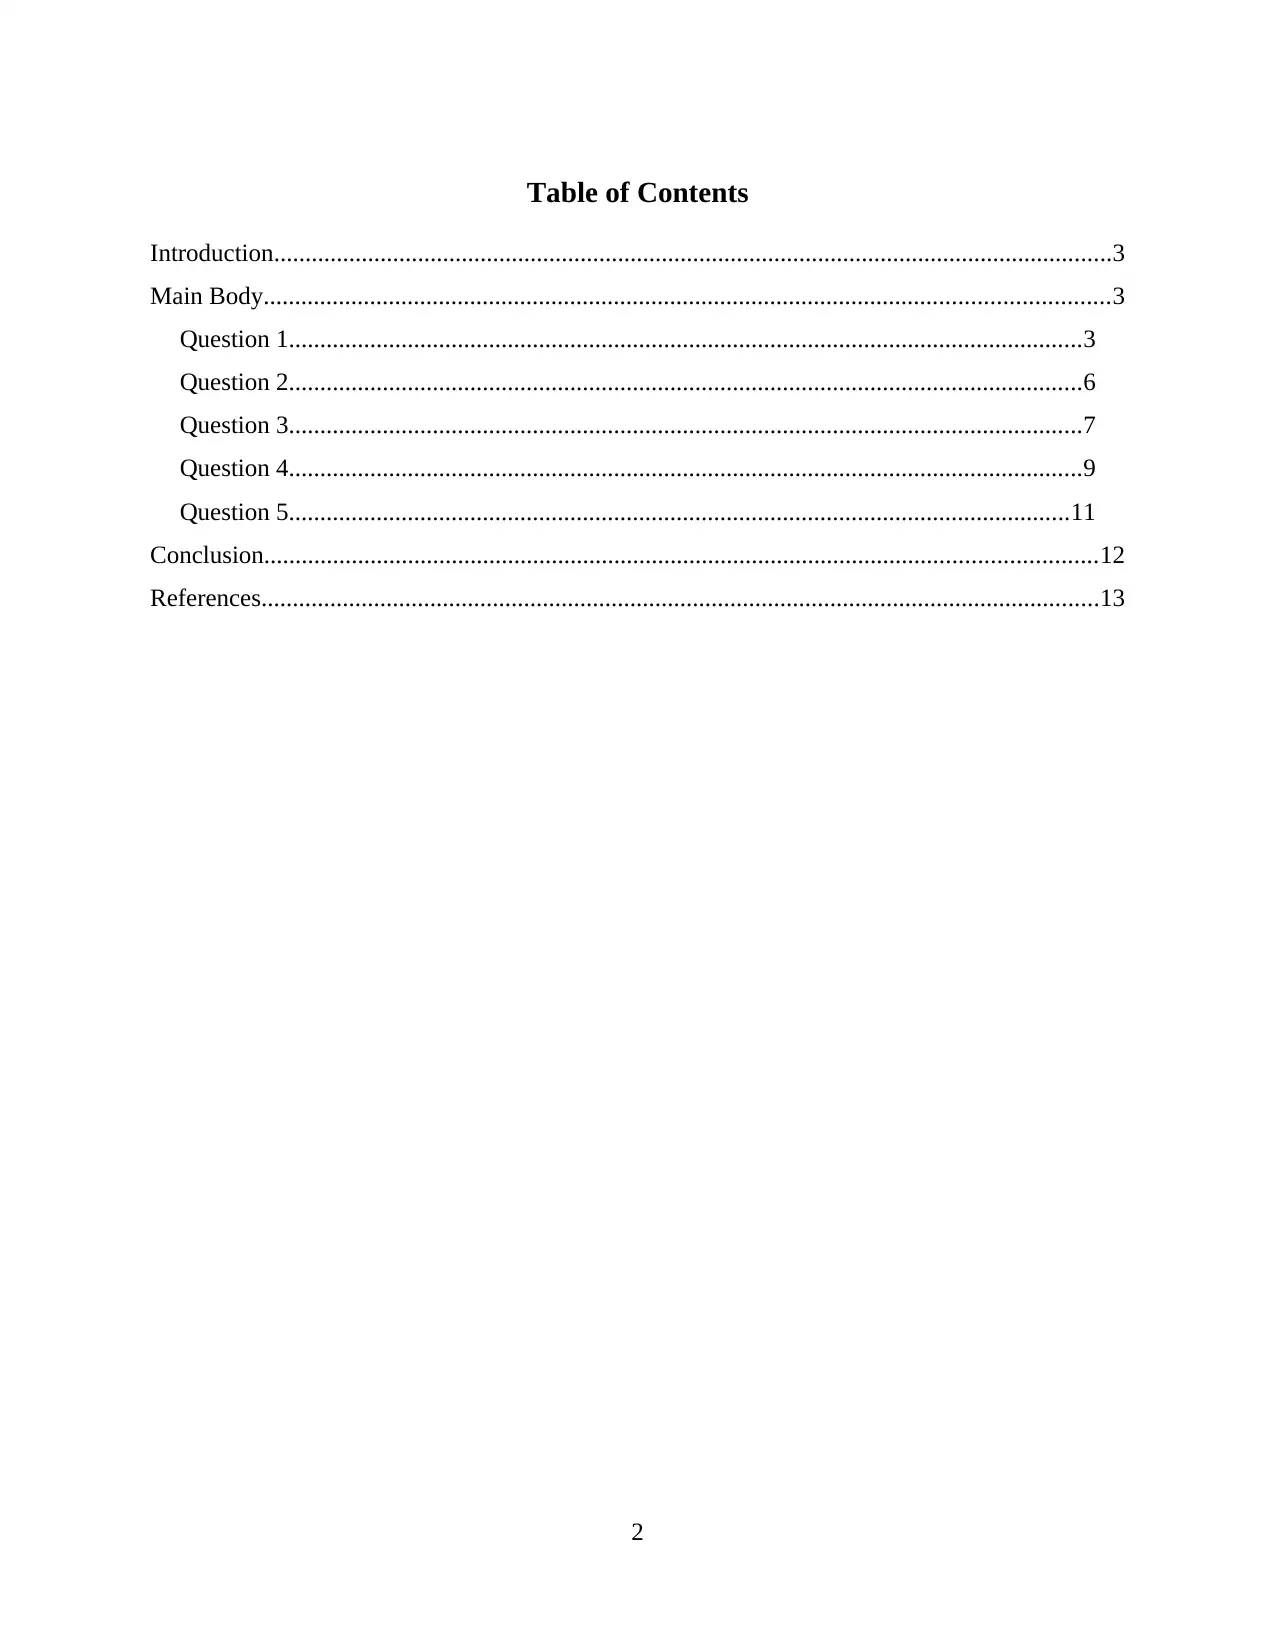
Table of Contents
Introduction......................................................................................................................................3
Main Body.......................................................................................................................................3
Question 1...............................................................................................................................3
Question 2...............................................................................................................................6
Question 3...............................................................................................................................7
Question 4...............................................................................................................................9
Question 5.............................................................................................................................11
Conclusion.....................................................................................................................................12
References......................................................................................................................................13
2
Introduction
Management accounting is that stream of accounting which is concerned with only internal
management of the company (Datar and Rajan, 2018). This report has been prepared to assess
various concepts of costing – job costing, unit costing, break even analysis and ethical dilemma
faced by managers while preparing various budgets.
Main Body
Question 1
(i) Direct Method – This method of cost allocation, allocates cost of support department
to manufacturing department on the basis of allocation base, ignoring the services
used by inter-department.
Total cost = Departmental cost + allocated cost
Support Department Manufacturing department
Legal Personnel Laptop Workstation
Costs 9055 4000 240000 200000
Legal cost allocation (9055) - 5877.80 3177.20
Personnel cost allocation - (4000) 2222.20 1777.80
Total Cost 0 0 $248,100 $204,955
Working Note 1: Allocation rate = Support department cost/Total cost of bases of
manufacturing departments
Legal Department Personnel Department
Support department cost 9055 4000
Total cost of bases 37+20+ = 57 200 + 160 = 360
Allocation Rate $158.86 per hour $11.11 per hour
Working Note 2: Allocated Cost = Cost driver * Allocation rate
Laptop Department Workstation Department
Legal Department 37* 158.86 = $5584.04 20*158.86 = $3177.2
3
⊘ This is a preview!⊘
Do you want full access?
Subscribe today to unlock all pages.
Trusted by 1+ million students worldwide
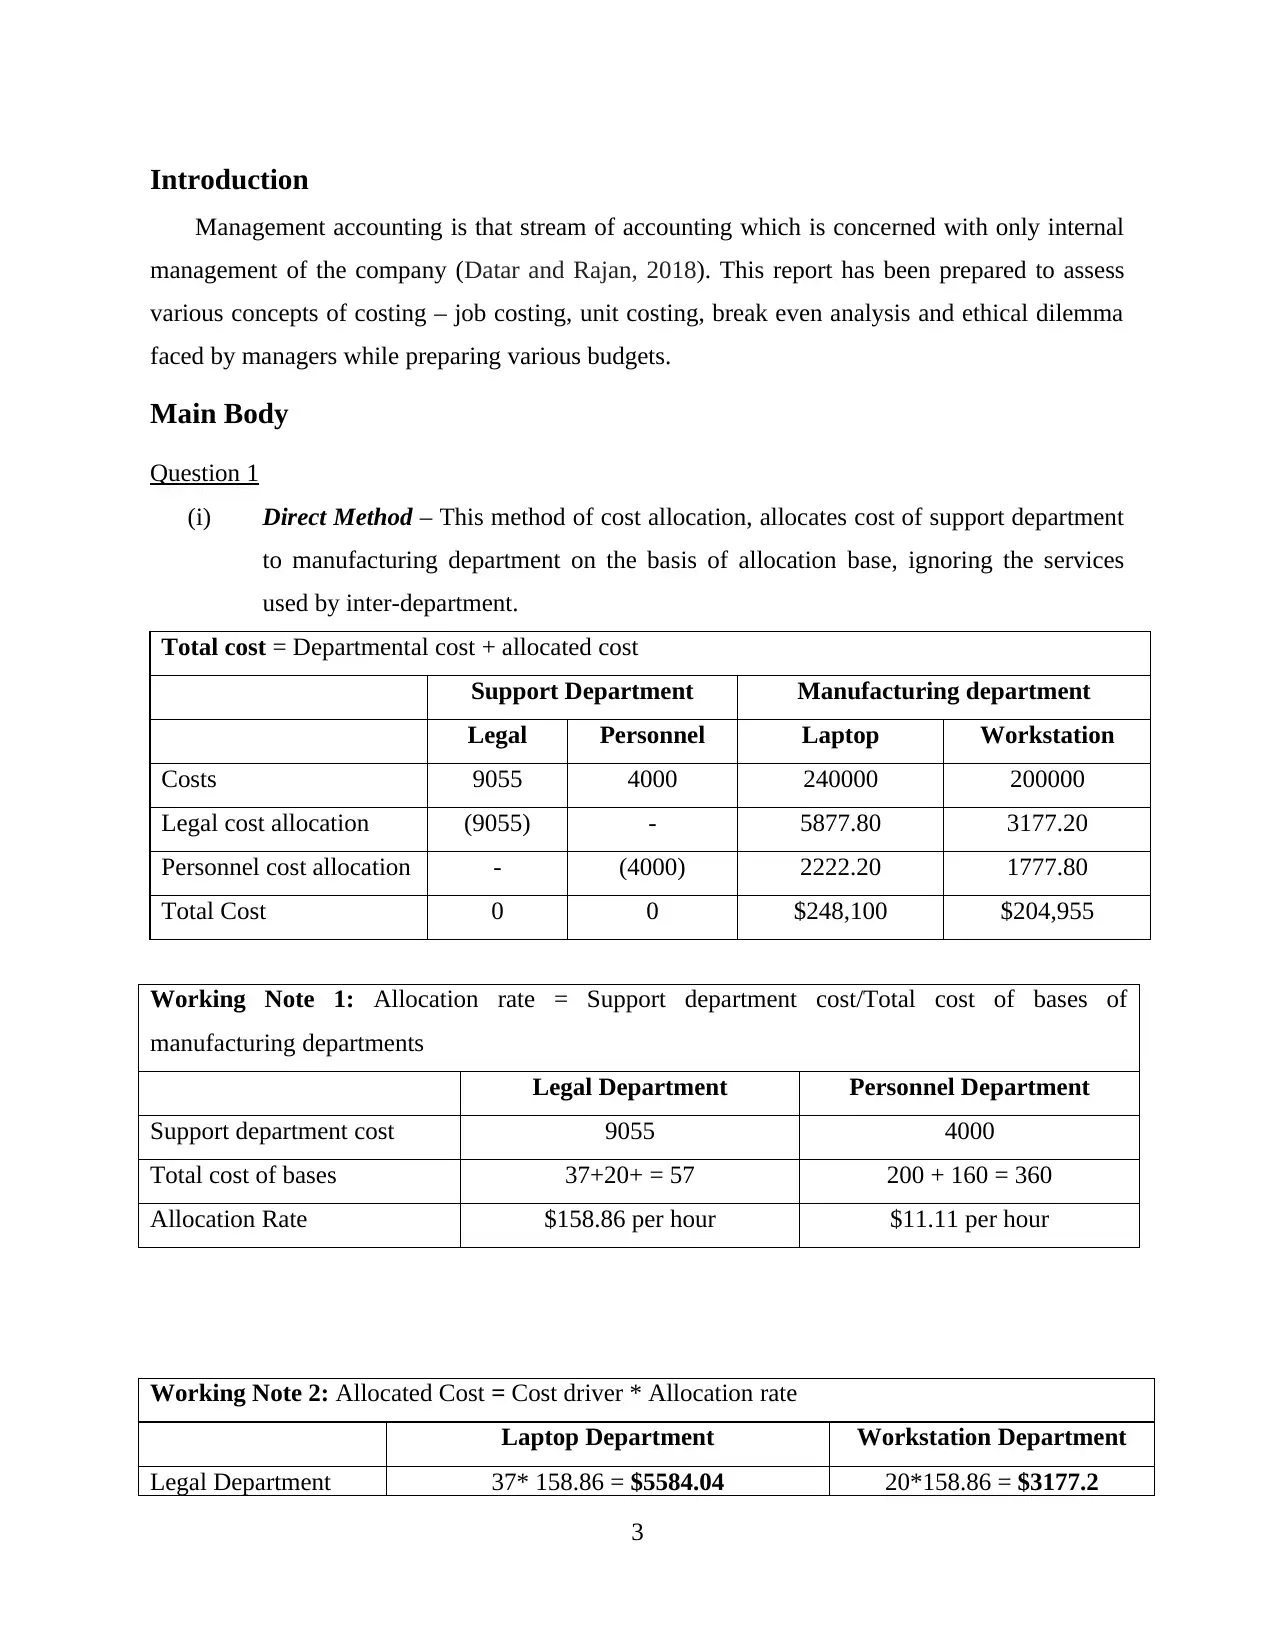
Personnel Department 200*11.11 = $2222.20 160*11.11 = $1777.80
(ii) Step Down Method – This method allocates costs of support department to
manufacturing departments in a sequential manner (Fisher and Krumwiede, 2015).
Total cost = Departmental cost + allocated cost
Support Department Manufacturing department
Legal Personnel Laptop Workstation
Costs 9055 4000 240000 200000
Legal cost allocation (9055) 452.56 5584.04 3018.4
Personnel cost allocation - (4452.56) 2473.64 1978.92
Total Cost 0 0 $248,057.68 $204,997.32
Working Note 1: Allocation rate of highest department = Support department cost/Total cost of
bases of manufacturing departments
Legal Department
Support department cost 9055
Total cost of bases 37+20+3 = 60
Allocation Rate $150.92 per hour
Working Note 2: Allocated Cost = Cost driver * Allocation rate
Personnel Department Laptop Department Workstation
Department
Legal Department 3*150.92 = $452.56 37* 150.92 = $5584.04 20*150.92 = $3018.4
Working Note 3:
Personnel Department
Support department cost 4452.56
Total cost of bases 200+160 = 360
Allocation Rate $12.37 per hour
4
Paraphrase This Document
Need a fresh take? Get an instant paraphrase of this document with our AI Paraphraser
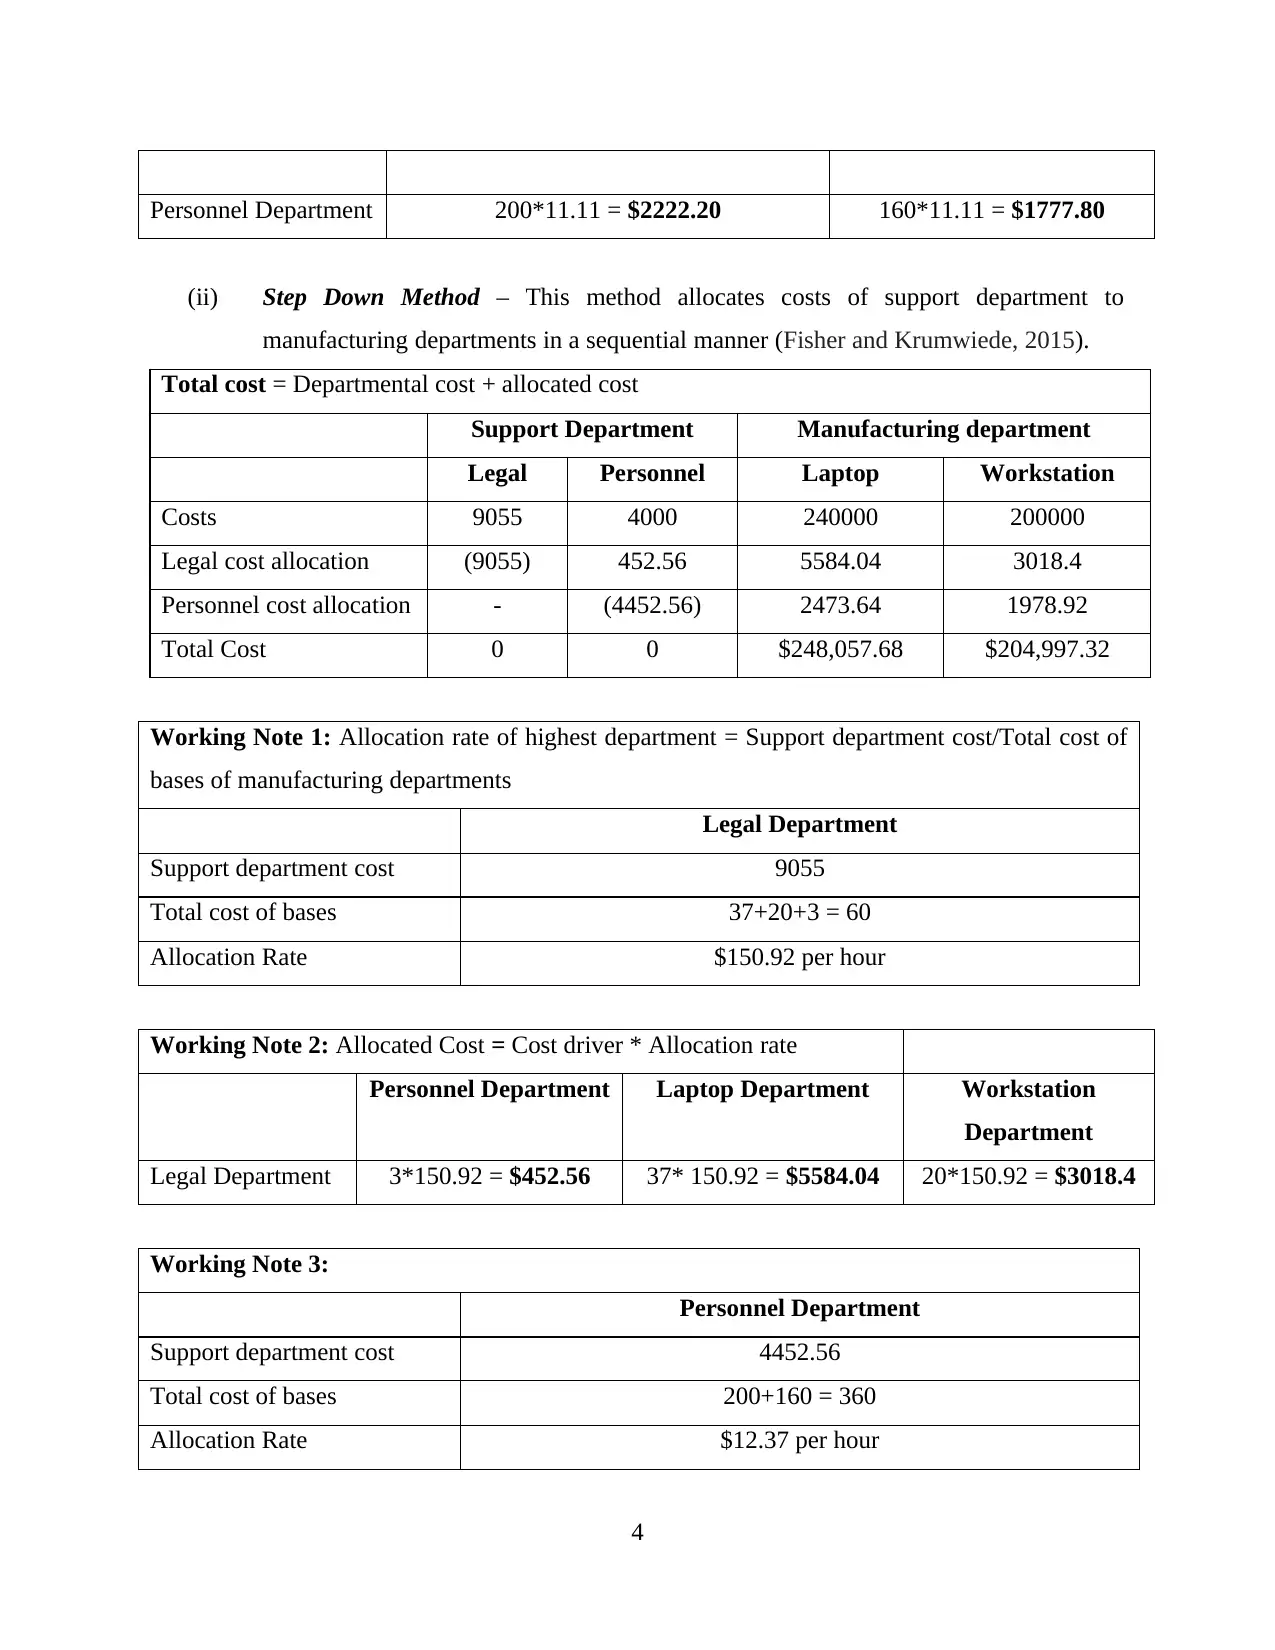
Working Note 4:
Laptop Department Workstation Department
Personnel Department 200*12.37 = $2473.64 160*12.37 = $1978.92
(iii) Reciprocal Method – This method determines relationship between support
departments to allocate the cost. It is most accurate but most complicated method of
cost allocation (Kim, Y.W., 2017).
Total cost = Departmental cost + allocated cost
Support Department Manufacturing department
Legal Personnel Laptop Workstation
Costs 9055 4000 240000 200000
Legal cost allocated (9502.51) 475.13 5860.20 3167.18
Personnel cost allocated 447.51 (4475.13) 2237.56 1790.06
Total Cost 0 0 $248,097.76 $204,957.24
Working Note 1: Determination of allocation bases
Legal Department Personnel Department
Legal hours Percentage of total Personnel hours Percentage of total
Legal - - 40 10
Personnel 3 5 - -
Laptop 37 61.67 200 50
Workstation 20 33.33 160 40
Total 60 100 400 100
Working Note 2: Calculations
a. Total legal cost = legal department cost + cost to allocated to legal department from
personnel
b. Total personnel cost (TPC) = personnel department cost + cost to allocated to personnel
department from legal
Total personnel cost = $4000 + (5% of total legal cost)
5
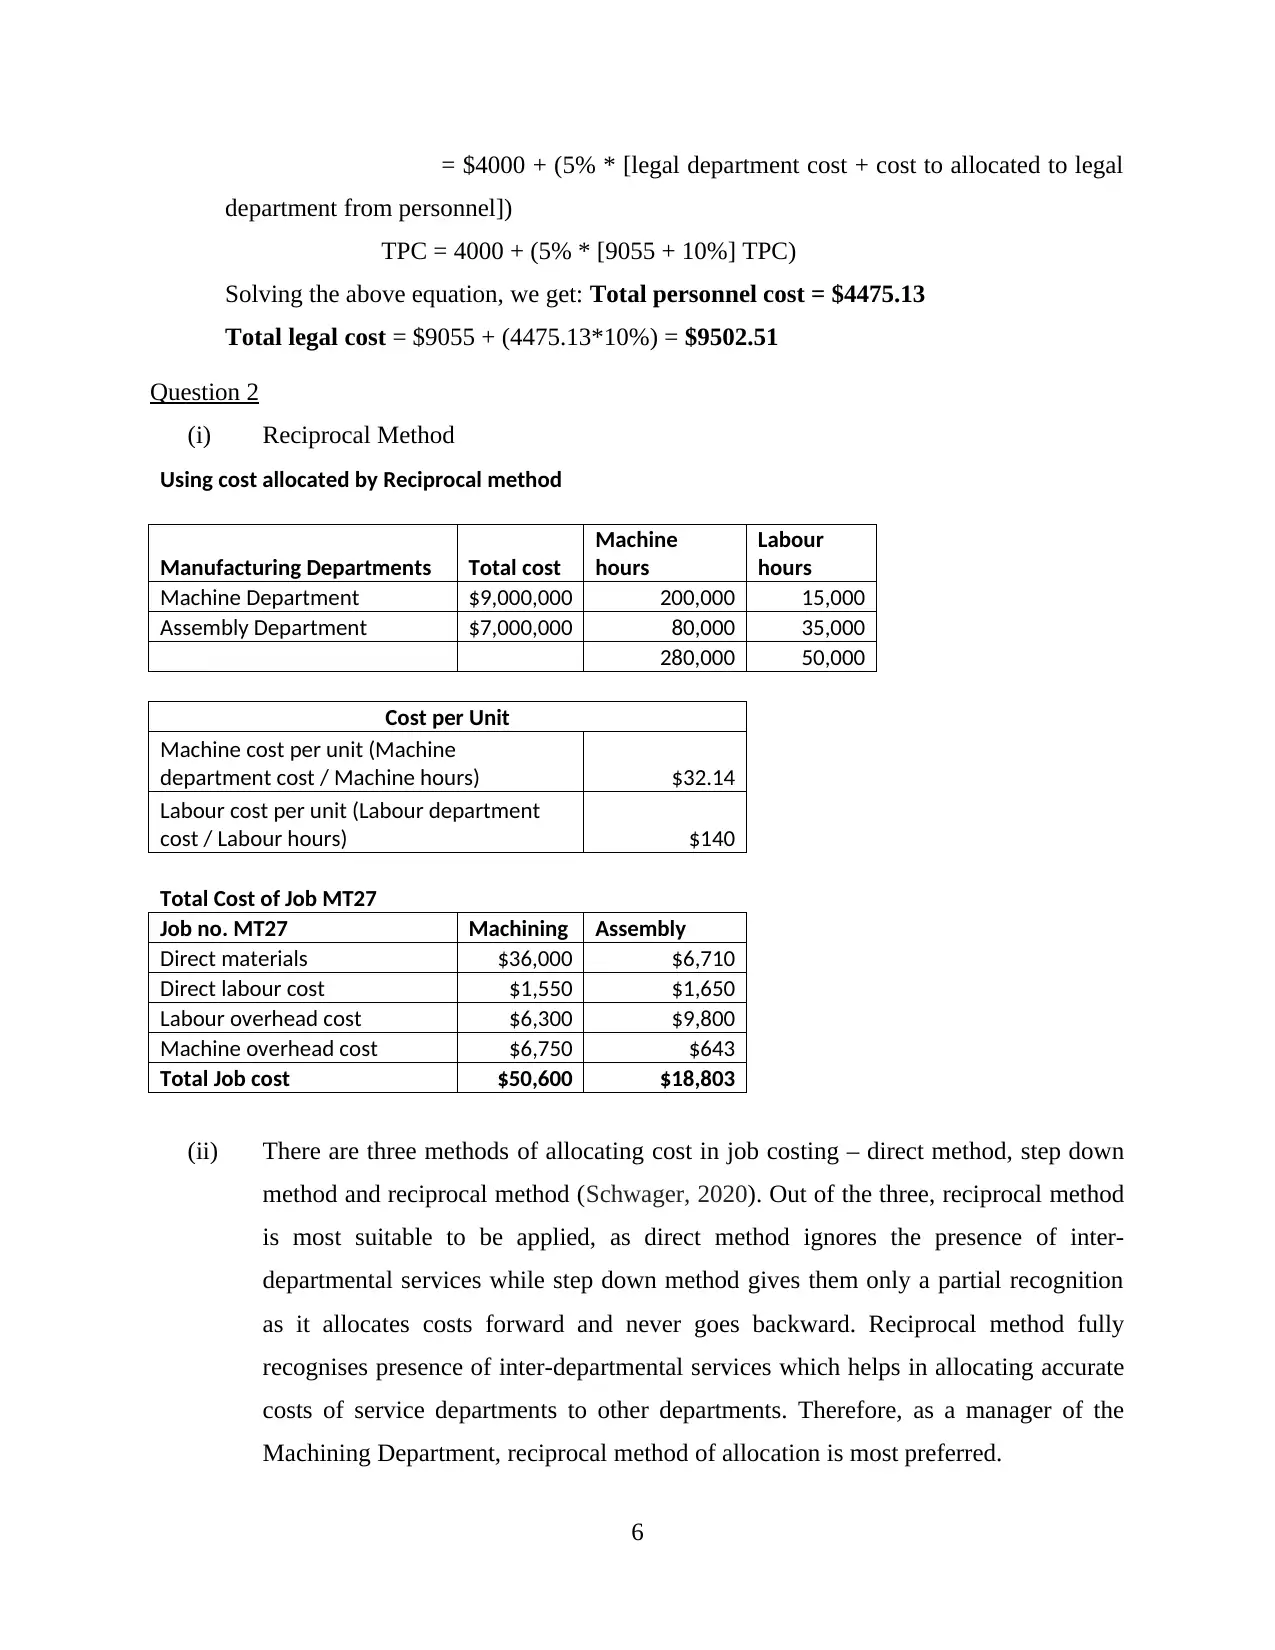
= $4000 + (5% * [legal department cost + cost to allocated to legal
department from personnel])
TPC = 4000 + (5% * [9055 + 10%] TPC)
Solving the above equation, we get: Total personnel cost = $4475.13
Total legal cost = $9055 + (4475.13*10%) = $9502.51
Question 2
(i) Reciprocal Method
Using cost allocated by Reciprocal method
Manufacturing Departments Total cost
Machine
hours
Labour
hours
Machine Department $9,000,000 200,000 15,000
Assembly Department $7,000,000 80,000 35,000
280,000 50,000
Cost per Unit
Machine cost per unit (Machine
department cost / Machine hours) $32.14
Labour cost per unit (Labour department
cost / Labour hours) $140
Total Cost of Job MT27
Job no. MT27 Machining Assembly
Direct materials $36,000 $6,710
Direct labour cost $1,550 $1,650
Labour overhead cost $6,300 $9,800
Machine overhead cost $6,750 $643
Total Job cost $50,600 $18,803
(ii) There are three methods of allocating cost in job costing – direct method, step down
method and reciprocal method (Schwager, 2020). Out of the three, reciprocal method
is most suitable to be applied, as direct method ignores the presence of inter-
departmental services while step down method gives them only a partial recognition
as it allocates costs forward and never goes backward. Reciprocal method fully
recognises presence of inter-departmental services which helps in allocating accurate
costs of service departments to other departments. Therefore, as a manager of the
Machining Department, reciprocal method of allocation is most preferred.
6
⊘ This is a preview!⊘
Do you want full access?
Subscribe today to unlock all pages.
Trusted by 1+ million students worldwide
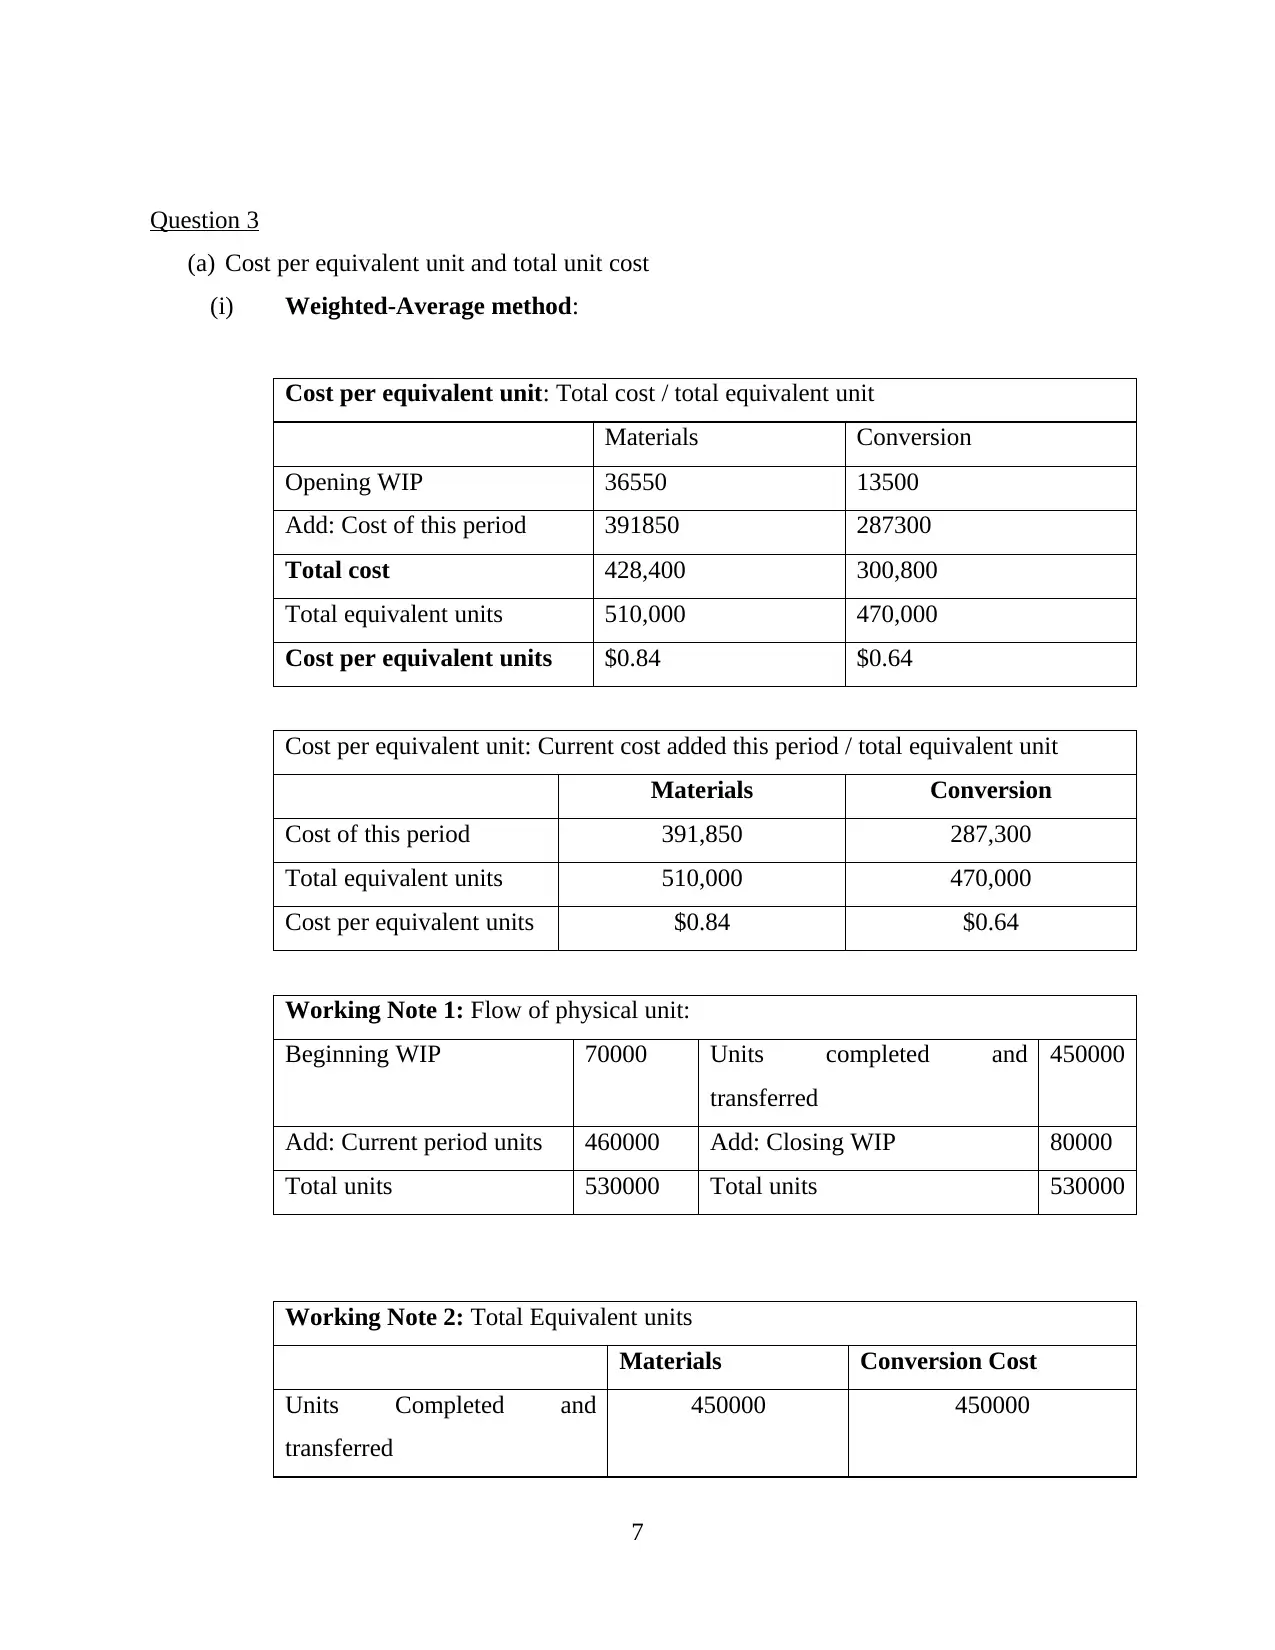
Question 3
(a) Cost per equivalent unit and total unit cost
(i) Weighted-Average method:
Cost per equivalent unit: Total cost / total equivalent unit
Materials Conversion
Opening WIP 36550 13500
Add: Cost of this period 391850 287300
Total cost 428,400 300,800
Total equivalent units 510,000 470,000
Cost per equivalent units $0.84 $0.64
Cost per equivalent unit: Current cost added this period / total equivalent unit
Materials Conversion
Cost of this period 391,850 287,300
Total equivalent units 510,000 470,000
Cost per equivalent units $0.84 $0.64
Working Note 1: Flow of physical unit:
Beginning WIP 70000 Units completed and
transferred
450000
Add: Current period units 460000 Add: Closing WIP 80000
Total units 530000 Total units 530000
Working Note 2: Total Equivalent units
Materials Conversion Cost
Units Completed and
transferred
450000 450000
7
Paraphrase This Document
Need a fresh take? Get an instant paraphrase of this document with our AI Paraphraser
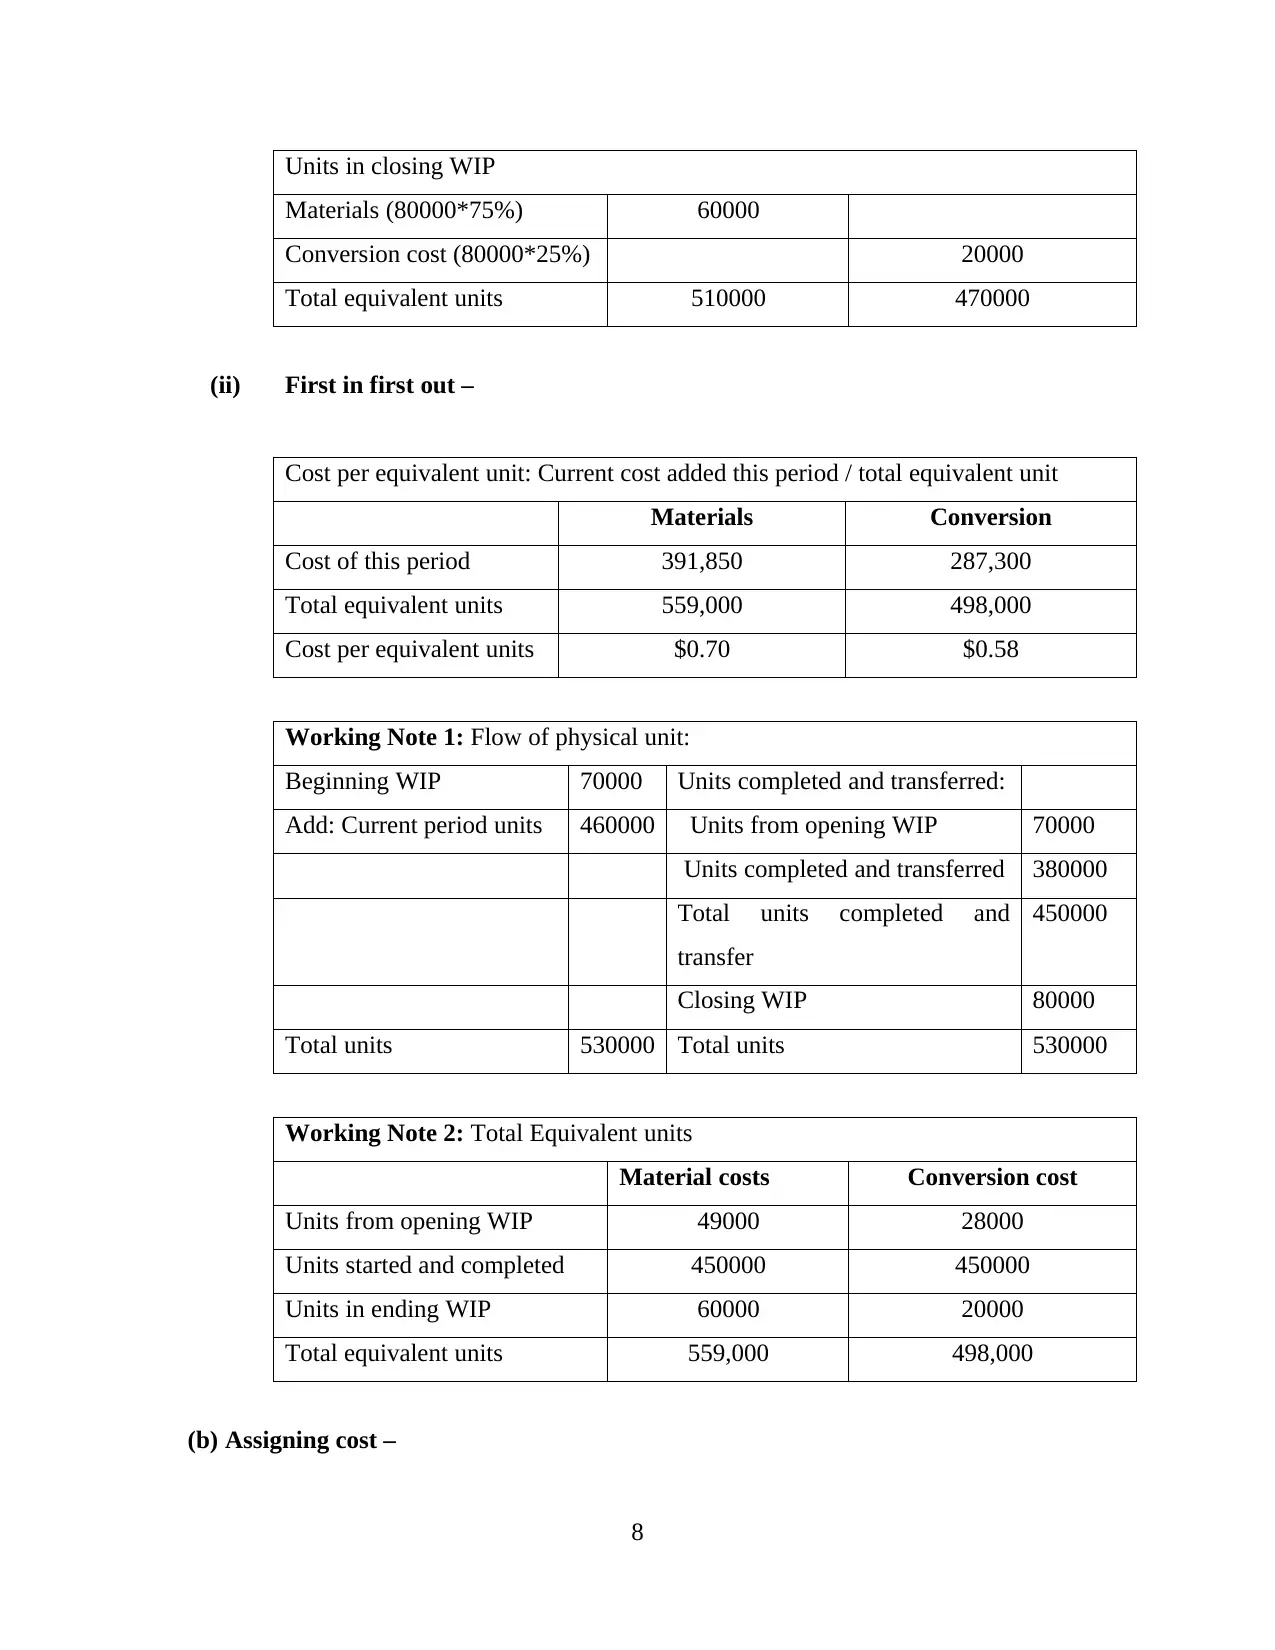
Units in closing WIP
Materials (80000*75%) 60000
Conversion cost (80000*25%) 20000
Total equivalent units 510000 470000
(ii) First in first out –
Cost per equivalent unit: Current cost added this period / total equivalent unit
Materials Conversion
Cost of this period 391,850 287,300
Total equivalent units 559,000 498,000
Cost per equivalent units $0.70 $0.58
Working Note 1: Flow of physical unit:
Beginning WIP 70000 Units completed and transferred:
Add: Current period units 460000 Units from opening WIP 70000
Units completed and transferred 380000
Total units completed and
transfer
450000
Closing WIP 80000
Total units 530000 Total units 530000
Working Note 2: Total Equivalent units
Material costs Conversion cost
Units from opening WIP 49000 28000
Units started and completed 450000 450000
Units in ending WIP 60000 20000
Total equivalent units 559,000 498,000
(b) Assigning cost –
8
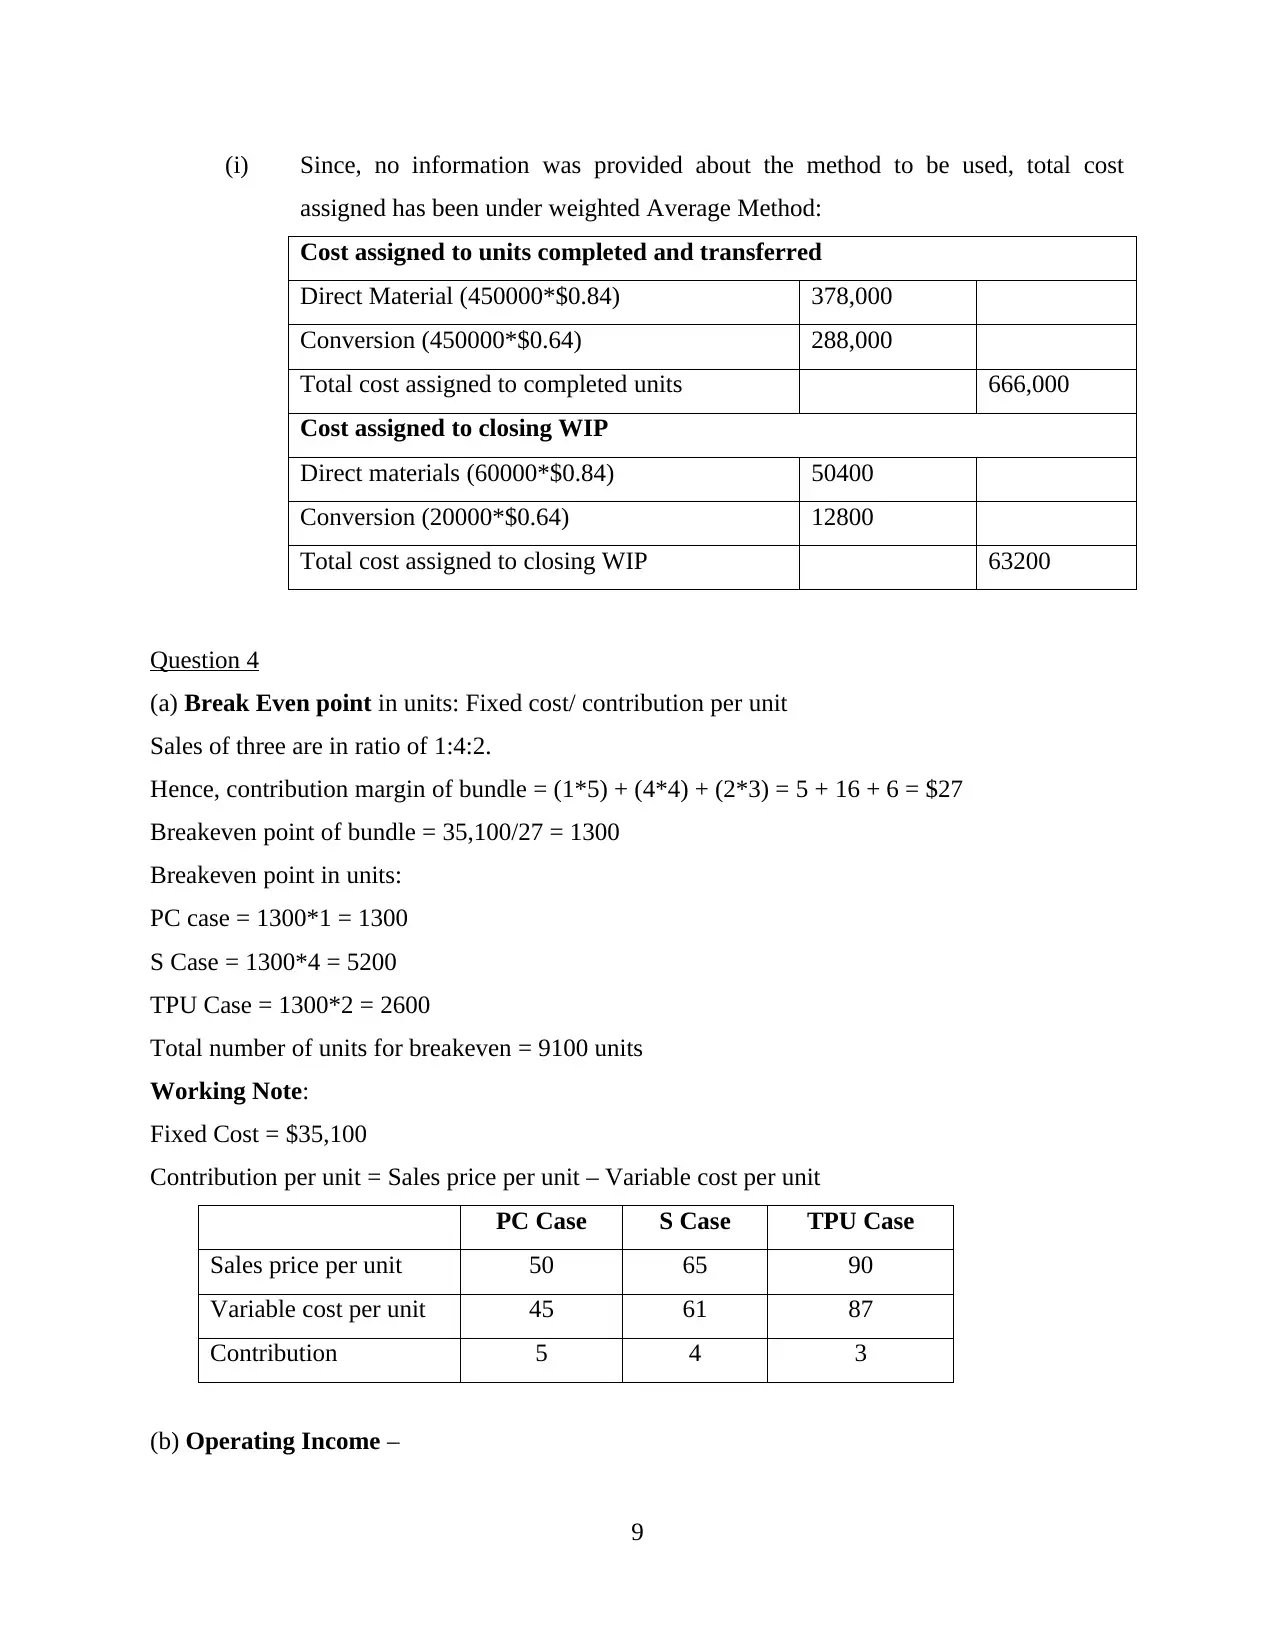
(i) Since, no information was provided about the method to be used, total cost
assigned has been under weighted Average Method:
Cost assigned to units completed and transferred
Direct Material (450000*$0.84) 378,000
Conversion (450000*$0.64) 288,000
Total cost assigned to completed units 666,000
Cost assigned to closing WIP
Direct materials (60000*$0.84) 50400
Conversion (20000*$0.64) 12800
Total cost assigned to closing WIP 63200
Question 4
(a) Break Even point in units: Fixed cost/ contribution per unit
Sales of three are in ratio of 1:4:2.
Hence, contribution margin of bundle = (1*5) + (4*4) + (2*3) = 5 + 16 + 6 = $27
Breakeven point of bundle = 35,100/27 = 1300
Breakeven point in units:
PC case = 1300*1 = 1300
S Case = 1300*4 = 5200
TPU Case = 1300*2 = 2600
Total number of units for breakeven = 9100 units
Working Note:
Fixed Cost = $35,100
Contribution per unit = Sales price per unit – Variable cost per unit
PC Case S Case TPU Case
Sales price per unit 50 65 90
Variable cost per unit 45 61 87
Contribution 5 4 3
(b) Operating Income –
9
⊘ This is a preview!⊘
Do you want full access?
Subscribe today to unlock all pages.
Trusted by 1+ million students worldwide
Particulars Amount
Sales:
PC Case (2500*50) 125000
S Case (10000*65) 650000
TPU Case (5000*90) 450000 1,225,000
Less: Variable Cost
PC Case (2500*45) 112500
S Case (10000*61) 610000
TPU Case (5000*87) 435000 (1,157,500)
Less: Fixed Cost (35,100)
Operating Income 32,400
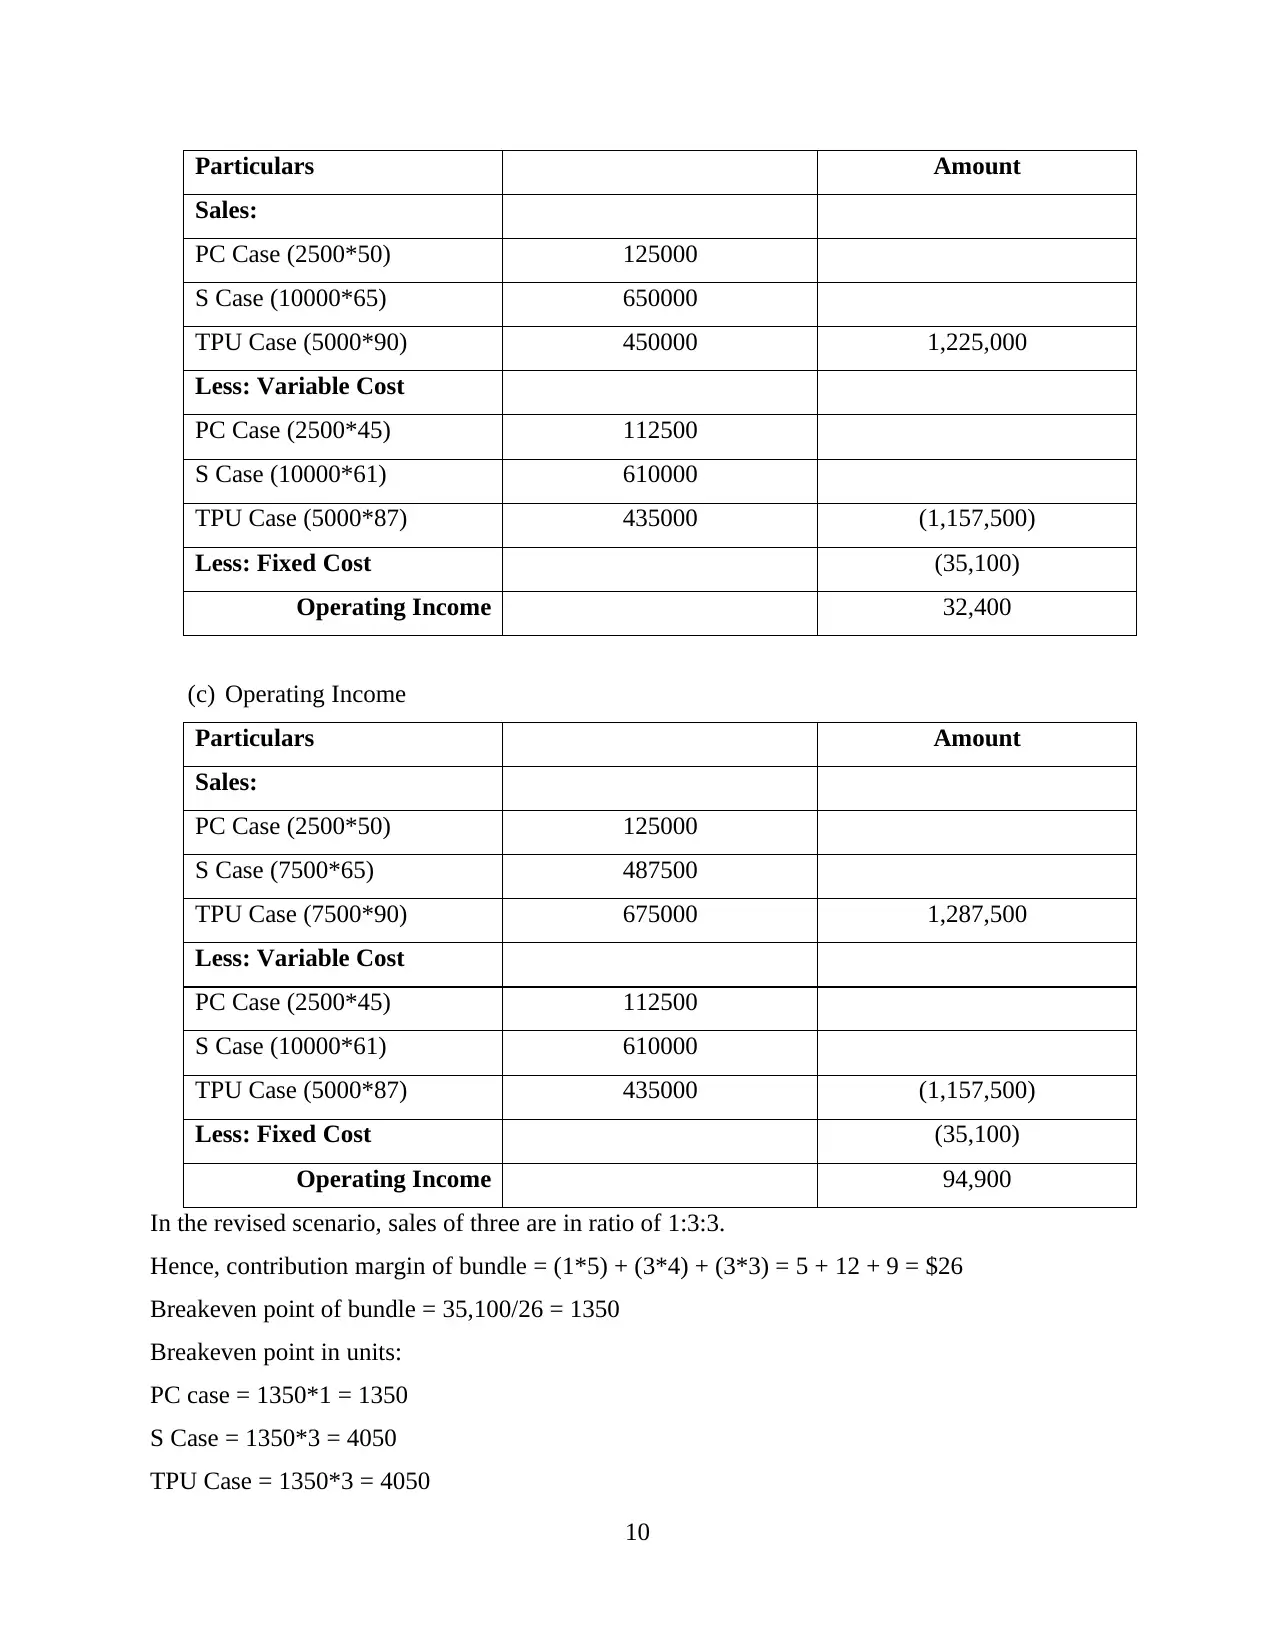
(c) Operating Income
Particulars Amount
Sales:
PC Case (2500*50) 125000
S Case (7500*65) 487500
TPU Case (7500*90) 675000 1,287,500
Less: Variable Cost
PC Case (2500*45) 112500
S Case (10000*61) 610000
TPU Case (5000*87) 435000 (1,157,500)
Less: Fixed Cost (35,100)
Operating Income 94,900
In the revised scenario, sales of three are in ratio of 1:3:3.
Hence, contribution margin of bundle = (1*5) + (3*4) + (3*3) = 5 + 12 + 9 = $26
Breakeven point of bundle = 35,100/26 = 1350
Breakeven point in units:
PC case = 1350*1 = 1350
S Case = 1350*3 = 4050
TPU Case = 1350*3 = 4050
10
Sales:
PC Case (2500*50) 125000
S Case (10000*65) 650000
TPU Case (5000*90) 450000 1,225,000
Less: Variable Cost
PC Case (2500*45) 112500
S Case (10000*61) 610000
TPU Case (5000*87) 435000 (1,157,500)
Less: Fixed Cost (35,100)
Operating Income 32,400
(c) Operating Income
Particulars Amount
Sales:
PC Case (2500*50) 125000
S Case (7500*65) 487500
TPU Case (7500*90) 675000 1,287,500
Less: Variable Cost
PC Case (2500*45) 112500
S Case (10000*61) 610000
TPU Case (5000*87) 435000 (1,157,500)
Less: Fixed Cost (35,100)
Operating Income 94,900
In the revised scenario, sales of three are in ratio of 1:3:3.
Hence, contribution margin of bundle = (1*5) + (3*4) + (3*3) = 5 + 12 + 9 = $26
Breakeven point of bundle = 35,100/26 = 1350
Breakeven point in units:
PC case = 1350*1 = 1350
S Case = 1350*3 = 4050
TPU Case = 1350*3 = 4050
10
Paraphrase This Document
Need a fresh take? Get an instant paraphrase of this document with our AI Paraphraser
Total number of units for breakeven = 9450 units
(d) No, it is not always better to choose the sales mix that yields the lower break-even point
because the above situation has ignored many aspects like demand for the product. The
company shall focus on maximising its sales of all three products and resultingly,
improving its operating income, even if it happens with sales mix with a higher
breakeven point (Batkovskiy and et.al., 2017).
Question 5
(a) In the given problem, a scenario is presented in which there is a slowdown in logistics
and supply chain process due to pandemic lockdown. CFO of the company is preparing
a master budget and has asked for sales estimates from manager of sales department,
Mr. John. Mr. John knows that due to pandemic not only supply slumps but also,
demand falls. He must have revised figures of demands of the company’s products for
current year. He can face a dilemma over estimating next year’s sales figure
considering uncertain market situation as well as he can have a dilemma over
deliberately reducing the demand figures considering the company’s policy that if
actual sales exceed budgeted sales, sales managers are rewarded. He has to choose
between his personal profit for a short term or cheating company which might result in
obstructing company’s operations in long run.
(b) If John chooses to behave unethically, CFO will end making up an incorrect budget. As
a consequence, there are two possibilities: first, demand actually shows up at lower
side and second, if actual demand exceeds the estimated and he gets rewarded,
company will suffer additional cost of bonus which is not actually due. Also, if demand
estimates are highly deflated, company might increase promotional efforts like offering
more discounts, which might be in favour of customers but not in the favour of the
company. All this will put additional stress on the company in the times when already
it is facing extra pressure from elongated supply chain and reduced demand (Weimer
and Vining, 2017).
11
Conclusion
From the above report, this can be concluded that cost accounting is one of the integral parts
of management accounting. It is used by different managers in different methods to find out
various results required. For example, in the above report, it can be concluded that reciprocal
method is most preferred method of cost allocation in job costing while also, realising that it is
not necessary to choose sales mix with lower break-even point.
12
⊘ This is a preview!⊘
Do you want full access?
Subscribe today to unlock all pages.
Trusted by 1+ million students worldwide
1 out of 13
Related Documents


Your All-in-One AI-Powered Toolkit for Academic Success.
+13062052269
info@desklib.com
Available 24*7 on WhatsApp / Email
![[object Object]](/_next/static/media/star-bottom.7253800d.svg)
Unlock your academic potential
Copyright © 2020–2026 A2Z Services. All Rights Reserved. Developed and managed by ZUCOL.