Detailed Budgeting and Financial Statement Analysis Solution
VerifiedAdded on 2023/05/29
|7
|900
|316
Homework Assignment
AI Summary
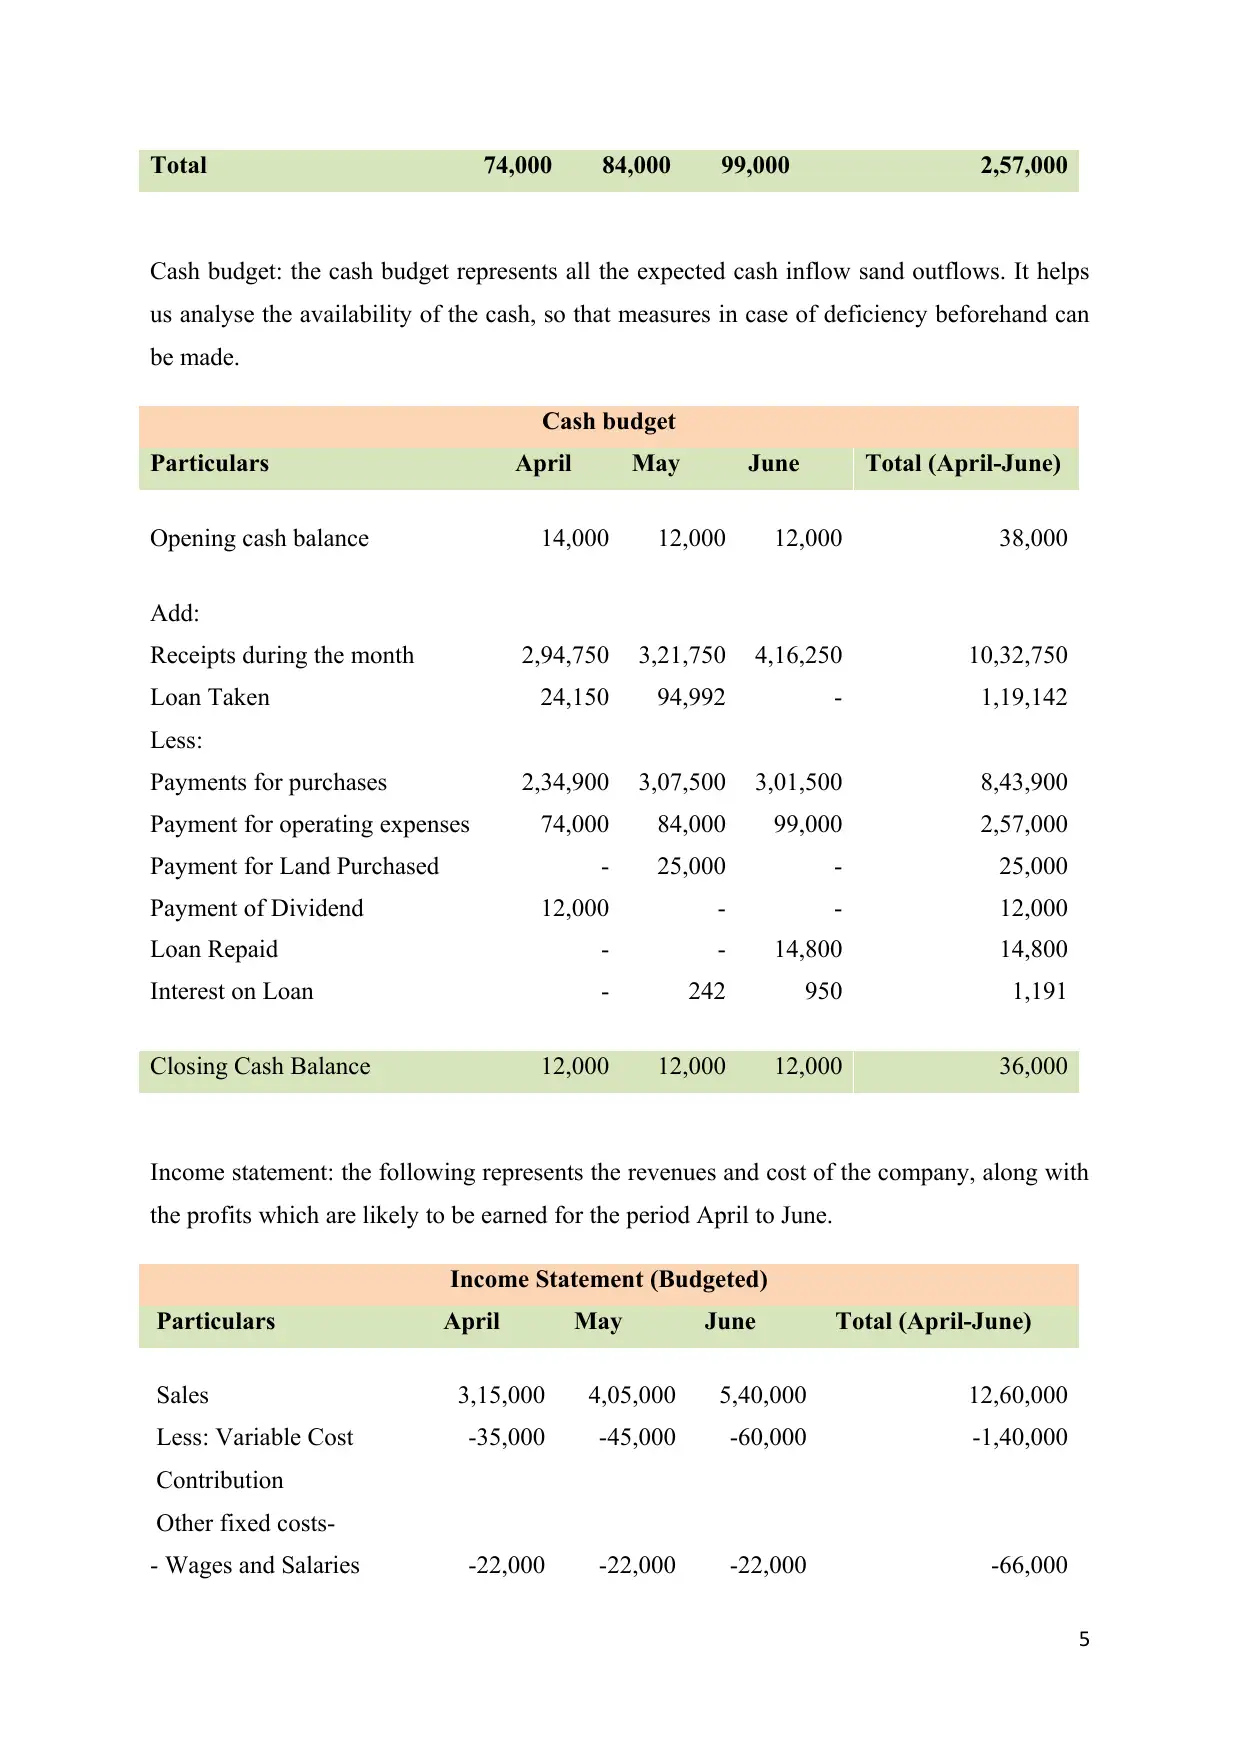
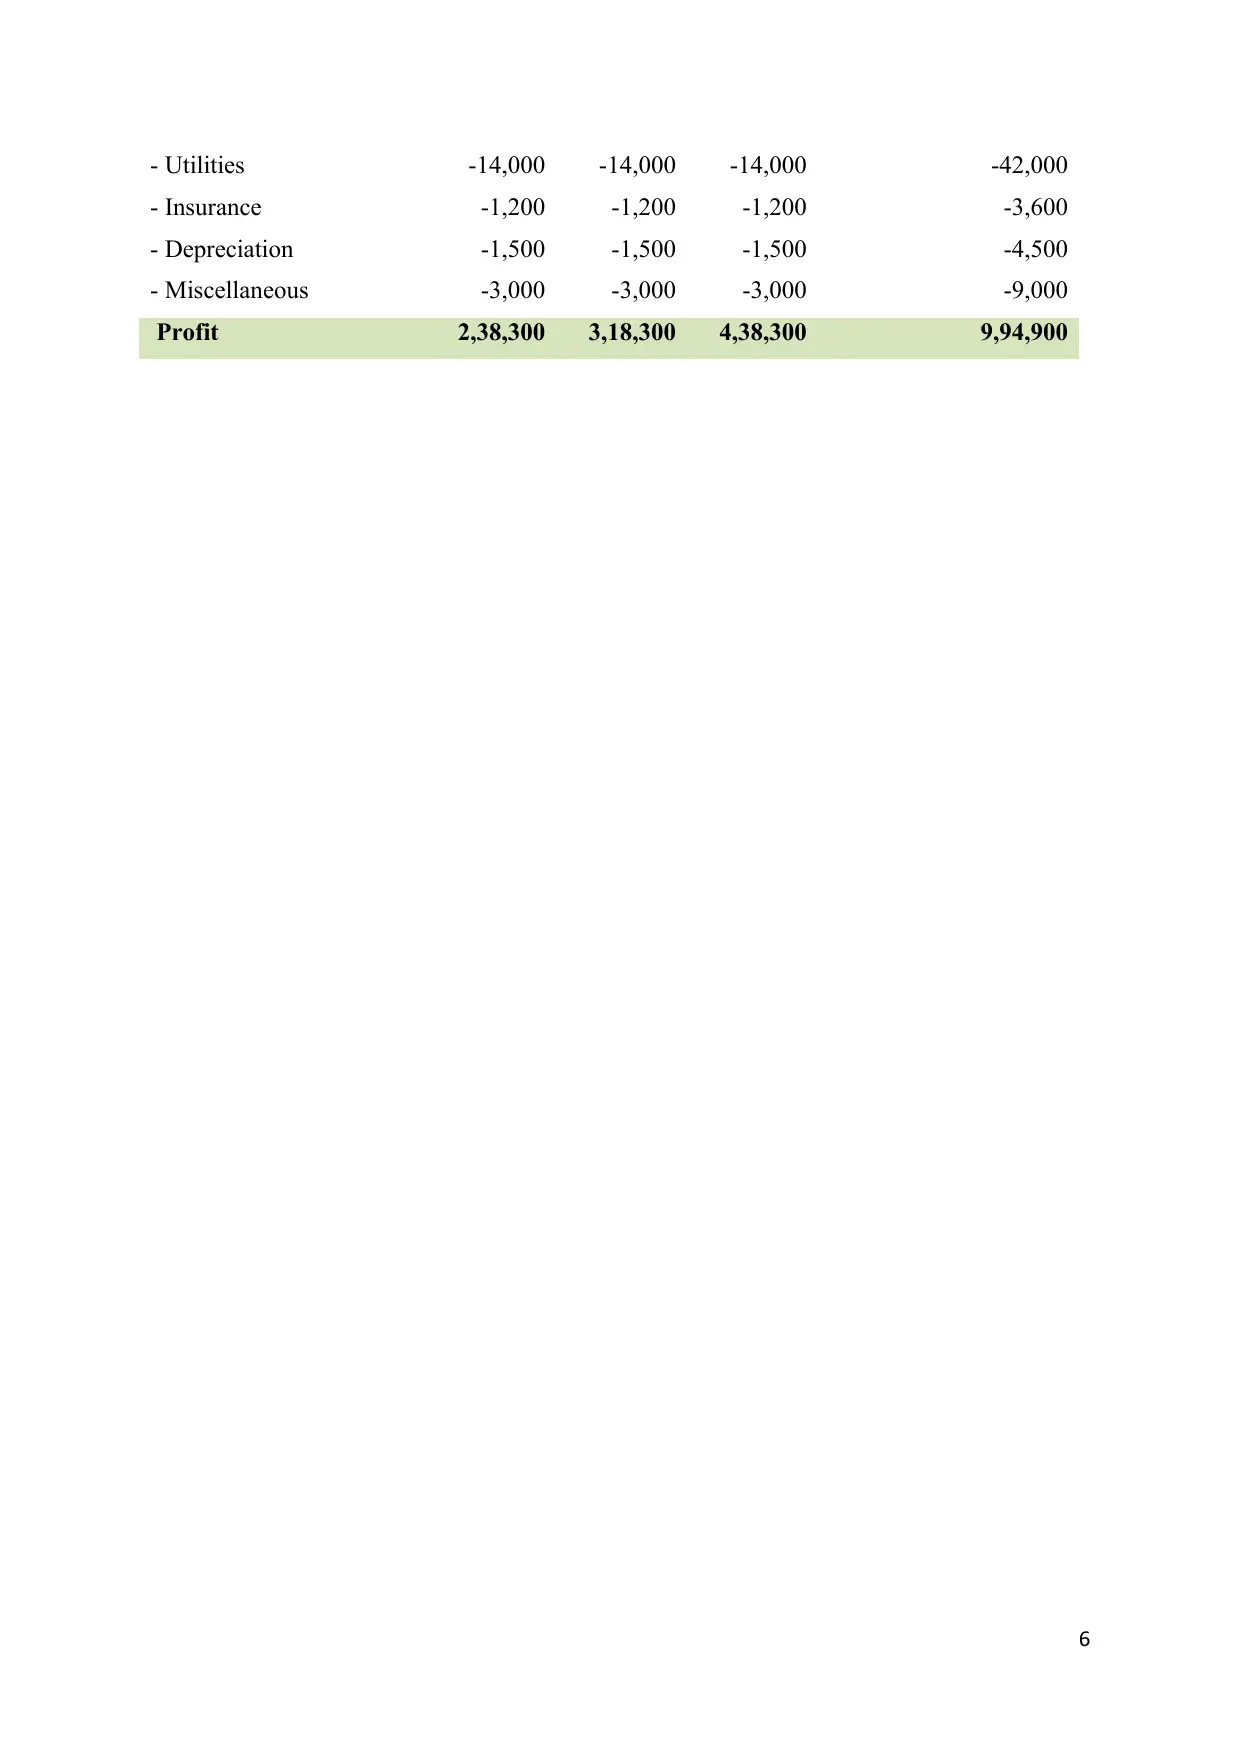
This document presents a solved assignment for Management Accounting 1, focusing on budgeting. It includes a sales budget, schedule of expected receipts, purchase budget, cash disbursement for purchases, operating expenses budget, cash disbursement for operating expenses, a cash budget, and a budgeted income statement for the months of April, May, and June. The assignment provides detailed calculations and schedules for sales, purchases, cash receipts and disbursements, and operating expenses, culminating in a projected income statement. The solution demonstrates the process of creating and linking various budgets to forecast financial performance and manage cash flow, offering a comprehensive overview of the budgeting process in management accounting. Desklib provides this and other solved assignments to aid students in their studies.
1 out of 7
Related Documents


Your All-in-One AI-Powered Toolkit for Academic Success.
+13062052269
info@desklib.com
Available 24*7 on WhatsApp / Email
![[object Object]](/_next/static/media/star-bottom.7253800d.svg)
Copyright © 2020–2026 A2Z Services. All Rights Reserved. Developed and managed by ZUCOL.