Management Accounting: Cost Calculation, Schedule Preparation, and Profit Analysis
VerifiedAdded on 2023/06/18
|13
|2547
|227
AI Summary
This article covers the calculation of variable cost per occupied bed, total fixed operating cost, total operating cost at 70% occupancy, cost computation, schedule preparation, income statement preparation, profit analysis using absorption costing and marginal costing, break-even point calculation, and more related to management accounting.
Contribute Materials
Your contribution can guide someone’s learning journey. Share your
documents today.

Management Accounting
Secure Best Marks with AI Grader
Need help grading? Try our AI Grader for instant feedback on your assignments.
Table of Contents
QUESTION 1..................................................................................................................................2
1)..................................................................................................................................................2
a) Calculation of Variable cost per occupied bed on a daily basis using high-low method........2
b) Calculation of total fixed operating cost per month using high-low method..........................2
2) Calculation of total operating cost at 70% occupancy............................................................2
3) Computation of following cost................................................................................................3
QUESTION 2..................................................................................................................................3
QUESTION 3..................................................................................................................................6
QUESTION 6..................................................................................................................................8
a) Calculation of Total Contribution for 2017.............................................................................8
b) Calculation of Break-even points in units...............................................................................9
c) Calculation of sales unit to make desired net profit................................................................9
d) Effect on break-even point if selling price reduced by 15%.................................................10
e) Calculation of break-even point in units if variable cost get increases by £2.25..................10
f) Meaning of contribution margin ratio and its uses in business planning...............................10
REFERENCES..............................................................................................................................12
1
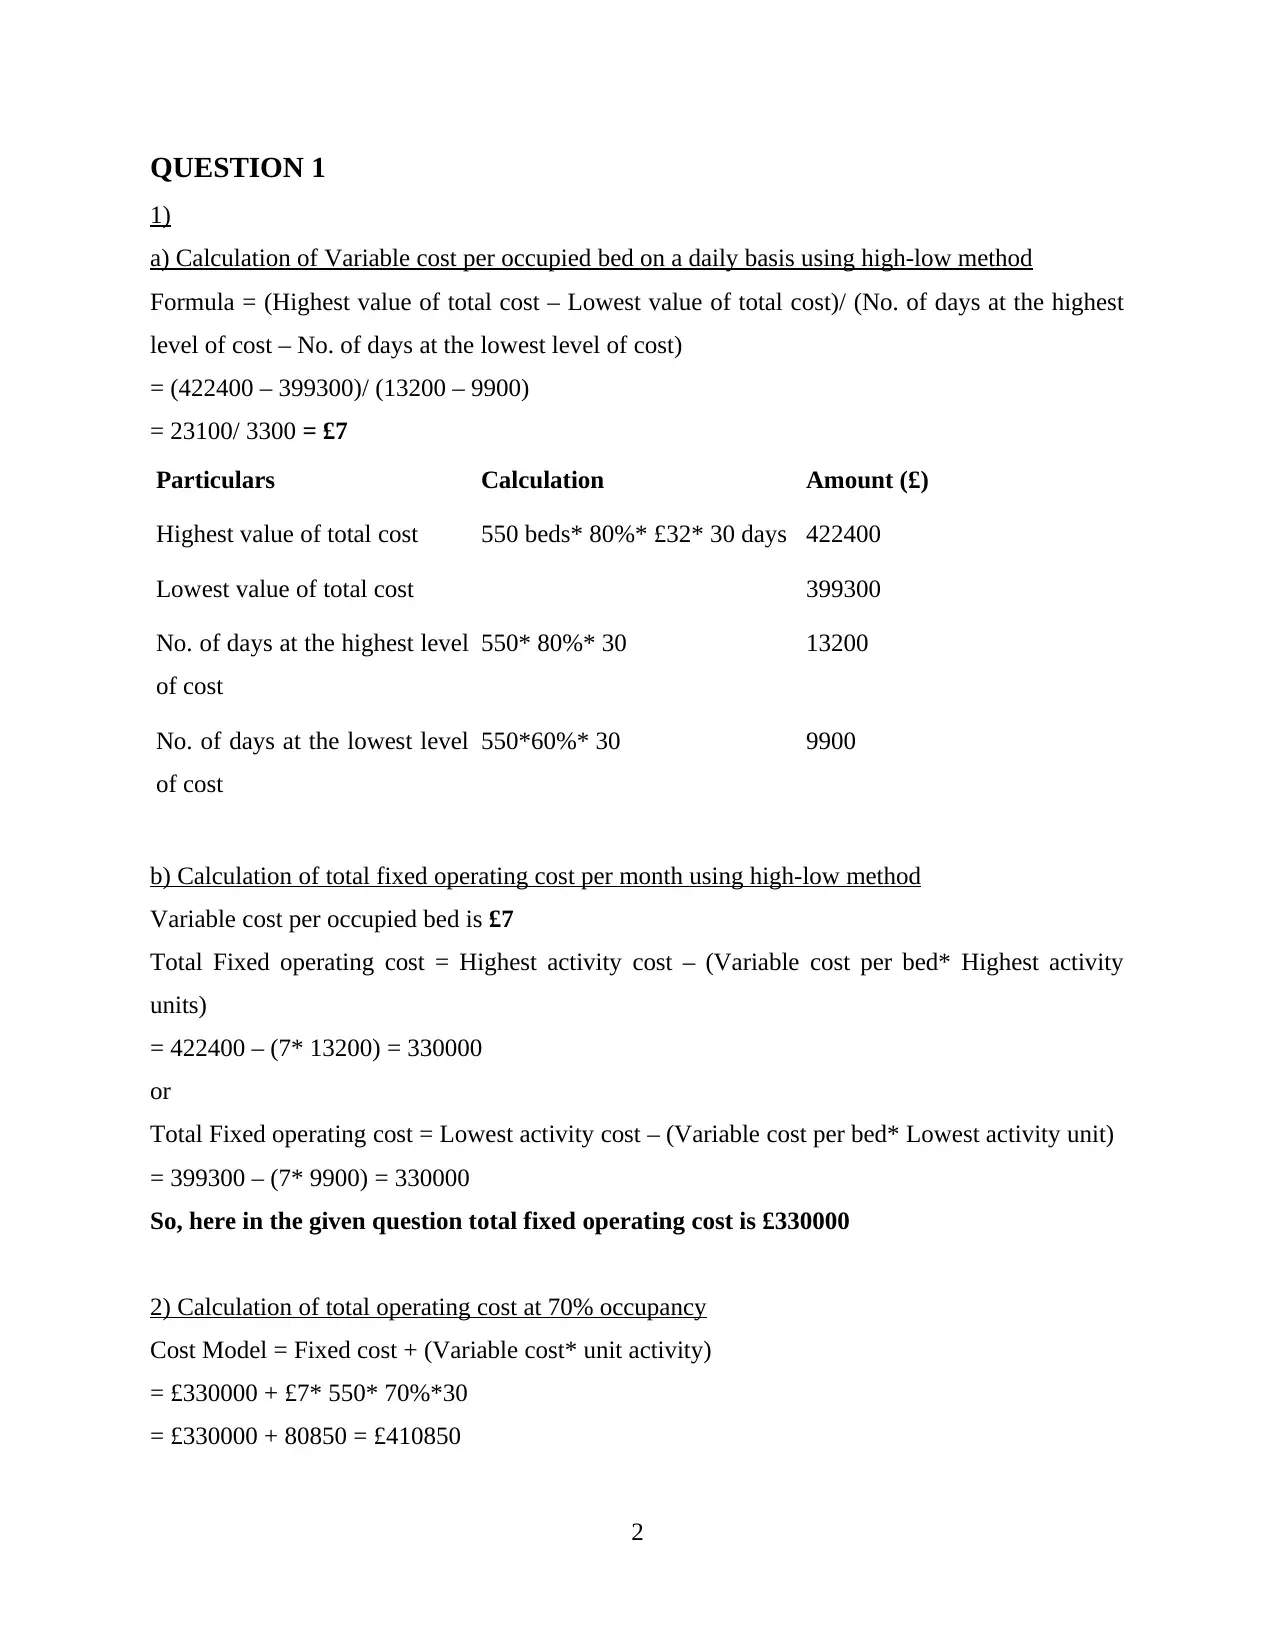
QUESTION 1
1)
a) Calculation of Variable cost per occupied bed on a daily basis using high-low method
Formula = (Highest value of total cost – Lowest value of total cost)/ (No. of days at the highest
level of cost – No. of days at the lowest level of cost)
= (422400 – 399300)/ (13200 – 9900)
= 23100/ 3300 = £7
Particulars Calculation Amount (£)
Highest value of total cost 550 beds* 80%* £32* 30 days 422400
Lowest value of total cost 399300
No. of days at the highest level
of cost
550* 80%* 30 13200
No. of days at the lowest level
of cost
550*60%* 30 9900
b) Calculation of total fixed operating cost per month using high-low method
Variable cost per occupied bed is £7
Total Fixed operating cost = Highest activity cost – (Variable cost per bed* Highest activity
units)
= 422400 – (7* 13200) = 330000
or
Total Fixed operating cost = Lowest activity cost – (Variable cost per bed* Lowest activity unit)
= 399300 – (7* 9900) = 330000
So, here in the given question total fixed operating cost is £330000
2) Calculation of total operating cost at 70% occupancy
Cost Model = Fixed cost + (Variable cost* unit activity)
= £330000 + £7* 550* 70%*30
= £330000 + 80850 = £410850
2
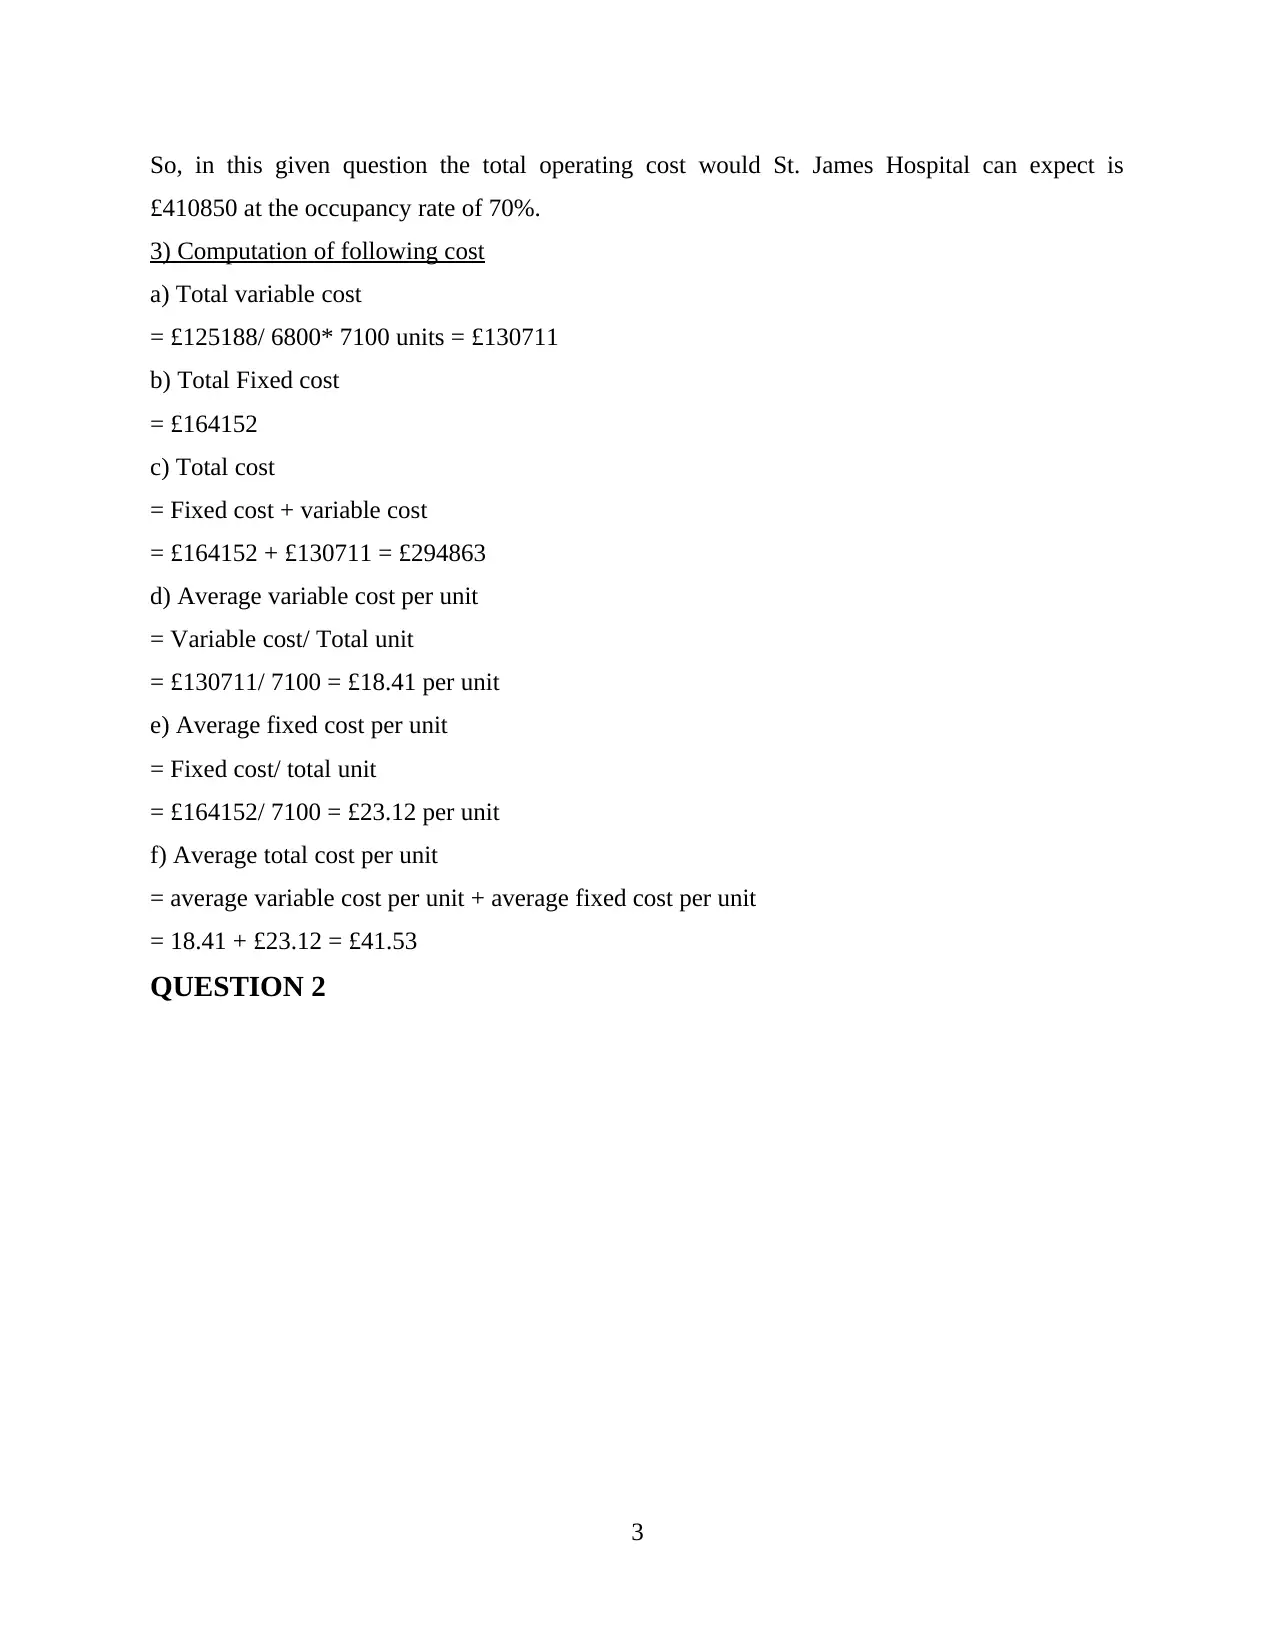
So, in this given question the total operating cost would St. James Hospital can expect is
£410850 at the occupancy rate of 70%.
3) Computation of following cost
a) Total variable cost
= £125188/ 6800* 7100 units = £130711
b) Total Fixed cost
= £164152
c) Total cost
= Fixed cost + variable cost
= £164152 + £130711 = £294863
d) Average variable cost per unit
= Variable cost/ Total unit
= £130711/ 7100 = £18.41 per unit
e) Average fixed cost per unit
= Fixed cost/ total unit
= £164152/ 7100 = £23.12 per unit
f) Average total cost per unit
= average variable cost per unit + average fixed cost per unit
= 18.41 + £23.12 = £41.53
QUESTION 2
3
Secure Best Marks with AI Grader
Need help grading? Try our AI Grader for instant feedback on your assignments.
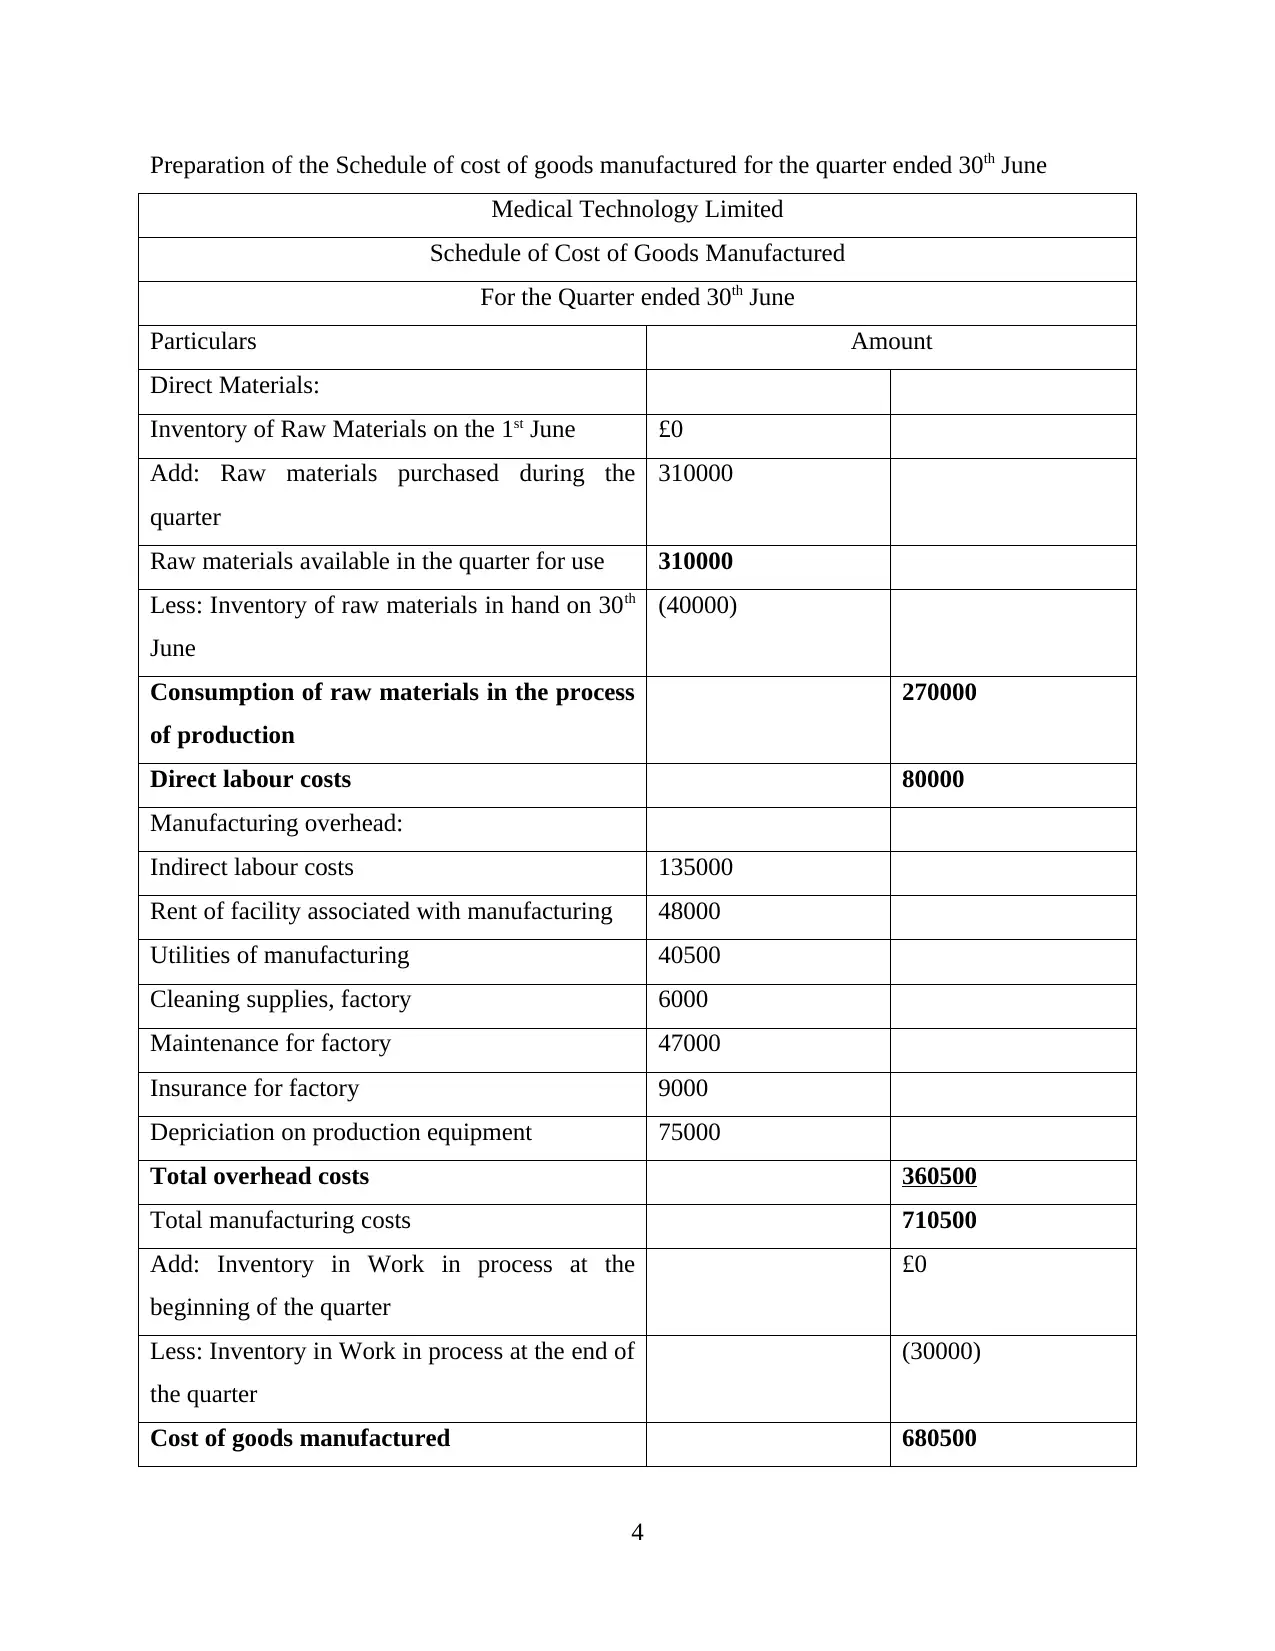
Preparation of the Schedule of cost of goods manufactured for the quarter ended 30th June
Medical Technology Limited
Schedule of Cost of Goods Manufactured
For the Quarter ended 30th June
Particulars Amount
Direct Materials:
Inventory of Raw Materials on the 1st June £0
Add: Raw materials purchased during the
quarter
310000
Raw materials available in the quarter for use 310000
Less: Inventory of raw materials in hand on 30th
June
(40000)
Consumption of raw materials in the process
of production
270000
Direct labour costs 80000
Manufacturing overhead:
Indirect labour costs 135000
Rent of facility associated with manufacturing 48000
Utilities of manufacturing 40500
Cleaning supplies, factory 6000
Maintenance for factory 47000
Insurance for factory 9000
Depriciation on production equipment 75000
Total overhead costs 360500
Total manufacturing costs 710500
Add: Inventory in Work in process at the
beginning of the quarter
£0
Less: Inventory in Work in process at the end of
the quarter
(30000)
Cost of goods manufactured 680500
4
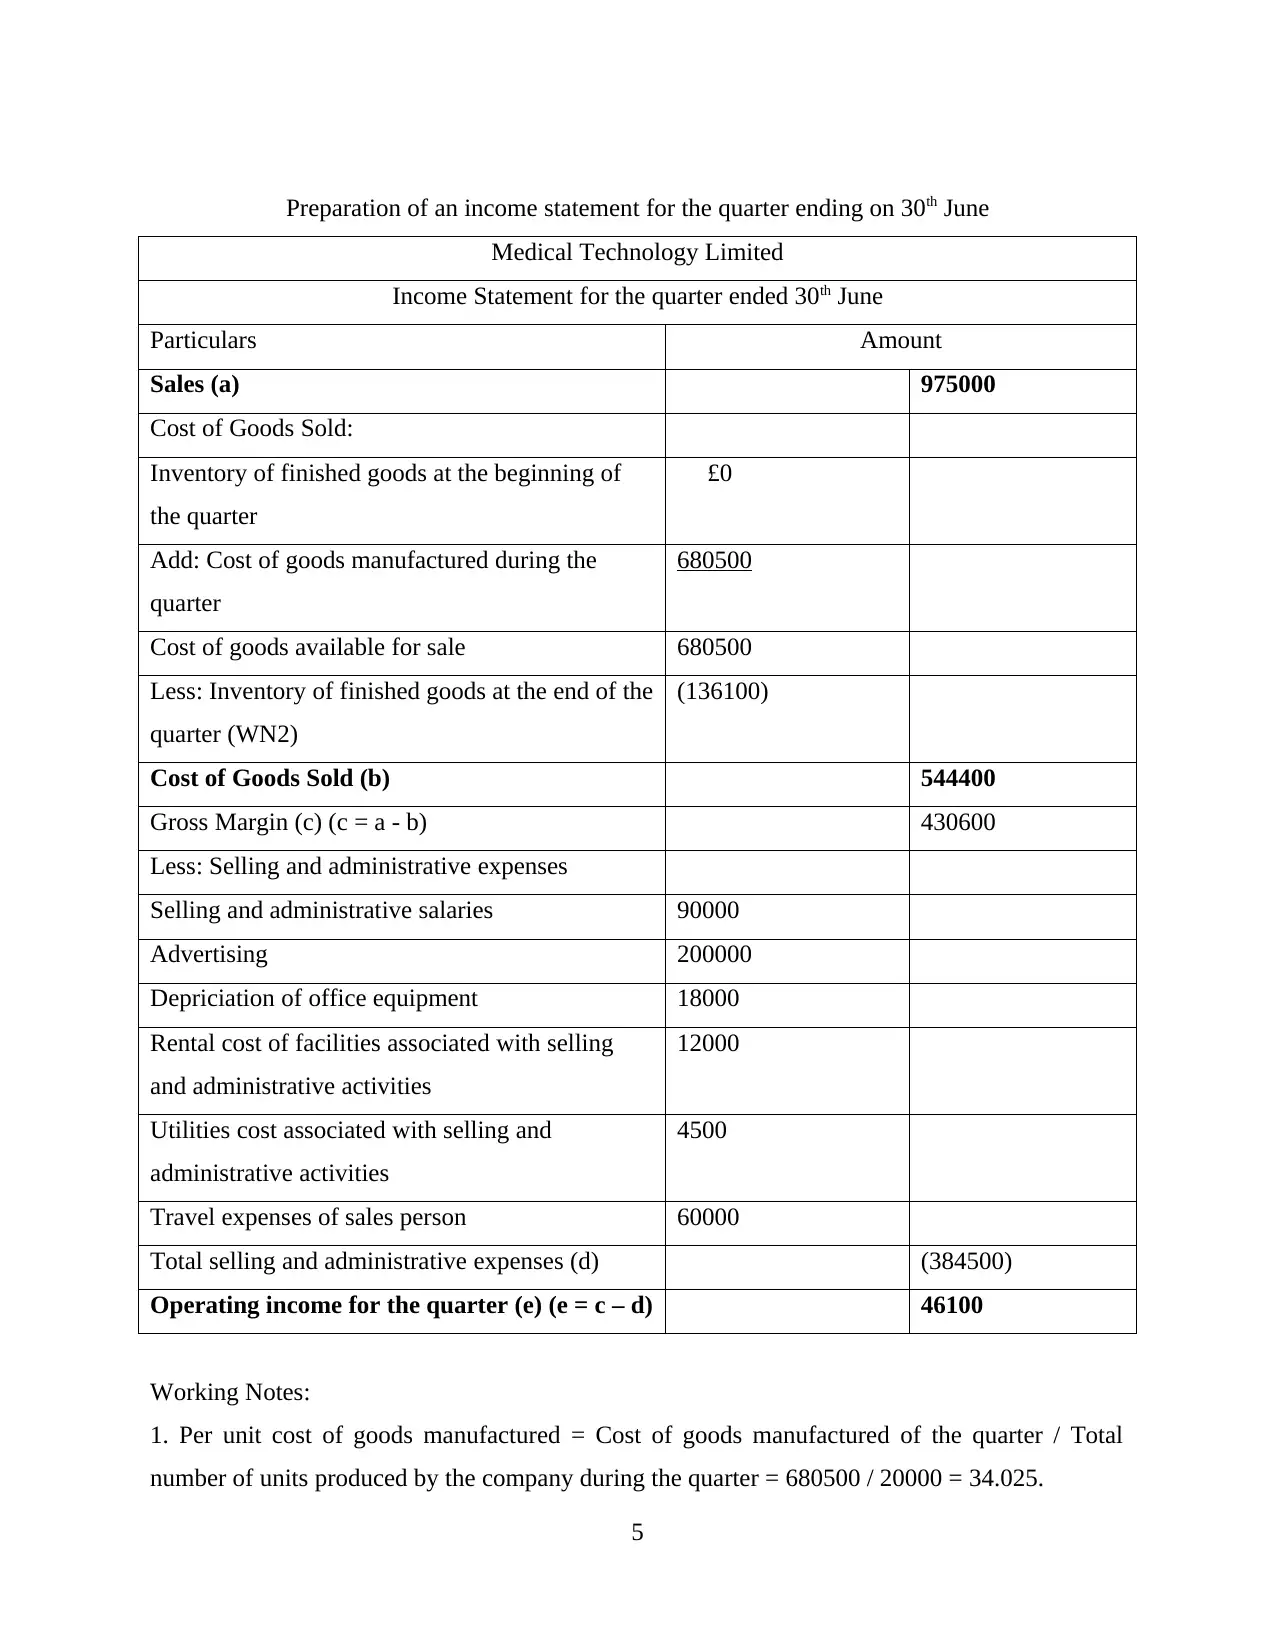
Preparation of an income statement for the quarter ending on 30th June
Medical Technology Limited
Income Statement for the quarter ended 30th June
Particulars Amount
Sales (a) 975000
Cost of Goods Sold:
Inventory of finished goods at the beginning of
the quarter
£0
Add: Cost of goods manufactured during the
quarter
680500
Cost of goods available for sale 680500
Less: Inventory of finished goods at the end of the
quarter (WN2)
(136100)
Cost of Goods Sold (b) 544400
Gross Margin (c) (c = a - b) 430600
Less: Selling and administrative expenses
Selling and administrative salaries 90000
Advertising 200000
Depriciation of office equipment 18000
Rental cost of facilities associated with selling
and administrative activities
12000
Utilities cost associated with selling and
administrative activities
4500
Travel expenses of sales person 60000
Total selling and administrative expenses (d) (384500)
Operating income for the quarter (e) (e = c – d) 46100
Working Notes:
1. Per unit cost of goods manufactured = Cost of goods manufactured of the quarter / Total
number of units produced by the company during the quarter = 680500 / 20000 = 34.025.
5
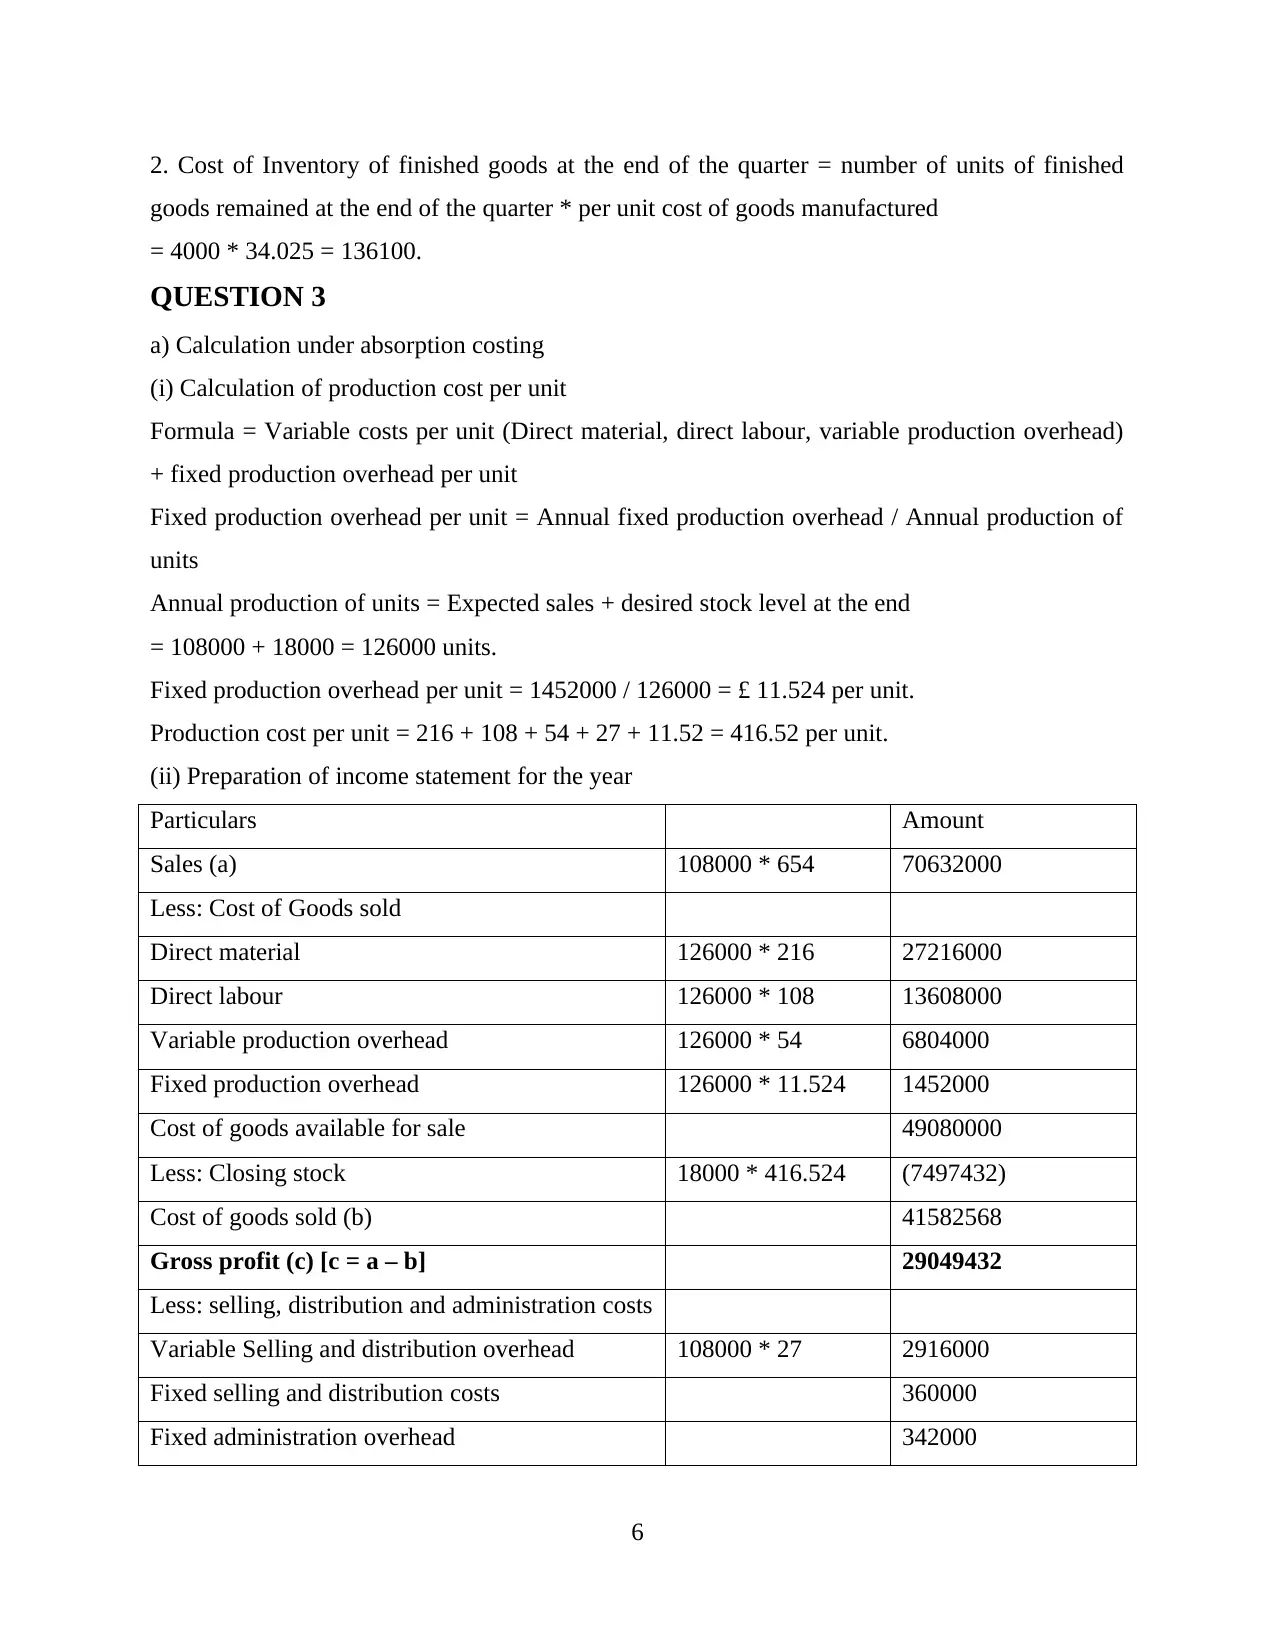
2. Cost of Inventory of finished goods at the end of the quarter = number of units of finished
goods remained at the end of the quarter * per unit cost of goods manufactured
= 4000 * 34.025 = 136100.
QUESTION 3
a) Calculation under absorption costing
(i) Calculation of production cost per unit
Formula = Variable costs per unit (Direct material, direct labour, variable production overhead)
+ fixed production overhead per unit
Fixed production overhead per unit = Annual fixed production overhead / Annual production of
units
Annual production of units = Expected sales + desired stock level at the end
= 108000 + 18000 = 126000 units.
Fixed production overhead per unit = 1452000 / 126000 = £ 11.524 per unit.
Production cost per unit = 216 + 108 + 54 + 27 + 11.52 = 416.52 per unit.
(ii) Preparation of income statement for the year
Particulars Amount
Sales (a) 108000 * 654 70632000
Less: Cost of Goods sold
Direct material 126000 * 216 27216000
Direct labour 126000 * 108 13608000
Variable production overhead 126000 * 54 6804000
Fixed production overhead 126000 * 11.524 1452000
Cost of goods available for sale 49080000
Less: Closing stock 18000 * 416.524 (7497432)
Cost of goods sold (b) 41582568
Gross profit (c) [c = a – b] 29049432
Less: selling, distribution and administration costs
Variable Selling and distribution overhead 108000 * 27 2916000
Fixed selling and distribution costs 360000
Fixed administration overhead 342000
6
Paraphrase This Document
Need a fresh take? Get an instant paraphrase of this document with our AI Paraphraser
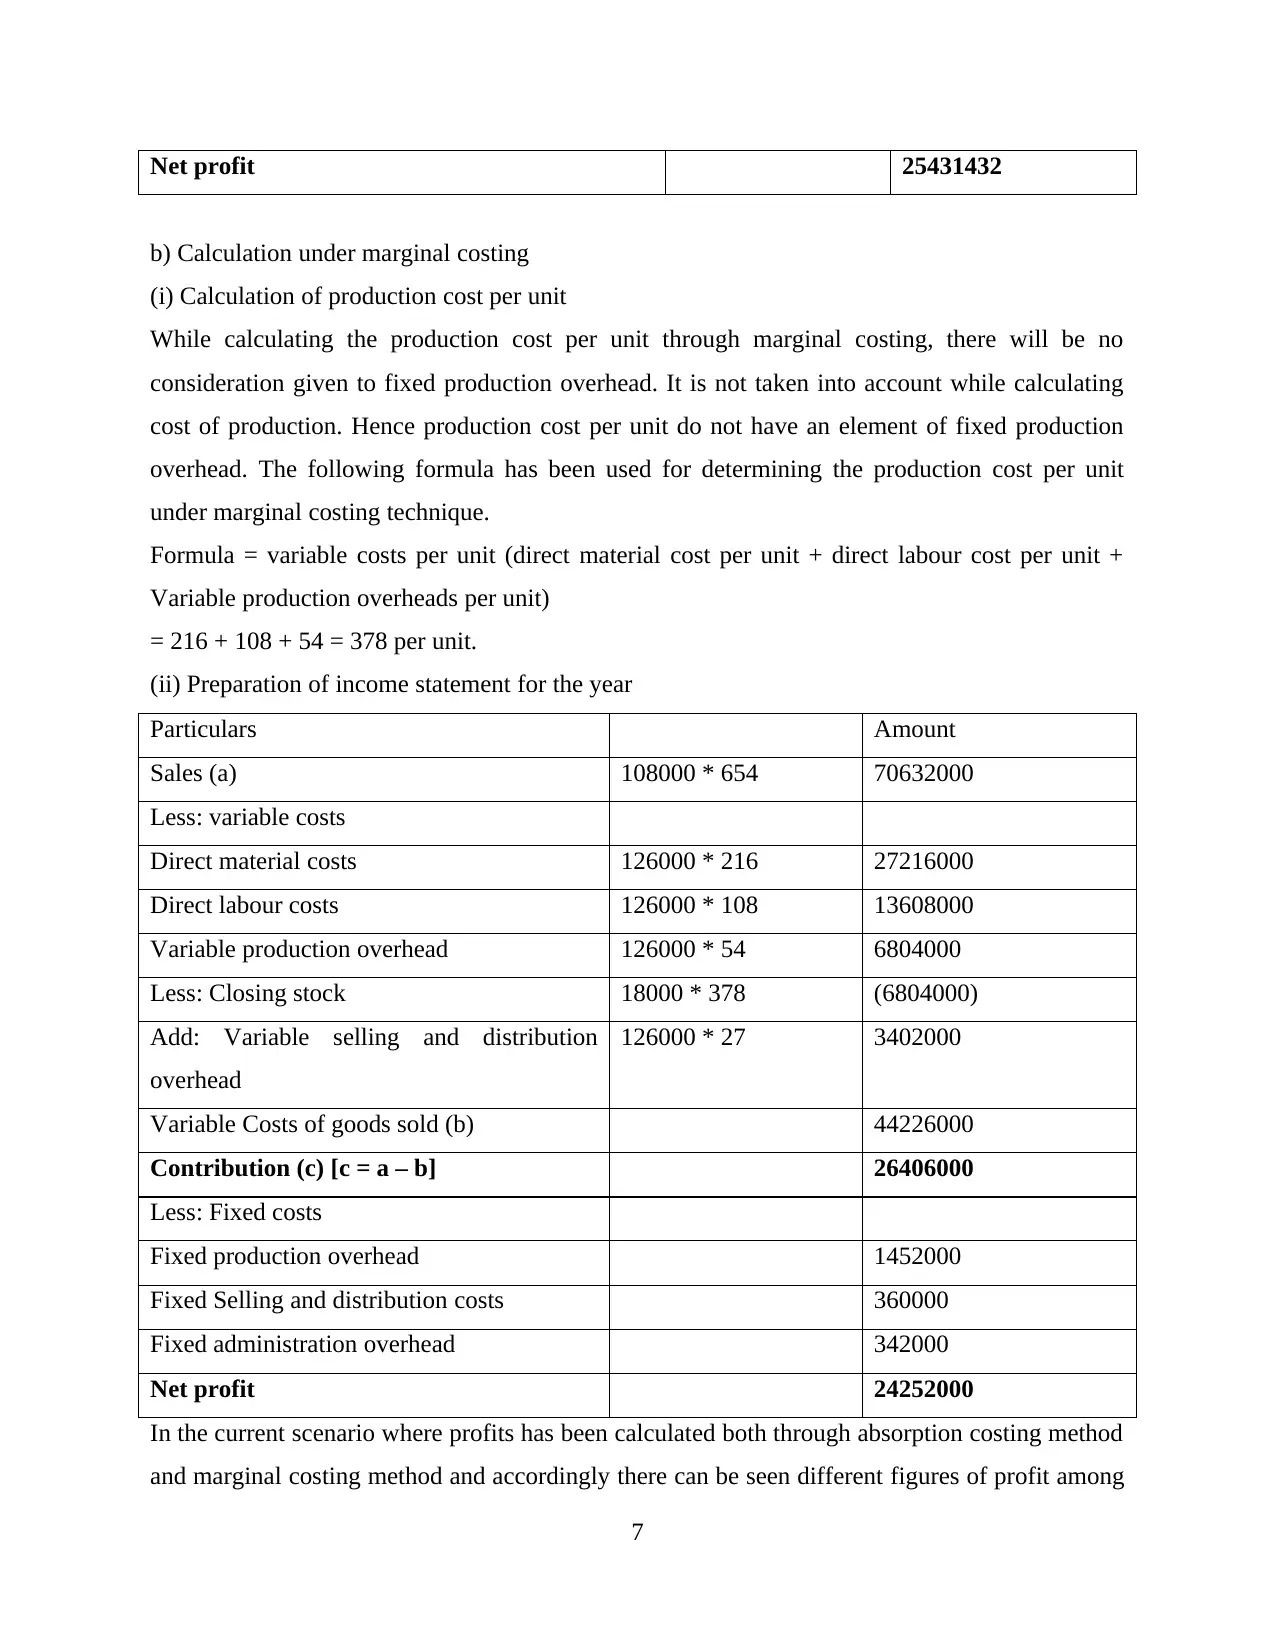
Net profit 25431432
b) Calculation under marginal costing
(i) Calculation of production cost per unit
While calculating the production cost per unit through marginal costing, there will be no
consideration given to fixed production overhead. It is not taken into account while calculating
cost of production. Hence production cost per unit do not have an element of fixed production
overhead. The following formula has been used for determining the production cost per unit
under marginal costing technique.
Formula = variable costs per unit (direct material cost per unit + direct labour cost per unit +
Variable production overheads per unit)
= 216 + 108 + 54 = 378 per unit.
(ii) Preparation of income statement for the year
Particulars Amount
Sales (a) 108000 * 654 70632000
Less: variable costs
Direct material costs 126000 * 216 27216000
Direct labour costs 126000 * 108 13608000
Variable production overhead 126000 * 54 6804000
Less: Closing stock 18000 * 378 (6804000)
Add: Variable selling and distribution
overhead
126000 * 27 3402000
Variable Costs of goods sold (b) 44226000
Contribution (c) [c = a – b] 26406000
Less: Fixed costs
Fixed production overhead 1452000
Fixed Selling and distribution costs 360000
Fixed administration overhead 342000
Net profit 24252000
In the current scenario where profits has been calculated both through absorption costing method
and marginal costing method and accordingly there can be seen different figures of profit among
7
these two methods of costing. The reason which leads to such difference in profit figures is due
to the utilisation of different methods of valuing closing inventories under these two techniques
of costing. In marginal costing, closing inventories are valued on the basis of marginal or
variable cost incurred in production while in case of absorption costing, the closing inventories
are valued at total cost of production whether it is variable or fixed (Maheshwari, Maheshwari
and Maheshwari, 2021). Accordingly, there lies difference in profit figures derived through
marginal and absorption costing techniques.
There are certain points that are needed to be kept in mind with regards to calculating profit
through absorption costing and marginal costing techniques, such as the following:
There will be no difference in the amount of profit derived from marginal and absorption
costing when there is no closing or opening inventories.
There will be difference in the amount of profits if both opening and closing inventories
contain the same quantities and having included the same amount of fixed costs in it.
When opening inventory is higher than closing inventory, there will be less profit under
absorption costing and vice versa.
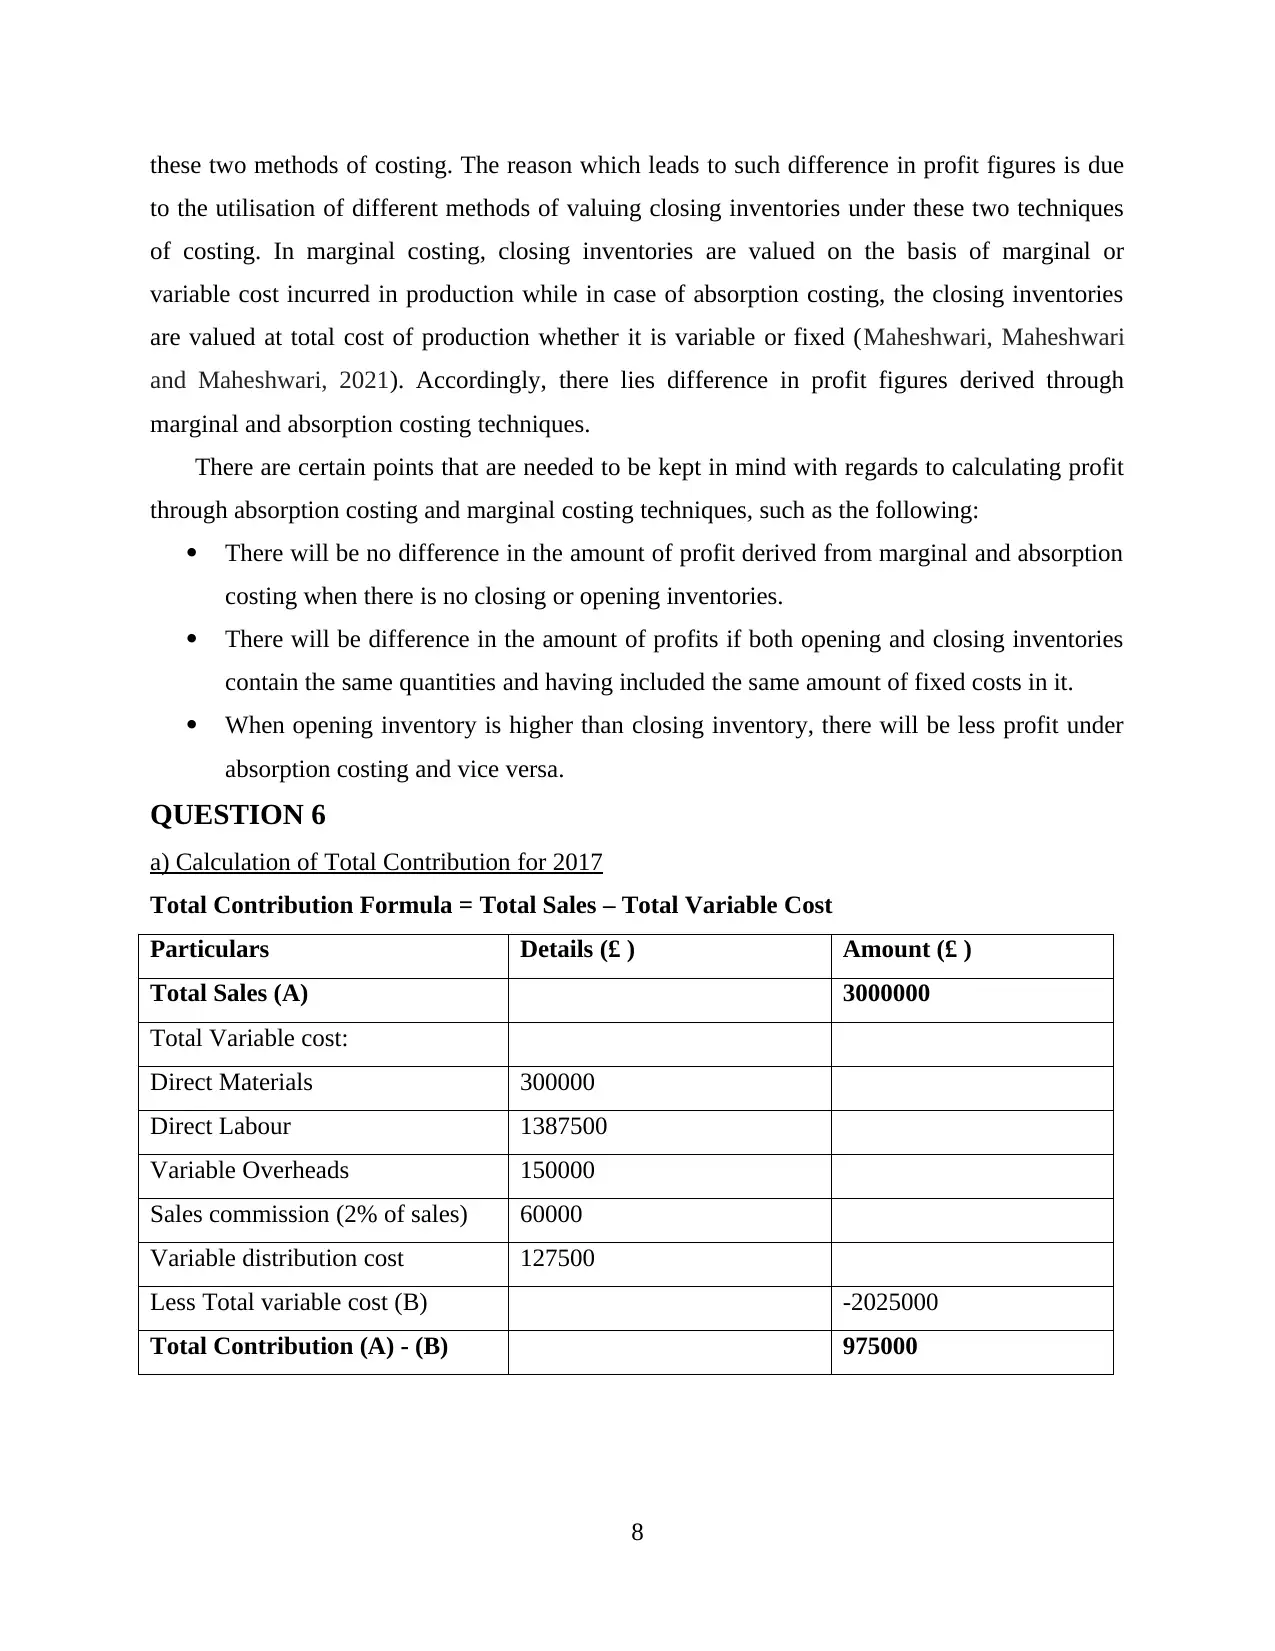
QUESTION 6
a) Calculation of Total Contribution for 2017
Total Contribution Formula = Total Sales – Total Variable Cost
Particulars Details (£ ) Amount (£ )
Total Sales (A) 3000000
Total Variable cost:
Direct Materials 300000
Direct Labour 1387500
Variable Overheads 150000
Sales commission (2% of sales) 60000
Variable distribution cost 127500
Less Total variable cost (B) -2025000
Total Contribution (A) - (B) 975000
8
to the utilisation of different methods of valuing closing inventories under these two techniques
of costing. In marginal costing, closing inventories are valued on the basis of marginal or
variable cost incurred in production while in case of absorption costing, the closing inventories
are valued at total cost of production whether it is variable or fixed (Maheshwari, Maheshwari
and Maheshwari, 2021). Accordingly, there lies difference in profit figures derived through
marginal and absorption costing techniques.
There are certain points that are needed to be kept in mind with regards to calculating profit
through absorption costing and marginal costing techniques, such as the following:
There will be no difference in the amount of profit derived from marginal and absorption
costing when there is no closing or opening inventories.
There will be difference in the amount of profits if both opening and closing inventories
contain the same quantities and having included the same amount of fixed costs in it.
When opening inventory is higher than closing inventory, there will be less profit under
absorption costing and vice versa.
QUESTION 6
a) Calculation of Total Contribution for 2017
Total Contribution Formula = Total Sales – Total Variable Cost
Particulars Details (£ ) Amount (£ )
Total Sales (A) 3000000
Total Variable cost:
Direct Materials 300000
Direct Labour 1387500
Variable Overheads 150000
Sales commission (2% of sales) 60000
Variable distribution cost 127500
Less Total variable cost (B) -2025000
Total Contribution (A) - (B) 975000
8
b) Calculation of Break-even points in units
Break-even Points (in units) Formula = Total Fixed Cost/ (Selling price per unit – variable cost
per unit)
855000/ 20- 13.5 per unit = 131538 units approx.
Note* = Calculation of Total Fixed cost
Particulars Amounts (£)
Fixed Overheads 525000
Fixed administration overheads 240000
Fixed advertising cost 90000
Total Fixed cost 855000
Note* = Calculation of contribution per unit
Contribution/ sales unit = 975000/ 150000 = 6.5 per unit
Variable cost per unit = 2025000/ 150000 = 13.5 per unit
c) Calculation of sales unit to make desired net profit
Income statement for 31st Dec. 2017
Let the sales unit be x
Particulars Details Amount (£)
Sales Revenue x * 20 20x
Less Variable cost X * 13.5 (13.5x)
Contribution 6.5x
Less Fixed cost -855000
Desired net profit 180000
So, the equation to calculate sales unit to make desired
profit will be
6.5x – 855000 = 180000
9
Secure Best Marks with AI Grader
Need help grading? Try our AI Grader for instant feedback on your assignments.
Solution of equation:
6.5x – 855000 = 180000
6.5x = 180000 + 855000
x = 1035000/ 6.5 = 159231 approx.
So, on the basis of above calculation Menlo Company need to produce and sell 159231 units in
order to make profit of £180000.
d) Effect on break-even point if selling price reduced by 15%
The current selling price of the Menlo company product is 20 and if it get reduced by 15% i.e.,
by £3 it will because £17.
Calculation of Break-even point on new selling price
Break-even Points (in units) Formula = Total Fixed Cost/ (Selling price per unit – variable cost
per unit)
= £855000/ (17 – 13.5) = 244286 units approx.
If the company will decrease the selling price of its product than its break-even point of
that product get increases which means the company's no-loss and no-profit point will get
increase. This indicate that Menlo company performance as compared to previous strategy is
poor which need to be improved.
e) Calculation of break-even point in units if variable cost get increases by £2.25
The current variable cost of Menlo Company’s product is £13.5 which get increased by £2.25
and will became £15.75 while the selling price will remain constant.
Break-even point in units = Total Fixed Cost/ (Selling price per unit – variable cost per unit)
= £855000/ (£20 - £15.75) = 201176 units approx.
If variable cost of the products of the company get increases and the impact of which its break-
even sales will also increases.
f) Meaning of contribution margin ratio and its uses in business planning
The contribution margin ratio is basically difference between the total sales and total
variable cost of the company. It is helpful for identifying and analysing the break-even point
because the break-even point is a no loss and no profit sales point where the fixed cost and
10
contribution is equal (Wang, Wang and Zhang, 2020). The contribution margin is changes as per
the change in the sales revenue and variable cost.
Uses of contribution margin ratio
This is used by the company to calculate the net profit by subtracting the fixed cost of the
company. Fixed cost generally remain constant at all level of the production activity. That's why
it is advisable to the company that their contribution margin of the product should be relativity
high (Aiello and et.al., 2017). since it must be sufficient to also cover fixed expenses and
administration overheads. Also, the measure is useful for determining whether to allow a lower
price in special pricing situations. In case if this margin is low or negative than it will cause
heavy loss to the company.
11
REFERENCES
Books and journals
Wang, S., Wang, X. and Zhang, J., 2020. Robust optimization approach to process flexibility
designs with contribution margin differentials. Manufacturing & Service Operations
Management.
Aiello, F. and et.al., 2017. Surgeon leadership in the coding, billing, and contractual
negotiations for fenestrated endovascular aortic aneurysm repair increases medical
center contribution margin and physician reimbursement. Journal of vascular
surgery. 66(4). pp.997-1006.
Maheshwari, S. N., Maheshwari, S. K. and Maheshwari, M. S. K., 2021. Principles of
Management Accounting. Sultan Chand & Sons.
12
1 out of 13
Related Documents


Your All-in-One AI-Powered Toolkit for Academic Success.
+13062052269
info@desklib.com
Available 24*7 on WhatsApp / Email
![[object Object]](/_next/static/media/star-bottom.7253800d.svg)
Unlock your academic potential
© 2024 | Zucol Services PVT LTD | All rights reserved.