Management Accounting - Desklib
VerifiedAdded on 2023/06/18
|13
|1906
|101
AI Summary
This report covers various topics related to Management Accounting such as cost formula, income statement, variance analysis, and contribution margin ratio. It includes questions and answers related to financial activities recorded by a company in a financial year.
Contribute Materials
Your contribution can guide someone’s learning journey. Share your
documents today.

Management Accounting
Secure Best Marks with AI Grader
Need help grading? Try our AI Grader for instant feedback on your assignments.

Contents
INTRODUCTION...........................................................................................................................................4
QUESTION 1.................................................................................................................................................4
QUESTION 3.................................................................................................................................................5
QUESTION 4.................................................................................................................................................7
(b) Possible causes of variances...............................................................................................................9
(c) Explain how you would determine which variance to examine further in relation to a work
performance?..........................................................................................................................................9
QUESTION 6...............................................................................................................................................10
6. What is meant by a product’s contribution margin (CM) ratio? How is this ratio useful in planning
business operations? ............................................................................................................................11
REFERENCES..............................................................................................................................................12
INTRODUCTION
Management accounting, often defined as managerial accounting, is the process of giving
financial data and knowledge to executives in order to assist them in solving problems. This
activity is performed by an important core teams, but this is what distinguishes managerial
accounting from accrual analysis. Effective internal accounting exchanges analyses and
information (such as balanced sheets and payments) with corporate governance as part of this
procedure. Those documentations are used by leadership to determine knowledgeable and
methods to assess on business operations, organization, and management consulting. In this
report consist of different questions which are based on the financial activities that are recorded
by company in a financial year.
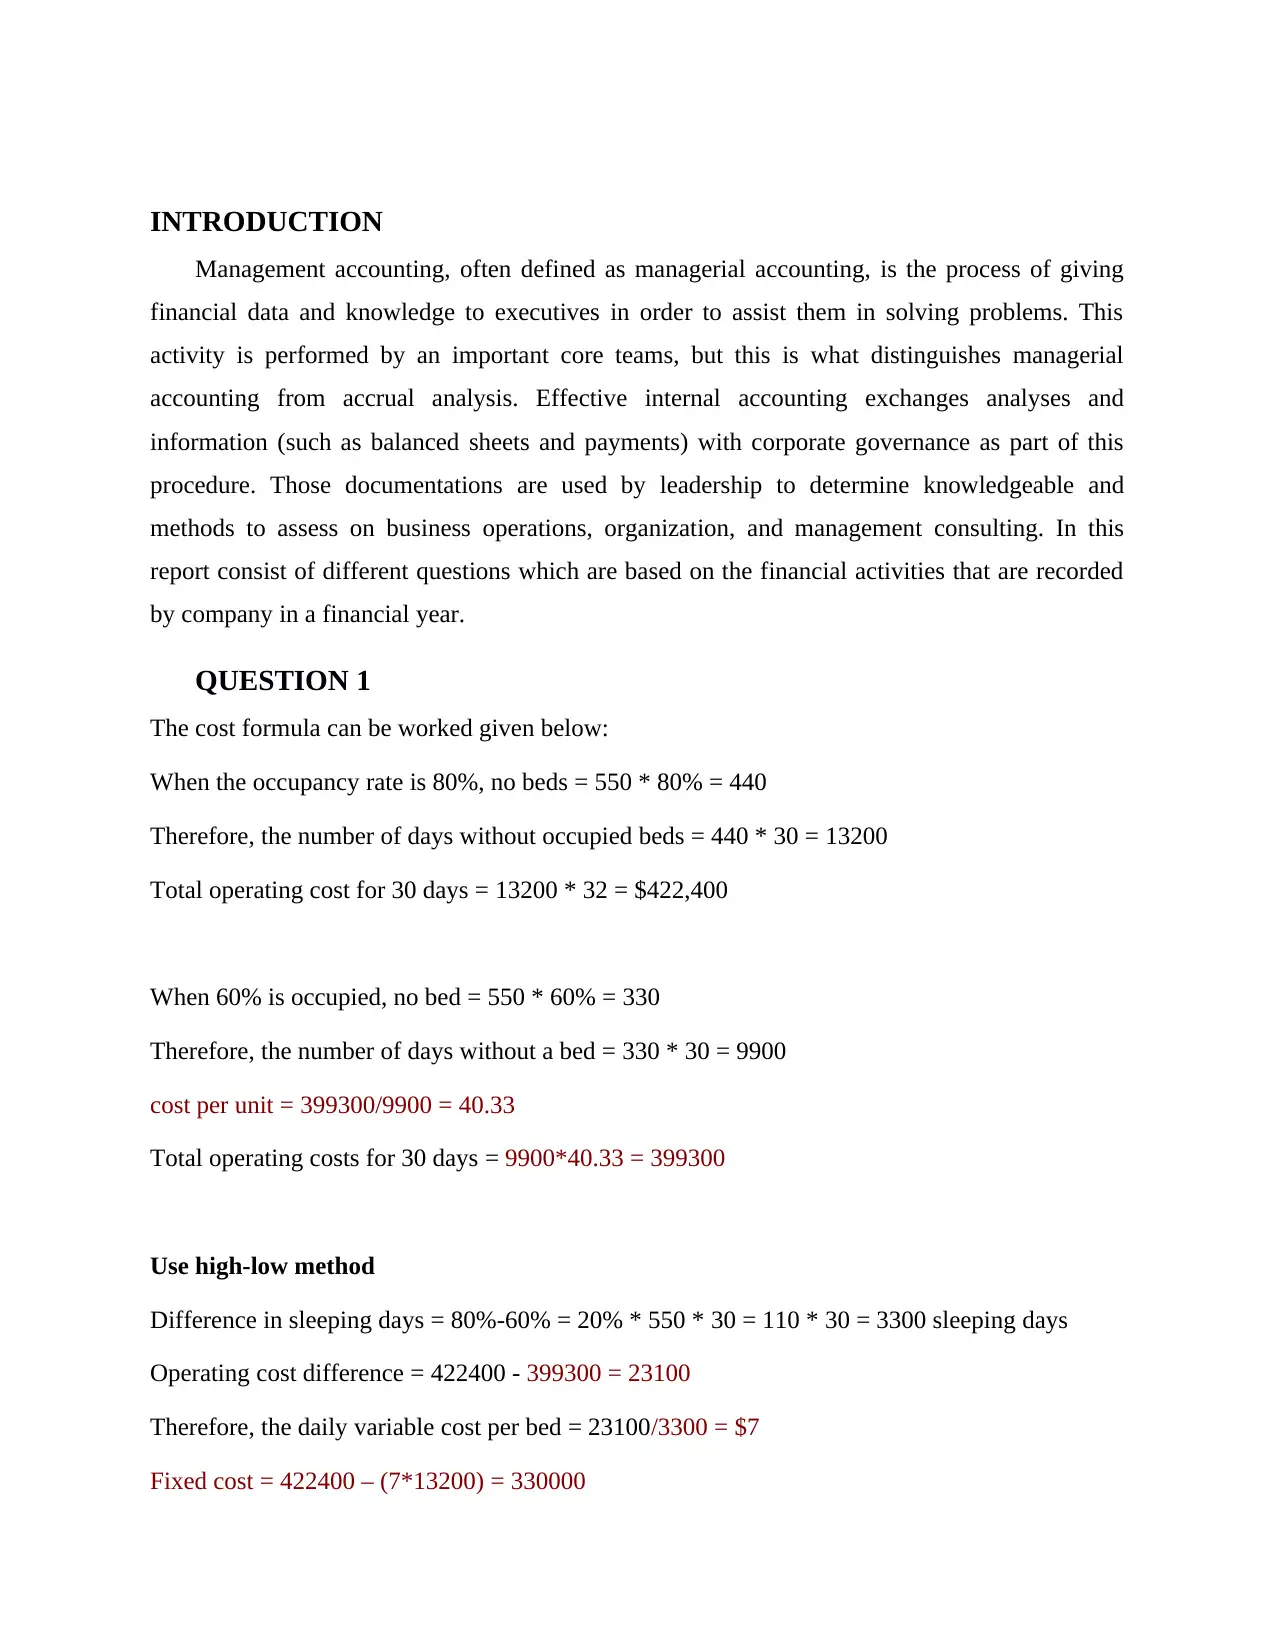
QUESTION 1
The cost formula can be worked given below:
When the occupancy rate is 80%, no beds = 550 * 80% = 440
Therefore, the number of days without occupied beds = 440 * 30 = 13200
Total operating cost for 30 days = 13200 * 32 = $422,400
When 60% is occupied, no bed = 550 * 60% = 330
Therefore, the number of days without a bed = 330 * 30 = 9900
cost per unit = 399300/9900 = 40.33
Total operating costs for 30 days = 9900*40.33 = 399300
Use high-low method
Difference in sleeping days = 80%-60% = 20% * 550 * 30 = 110 * 30 = 3300 sleeping days
Operating cost difference = 422400 - 399300 = 23100
Therefore, the daily variable cost per bed = 23100/3300 = $7
Fixed cost = 422400 – (7*13200) = 330000
Management accounting, often defined as managerial accounting, is the process of giving
financial data and knowledge to executives in order to assist them in solving problems. This
activity is performed by an important core teams, but this is what distinguishes managerial
accounting from accrual analysis. Effective internal accounting exchanges analyses and
information (such as balanced sheets and payments) with corporate governance as part of this
procedure. Those documentations are used by leadership to determine knowledgeable and
methods to assess on business operations, organization, and management consulting. In this
report consist of different questions which are based on the financial activities that are recorded
by company in a financial year.
QUESTION 1
The cost formula can be worked given below:
When the occupancy rate is 80%, no beds = 550 * 80% = 440
Therefore, the number of days without occupied beds = 440 * 30 = 13200
Total operating cost for 30 days = 13200 * 32 = $422,400
When 60% is occupied, no bed = 550 * 60% = 330
Therefore, the number of days without a bed = 330 * 30 = 9900
cost per unit = 399300/9900 = 40.33
Total operating costs for 30 days = 9900*40.33 = 399300
Use high-low method
Difference in sleeping days = 80%-60% = 20% * 550 * 30 = 110 * 30 = 3300 sleeping days
Operating cost difference = 422400 - 399300 = 23100
Therefore, the daily variable cost per bed = 23100/3300 = $7
Fixed cost = 422400 – (7*13200) = 330000
Secure Best Marks with AI Grader
Need help grading? Try our AI Grader for instant feedback on your assignments.
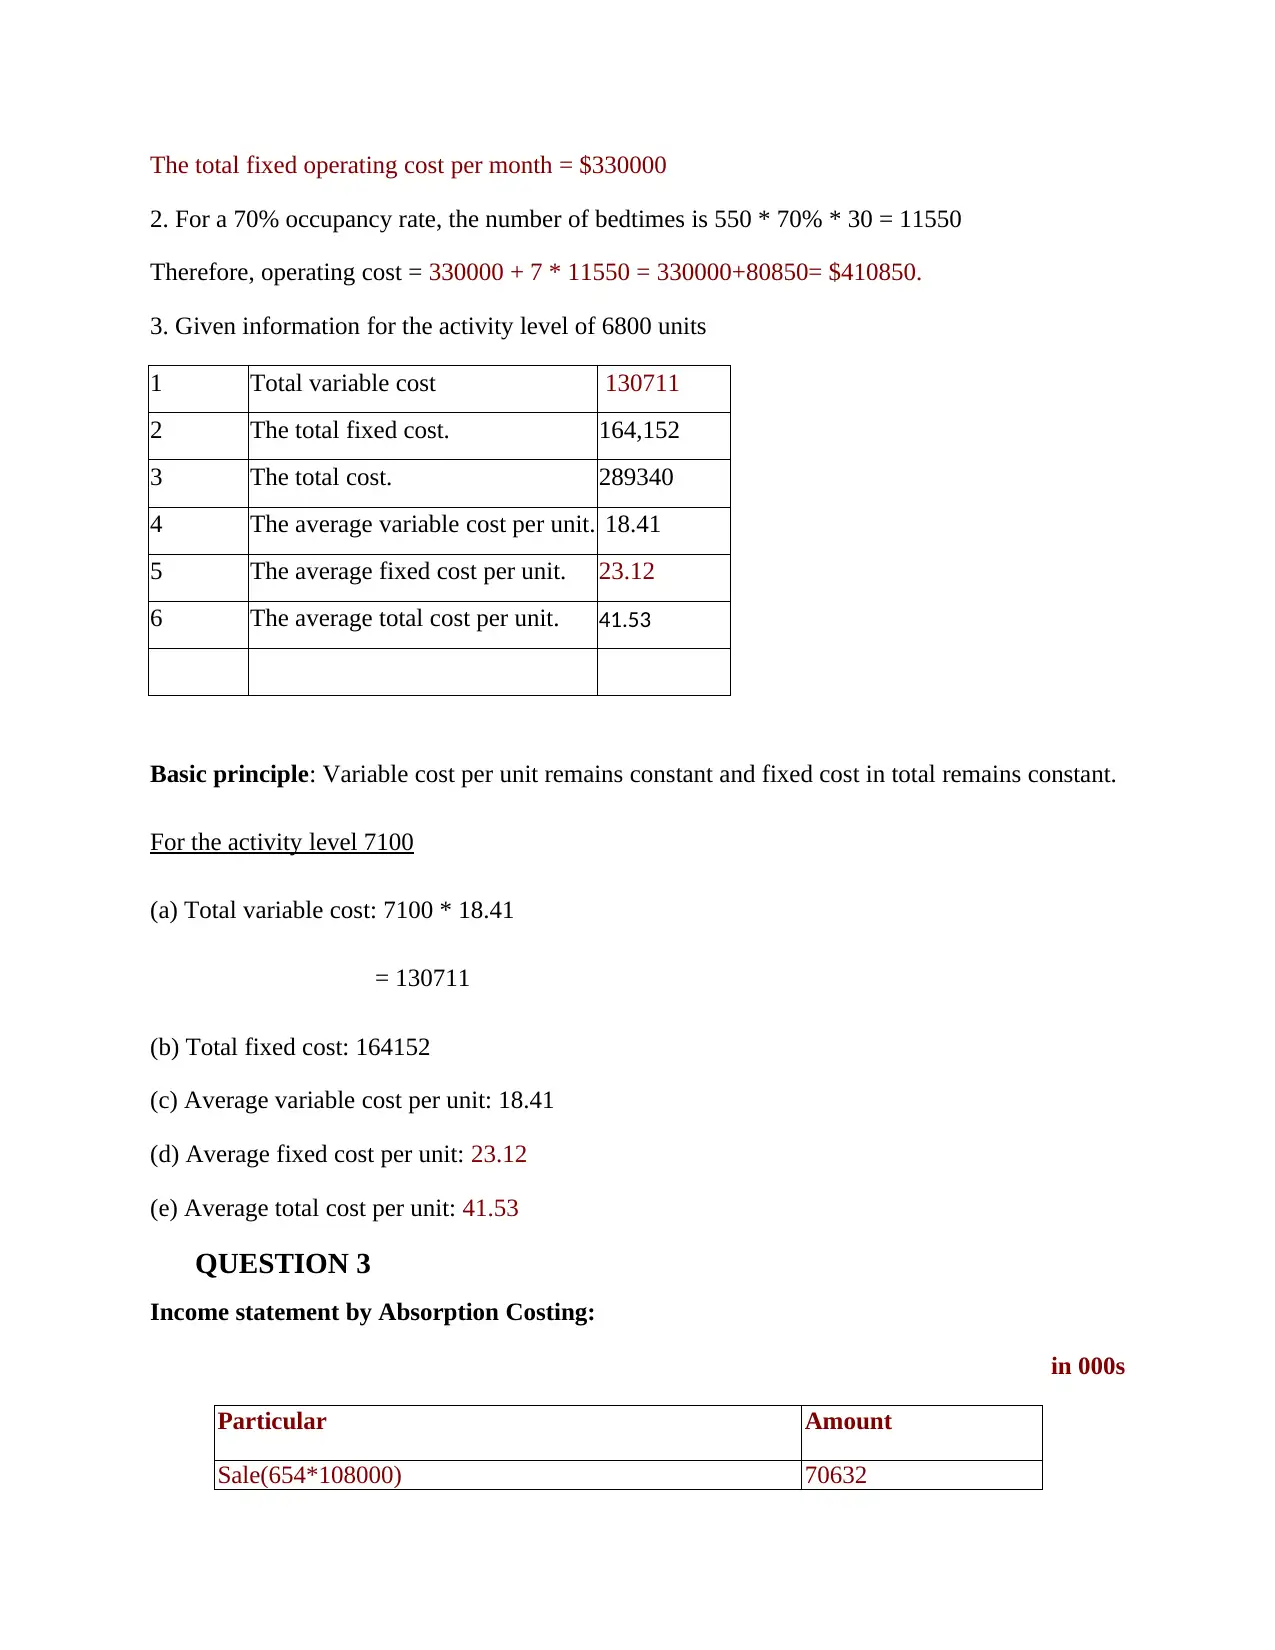
The total fixed operating cost per month = $330000
2. For a 70% occupancy rate, the number of bedtimes is 550 * 70% * 30 = 11550
Therefore, operating cost = 330000 + 7 * 11550 = 330000+80850= $410850.
3. Given information for the activity level of 6800 units
1 Total variable cost 130711
2 The total fixed cost. 164,152
3 The total cost. 289340
4 The average variable cost per unit. 18.41
5 The average fixed cost per unit. 23.12
6 The average total cost per unit. 41.53
Basic principle: Variable cost per unit remains constant and fixed cost in total remains constant.
For the activity level 7100
(a) Total variable cost: 7100 * 18.41
= 130711
(b) Total fixed cost: 164152
(c) Average variable cost per unit: 18.41
(d) Average fixed cost per unit: 23.12
(e) Average total cost per unit: 41.53
QUESTION 3
Income statement by Absorption Costing:
in 000s
Particular Amount
Sale(654*108000) 70632
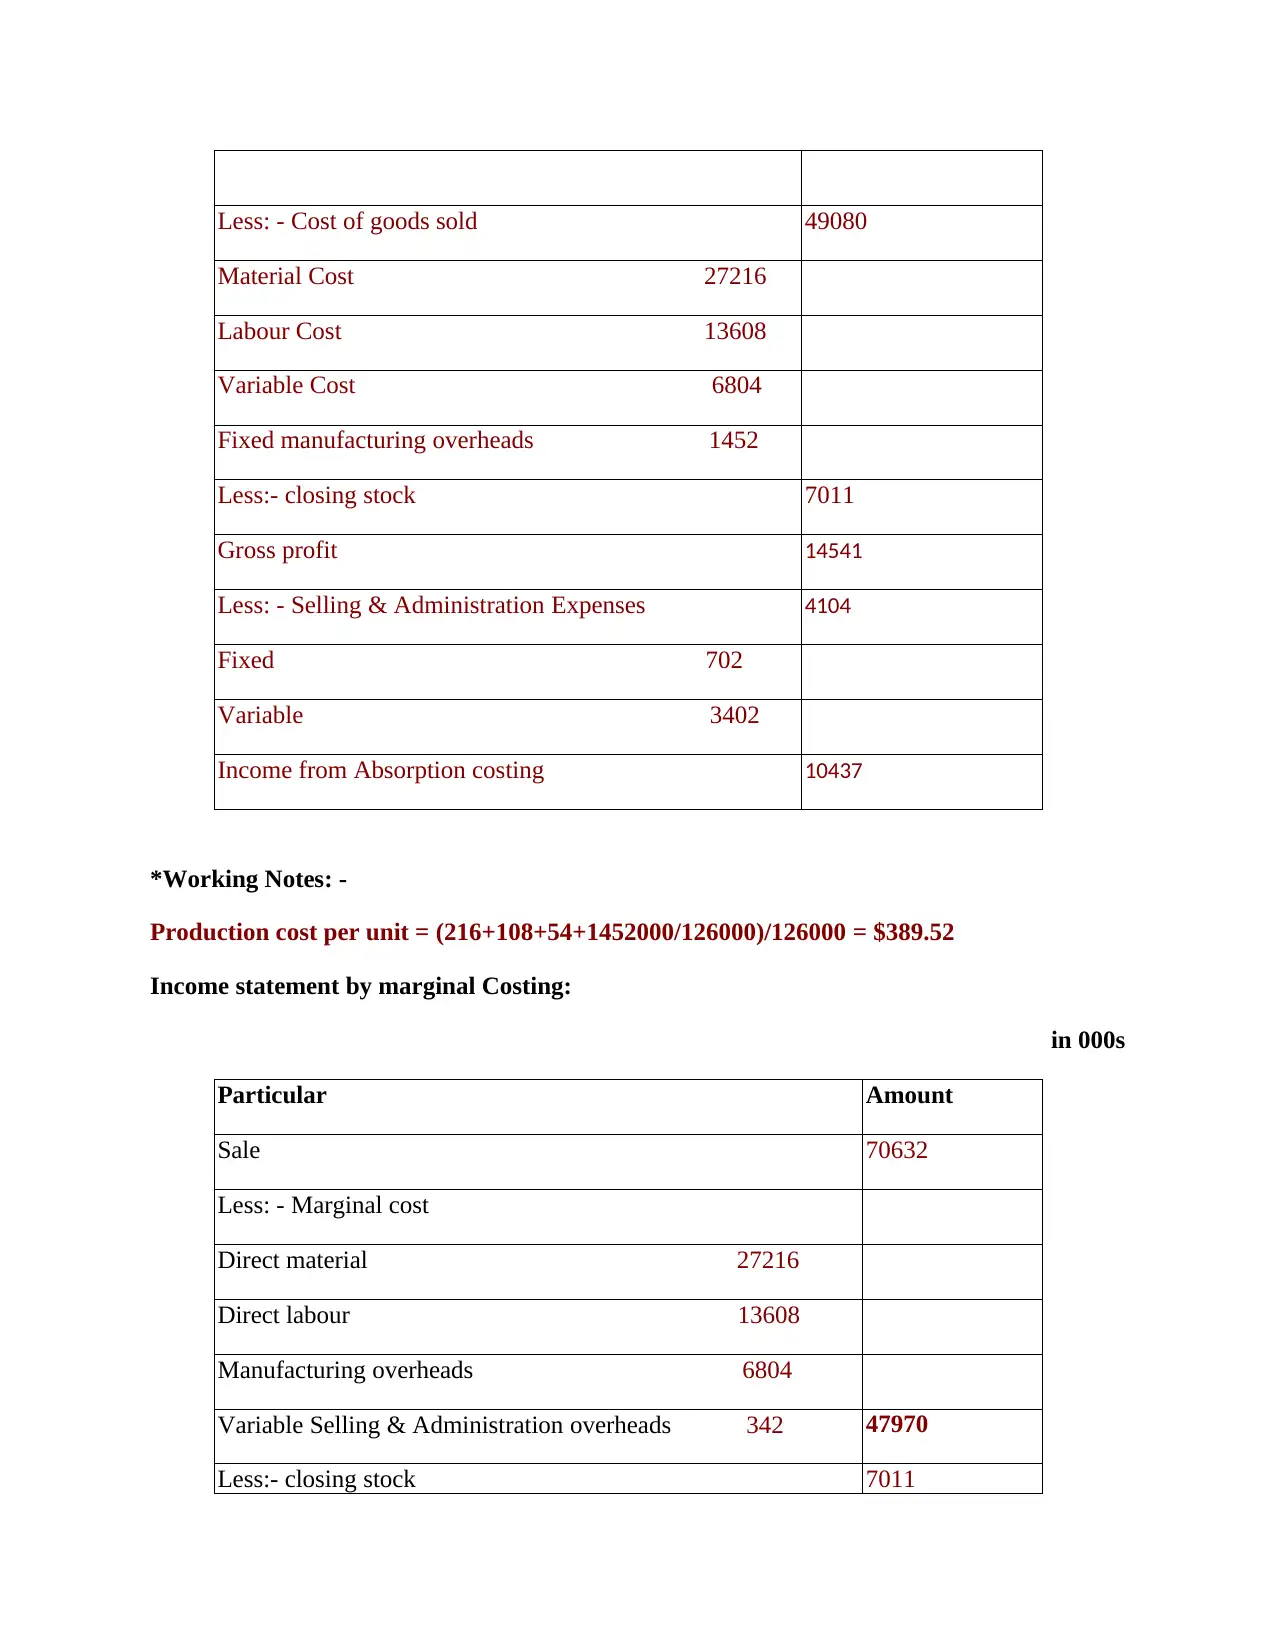
Less: - Cost of goods sold 49080
Material Cost 27216
Labour Cost 13608
Variable Cost 6804
Fixed manufacturing overheads 1452
Less:- closing stock 7011
Gross profit 14541
Less: - Selling & Administration Expenses 4104
Fixed 702
Variable 3402
Income from Absorption costing 10437
*Working Notes: -
Production cost per unit = (216+108+54+1452000/126000)/126000 = $389.52
Income statement by marginal Costing:
in 000s
Particular Amount
Sale 70632
Less: - Marginal cost
Direct material 27216
Direct labour 13608
Manufacturing overheads 6804
Variable Selling & Administration overheads 342 47970
Less:- closing stock 7011
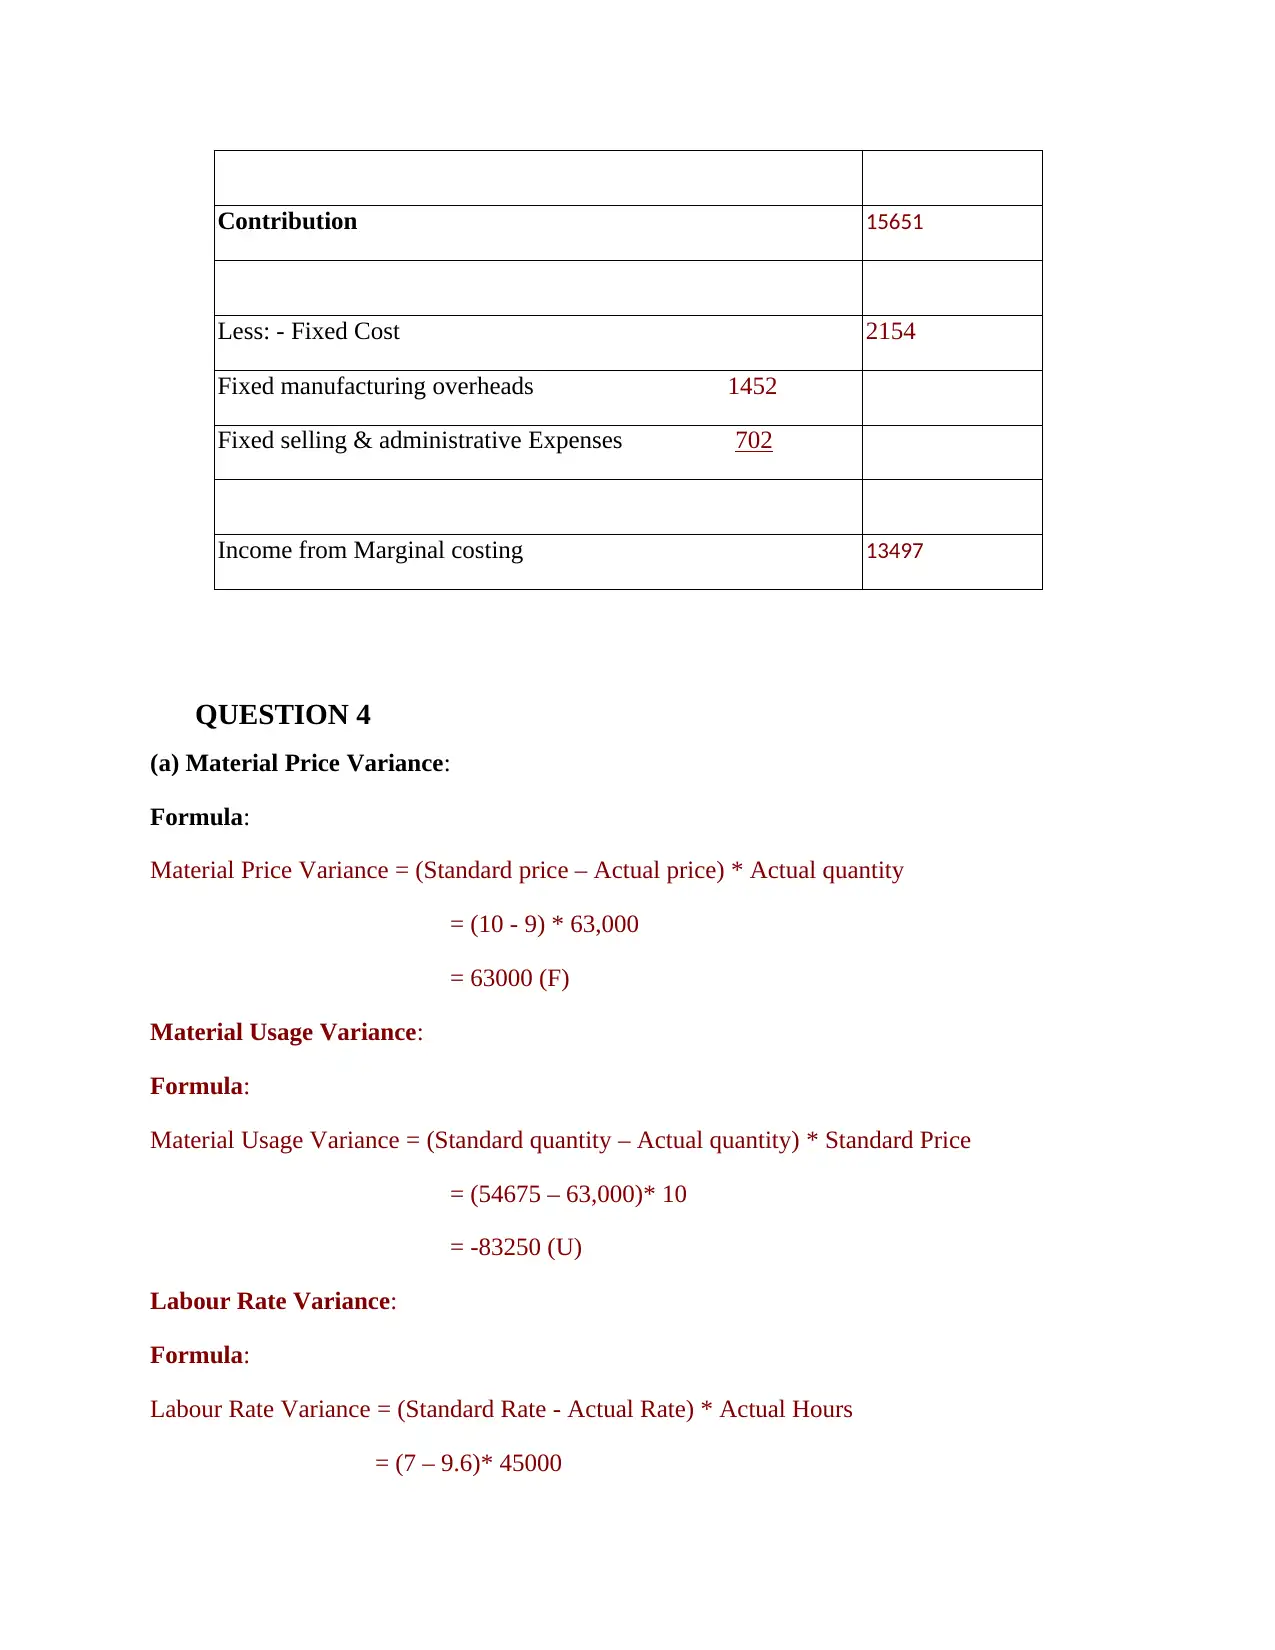
Contribution 15651
Less: - Fixed Cost 2154
Fixed manufacturing overheads 1452
Fixed selling & administrative Expenses 702
Income from Marginal costing 13497
QUESTION 4
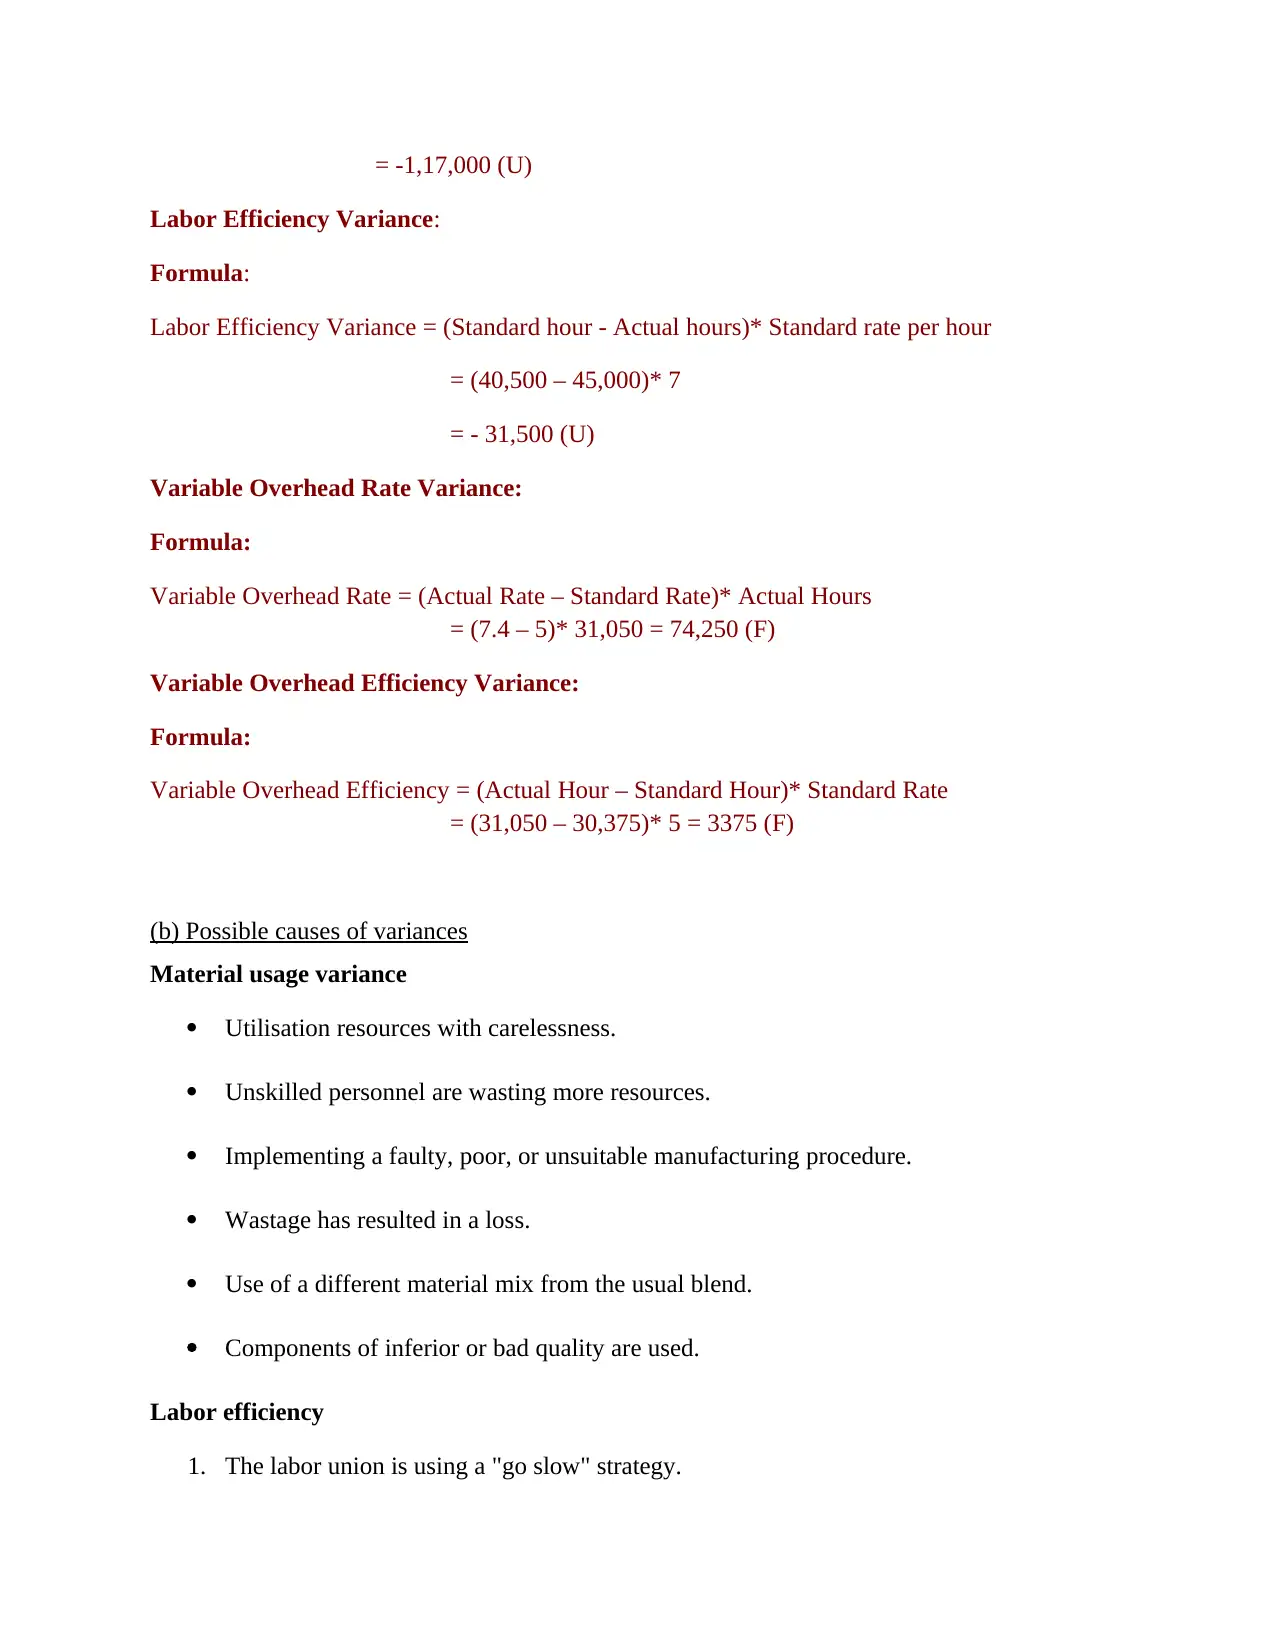
(a) Material Price Variance:
Formula:
Material Price Variance = (Standard price – Actual price) * Actual quantity
= (10 - 9) * 63,000
= 63000 (F)
Material Usage Variance:
Formula:
Material Usage Variance = (Standard quantity – Actual quantity) * Standard Price
= (54675 – 63,000)* 10
= -83250 (U)
Labour Rate Variance:
Formula:
Labour Rate Variance = (Standard Rate - Actual Rate) * Actual Hours
= (7 – 9.6)* 45000
Less: - Fixed Cost 2154
Fixed manufacturing overheads 1452
Fixed selling & administrative Expenses 702
Income from Marginal costing 13497
QUESTION 4
(a) Material Price Variance:
Formula:
Material Price Variance = (Standard price – Actual price) * Actual quantity
= (10 - 9) * 63,000
= 63000 (F)
Material Usage Variance:
Formula:
Material Usage Variance = (Standard quantity – Actual quantity) * Standard Price
= (54675 – 63,000)* 10
= -83250 (U)
Labour Rate Variance:
Formula:
Labour Rate Variance = (Standard Rate - Actual Rate) * Actual Hours
= (7 – 9.6)* 45000
Paraphrase This Document
Need a fresh take? Get an instant paraphrase of this document with our AI Paraphraser
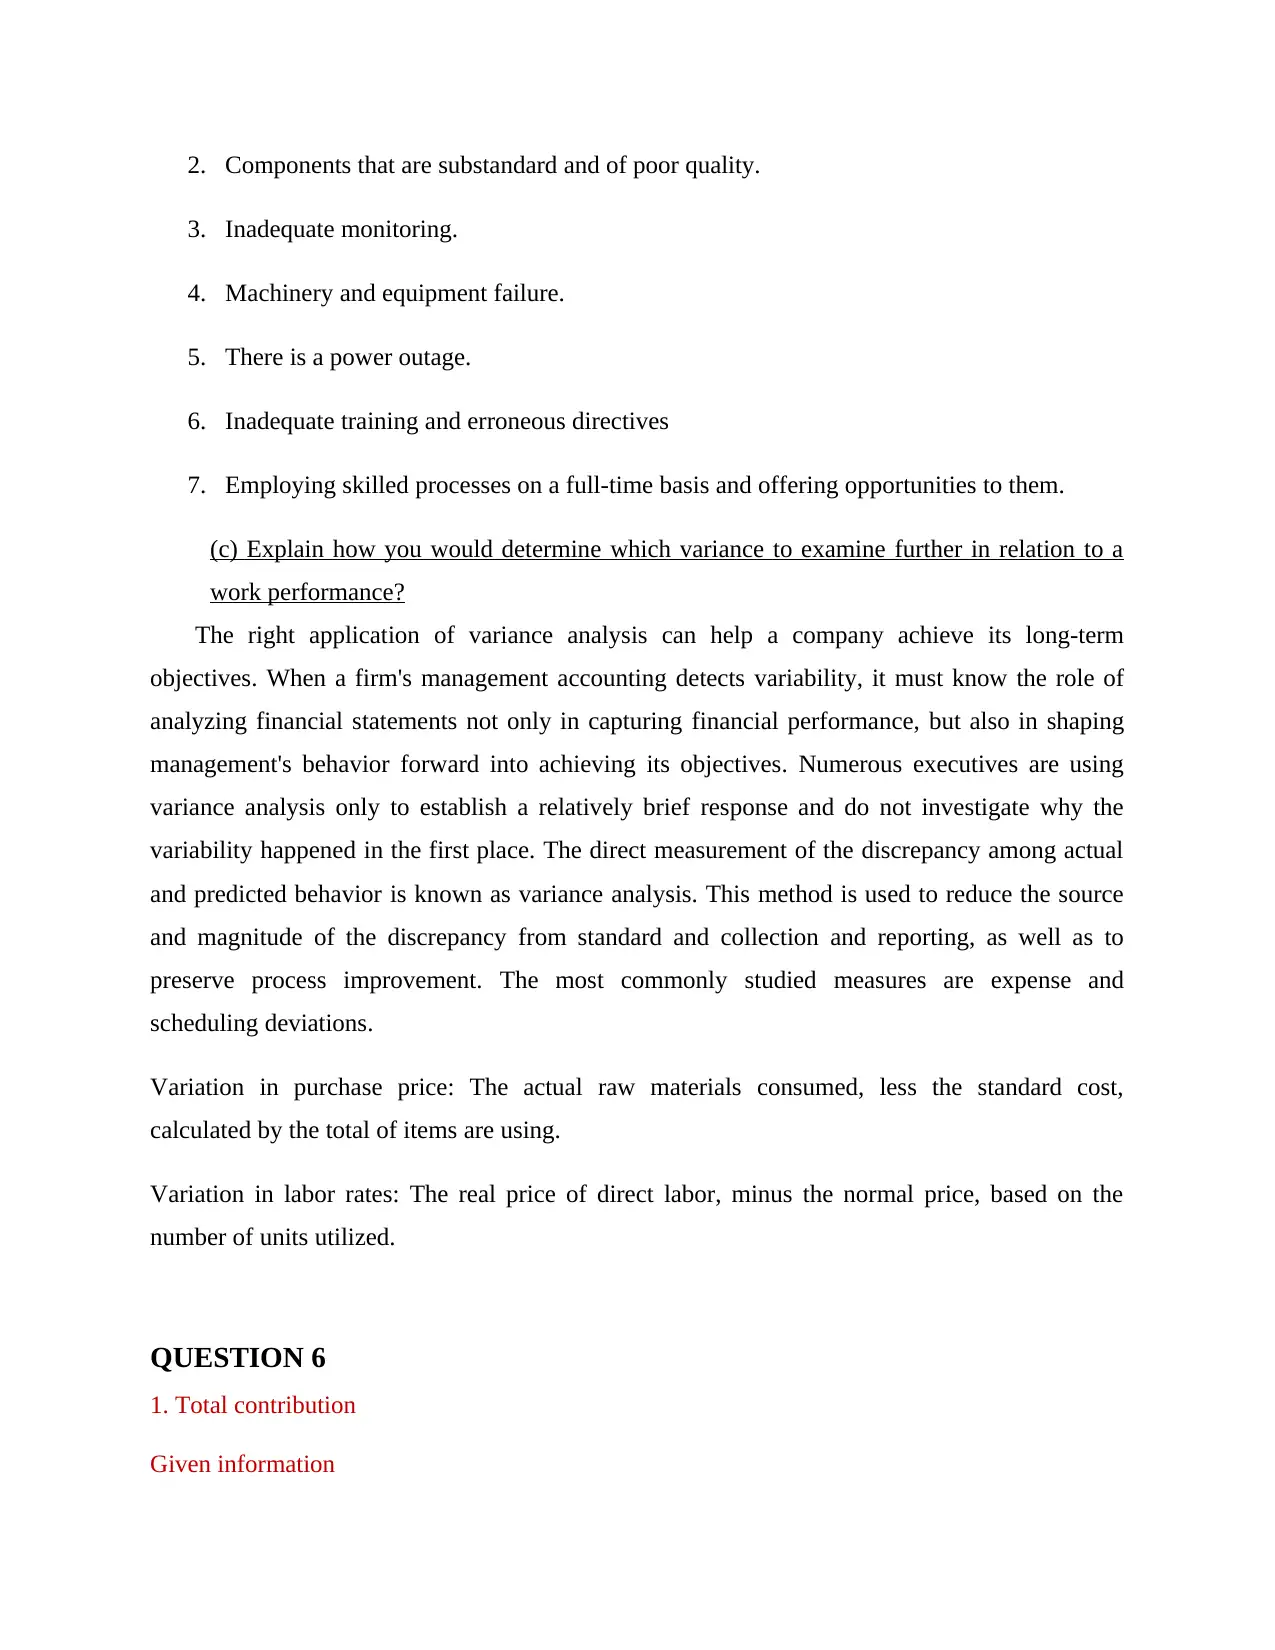
= -1,17,000 (U)
Labor Efficiency Variance:
Formula:
Labor Efficiency Variance = (Standard hour - Actual hours)* Standard rate per hour
= (40,500 – 45,000)* 7
= - 31,500 (U)
Variable Overhead Rate Variance:
Formula:
Variable Overhead Rate = (Actual Rate – Standard Rate)* Actual Hours
= (7.4 – 5)* 31,050 = 74,250 (F)
Variable Overhead Efficiency Variance:
Formula:
Variable Overhead Efficiency = (Actual Hour – Standard Hour)* Standard Rate
= (31,050 – 30,375)* 5 = 3375 (F)
(b) Possible causes of variances
Material usage variance
Utilisation resources with carelessness.
Unskilled personnel are wasting more resources.
Implementing a faulty, poor, or unsuitable manufacturing procedure.
Wastage has resulted in a loss.
Use of a different material mix from the usual blend.
Components of inferior or bad quality are used.
Labor efficiency
1. The labor union is using a "go slow" strategy.
2. Components that are substandard and of poor quality.
3. Inadequate monitoring.
4. Machinery and equipment failure.
5. There is a power outage.
6. Inadequate training and erroneous directives
7. Employing skilled processes on a full-time basis and offering opportunities to them.
(c) Explain how you would determine which variance to examine further in relation to a
work performance?
The right application of variance analysis can help a company achieve its long-term
objectives. When a firm's management accounting detects variability, it must know the role of
analyzing financial statements not only in capturing financial performance, but also in shaping
management's behavior forward into achieving its objectives. Numerous executives are using
variance analysis only to establish a relatively brief response and do not investigate why the
variability happened in the first place. The direct measurement of the discrepancy among actual
and predicted behavior is known as variance analysis. This method is used to reduce the source
and magnitude of the discrepancy from standard and collection and reporting, as well as to
preserve process improvement. The most commonly studied measures are expense and
scheduling deviations.
Variation in purchase price: The actual raw materials consumed, less the standard cost,
calculated by the total of items are using.
Variation in labor rates: The real price of direct labor, minus the normal price, based on the
number of units utilized.
QUESTION 6
1. Total contribution
Given information
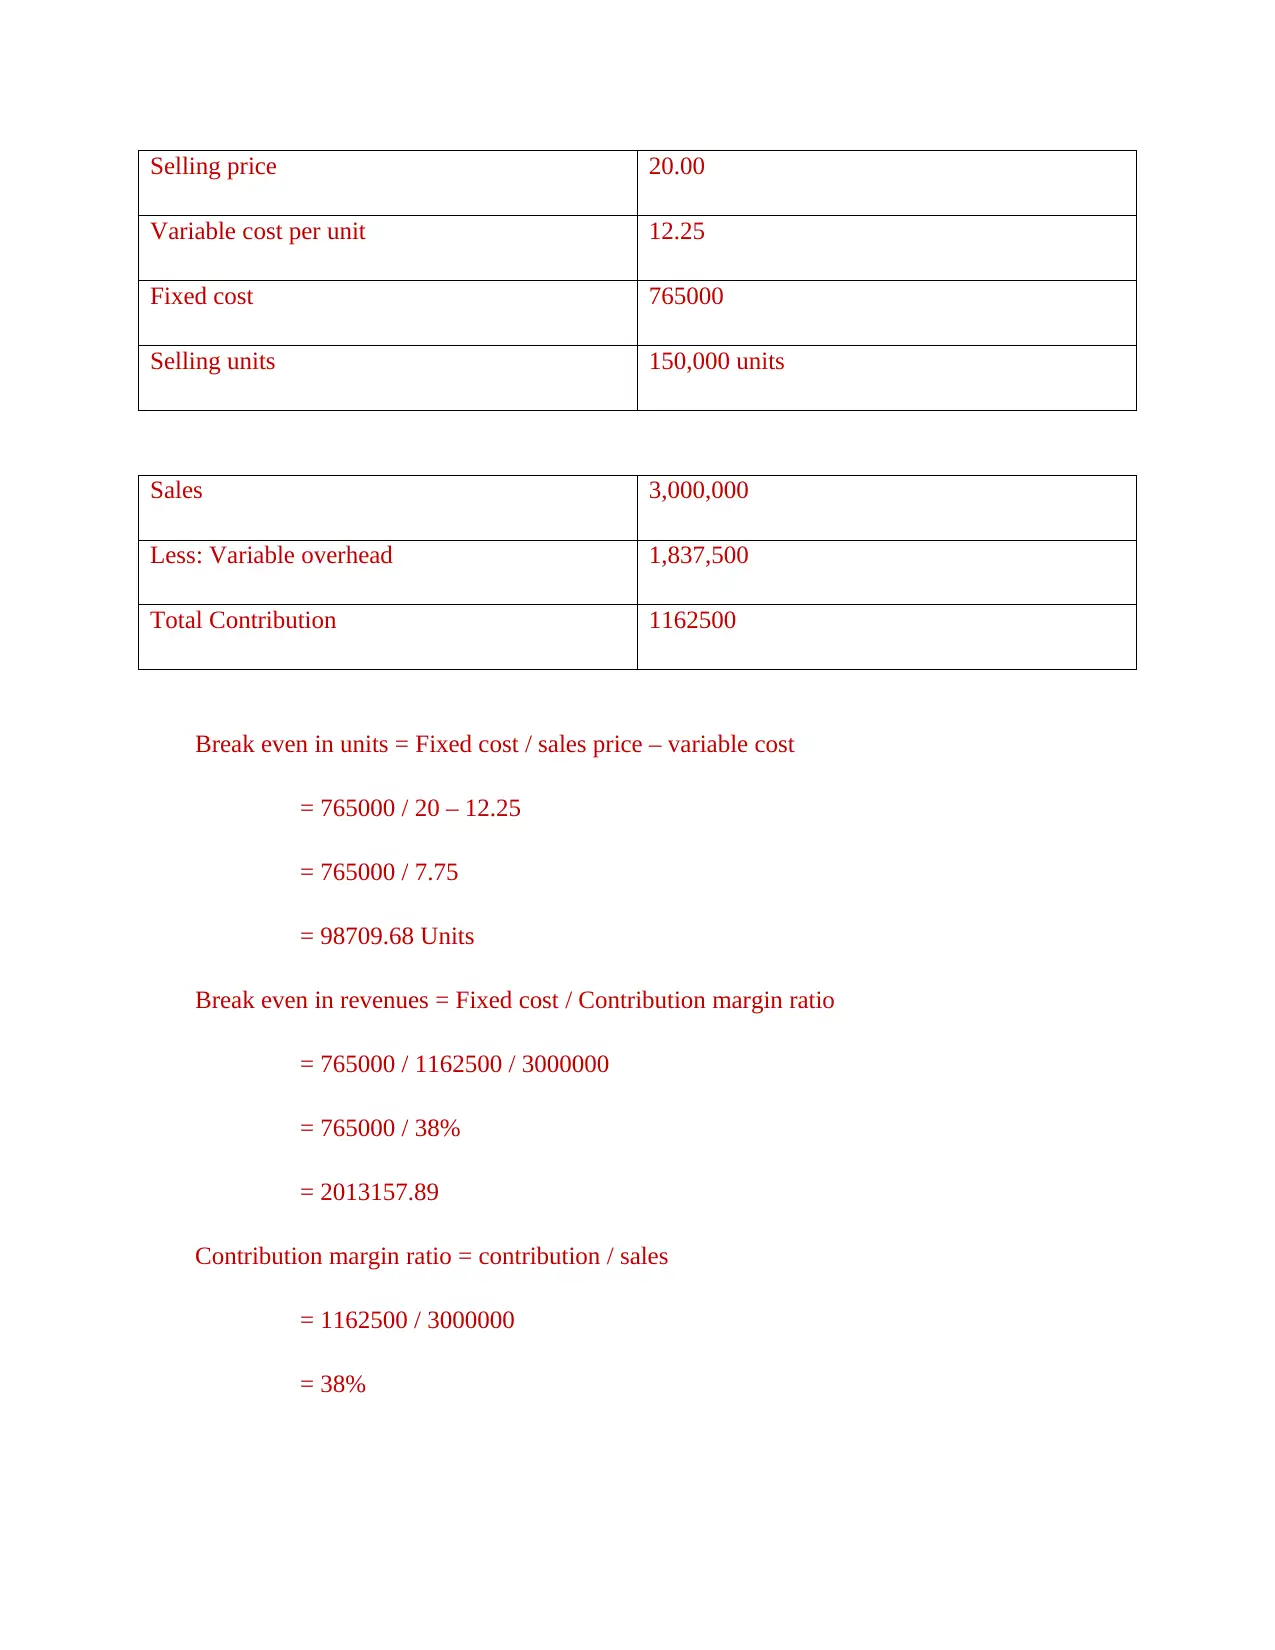
Selling price 20.00
Variable cost per unit 12.25
Fixed cost 765000
Selling units 150,000 units
Sales 3,000,000
Less: Variable overhead 1,837,500
Total Contribution 1162500
Break even in units = Fixed cost / sales price – variable cost
= 765000 / 20 – 12.25
= 765000 / 7.75
= 98709.68 Units
Break even in revenues = Fixed cost / Contribution margin ratio
= 765000 / 1162500 / 3000000
= 765000 / 38%
= 2013157.89
Contribution margin ratio = contribution / sales
= 1162500 / 3000000
= 38%
Secure Best Marks with AI Grader
Need help grading? Try our AI Grader for instant feedback on your assignments.
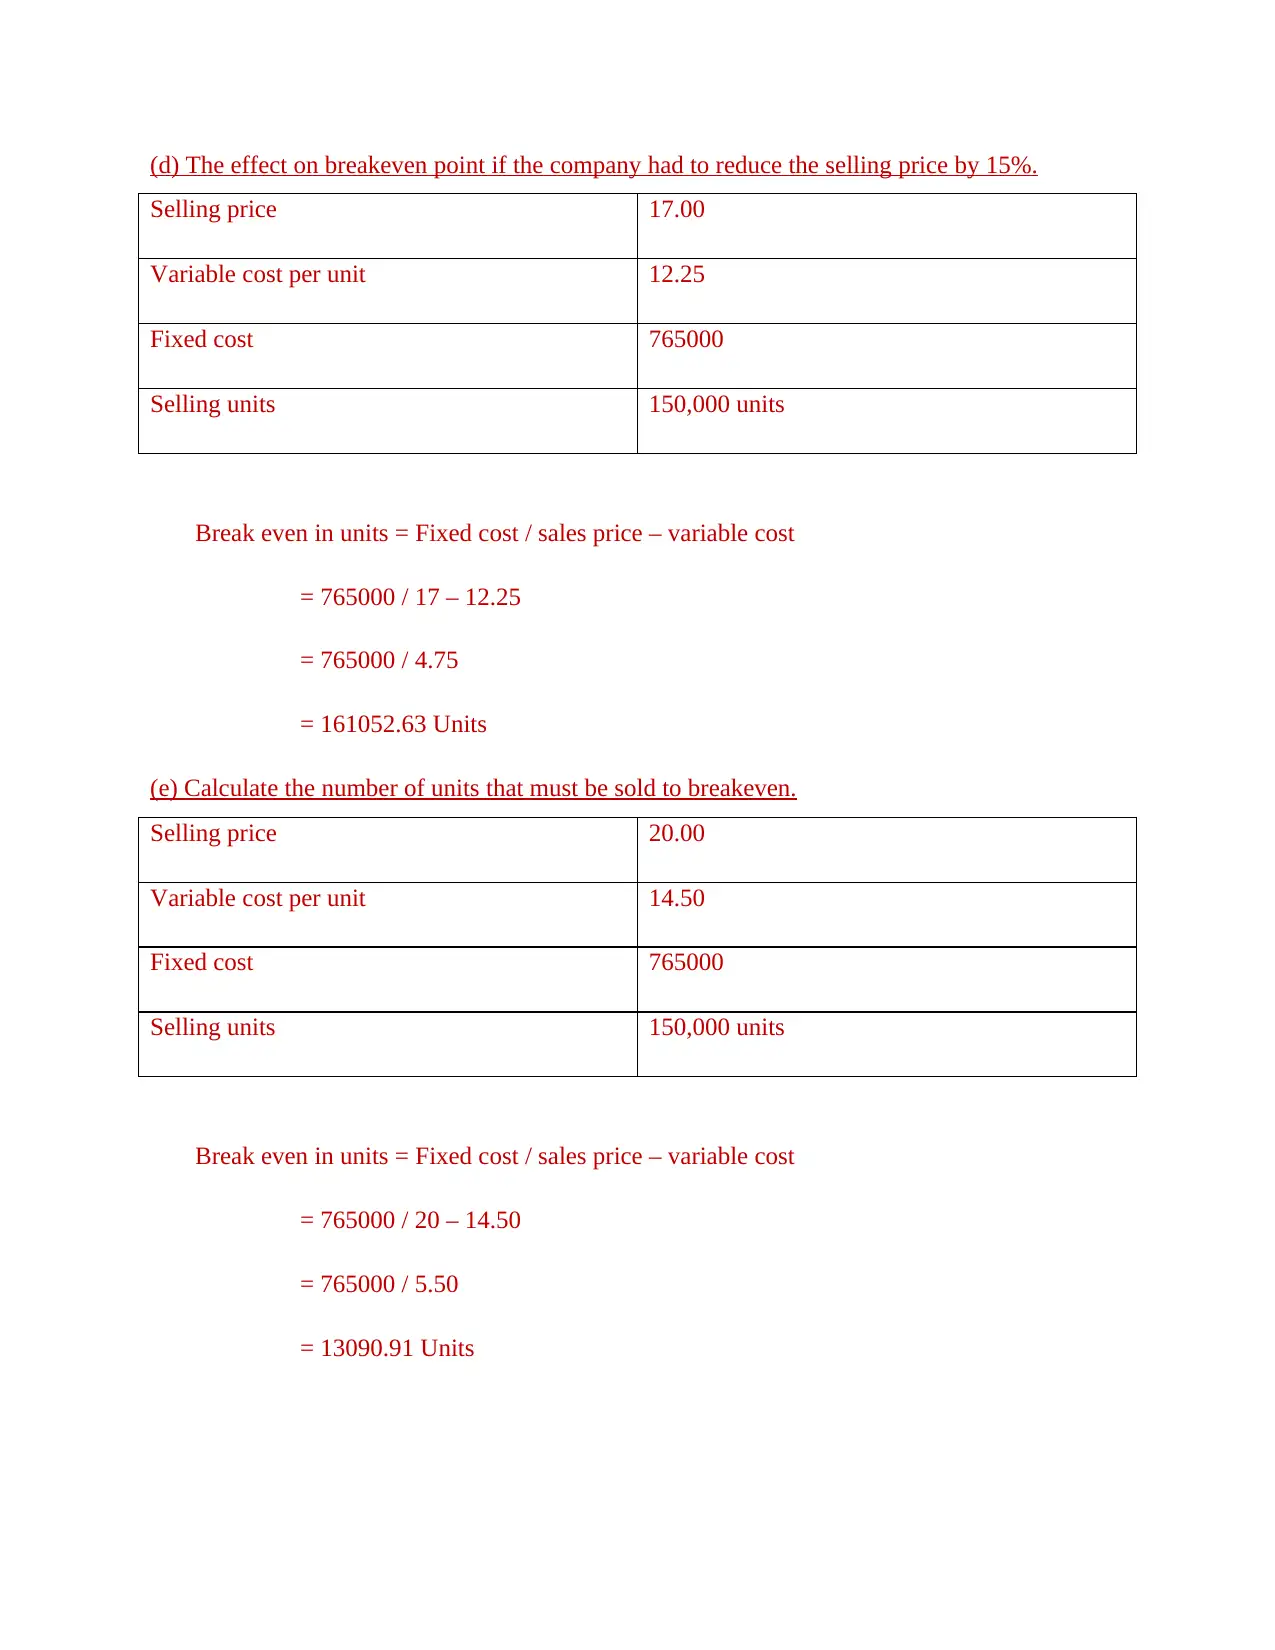
(d) The effect on breakeven point if the company had to reduce the selling price by 15%.
Selling price 17.00
Variable cost per unit 12.25
Fixed cost 765000
Selling units 150,000 units
Break even in units = Fixed cost / sales price – variable cost
= 765000 / 17 – 12.25
= 765000 / 4.75
= 161052.63 Units
(e) Calculate the number of units that must be sold to breakeven.
Selling price 20.00
Variable cost per unit 14.50
Fixed cost 765000
Selling units 150,000 units
Break even in units = Fixed cost / sales price – variable cost
= 765000 / 20 – 14.50
= 765000 / 5.50
= 13090.91 Units
6. What is meant by a product’s contribution margin (CM) ratio? How is this ratio useful in
planning business operations?
The contribution margin ratio is the percentile rank among a total business and indirect
cost. The ratio can also be used to calculate the earnings that will result from different sales
volumes. This ratio shows how much each dollar of sales is ready to discuss an absorption
costing includes and profit. The contribution margin (revenue less all variable costs) is divided
by sales to get the proportion. Following removing variable expenses, contribution margin is a
metric that shows how much money a company makes on every commodity it delivers.
Increasing the wholesale price by the amount sold less the marginal cost times the cost of goods
sold yields the contribution margin. The generated value is then used to offset the company'
fixed expenses and to calculate the break-even threshold.
REFERENCES
Books and Journal
Baños, J. and López-Manjón, J. D., 2021. Revisiting the boundaries of the sacred: guilds and
brotherhoods’ accounting in the last decade of the 16th century. De Computis-Revista
Española de Historia de la Contabilidad. 18(1). pp.55-73.
Hassan, M. K. and et.al, 2021. Bibliometric analysis of the Journal of Islamic Accounting and
Business Research: Ten years review. COLLNET Journal of Scientometrics and
Information Management. 15(1). pp.63-88.
Hur, K. S. and Hwang, I. T., 2021. The effect of bank governance on borrowers’ accounting
choices. Asia-Pacific Journal of Accounting & Economics, pp.1-27.
Callejas, D. G. and Ocampo-Salazar, C. A., 2021. Whither Environmental Accounting. The
Challenge of Ecological and Green Accounting. Environment and Innovation: Strategies
to Promote Growth and Sustainability, p.179.
Bond, D., and et.al, 2021. Research productivity of Australian accounting academics. Accounting
& Finance, 61(1), pp.1081-1104.
Kryshtal, H., and et.al, 2021. ACCOUNTING AS AN INTEGRAL PART OF FINANCIAL
AND ECONOMIC ASSESSMENT OF BUSINESS ENTITIES. Natsional'nyi Hirnychyi
Universytet. Naukovyi Visnyk, (3), pp.162-166.
Foroodi, M. and Hejazi, R., 2021. Presenting a reductive model of Earnings management based
on Multi_ grounded Theory approach. Journal of Knowledge Accounting.
Krismiaji, K., 2021. Audit Quality Characteristics and Accounting Conservatism: Empirical
Study in Indonesian Company. ATESTASI: Jurnal Ilmiah Akuntansi. 4(2). pp.132-141.
1 out of 13
Related Documents


Your All-in-One AI-Powered Toolkit for Academic Success.
+13062052269
info@desklib.com
Available 24*7 on WhatsApp / Email
![[object Object]](/_next/static/media/star-bottom.7253800d.svg)
Unlock your academic potential
© 2024 | Zucol Services PVT LTD | All rights reserved.