Management Accounting: Cost of Goods Manufactured, Australian Dairy Products in China, Chinese vs Western Approaches, Sales and Purchase Budgets
VerifiedAdded on 2023/06/14
|15
|3683
|487
AI Summary
This article covers topics related to management accounting such as cost of goods manufactured, Australian dairy products in China, Chinese vs Western approaches, and sales and purchase budgets.
Contribute Materials
Your contribution can guide someone’s learning journey. Share your
documents today.
Running head: MANAGEMENT ACCOUNTING
Management Accounting
Name of the Student:
Name of the University:
Author’s Note:
Management Accounting
Name of the Student:
Name of the University:
Author’s Note:
Secure Best Marks with AI Grader
Need help grading? Try our AI Grader for instant feedback on your assignments.
1
MANAGEMENT ACCOUNTING
Table of Contents
Answer to Question No 1................................................................................................................2
Answer to Question No 2................................................................................................................3
Australian dairy products benefits and advantages in China.......................................................3
Difference between Chinese and the Western approaches to management accounting..............4
Concepts of guanxi and power distance......................................................................................4
Answer to Question No 3................................................................................................................5
Requirement a..............................................................................................................................5
Requirement b..............................................................................................................................7
Requirement c..............................................................................................................................7
Answer to Question No 4................................................................................................................8
Difference between fixed and variable cost.................................................................................8
Difference between product and period cost...............................................................................9
Answer to Question No 5 (Strategic Management Accounting)...................................................10
Requirement i.............................................................................................................................10
Requirement ii...........................................................................................................................11
Requirement iii..........................................................................................................................11
Answer to Question 5 (Ethics Case Study)....................................................................................12
Reference List................................................................................................................................13
2
MANAGEMENT ACCOUNTING
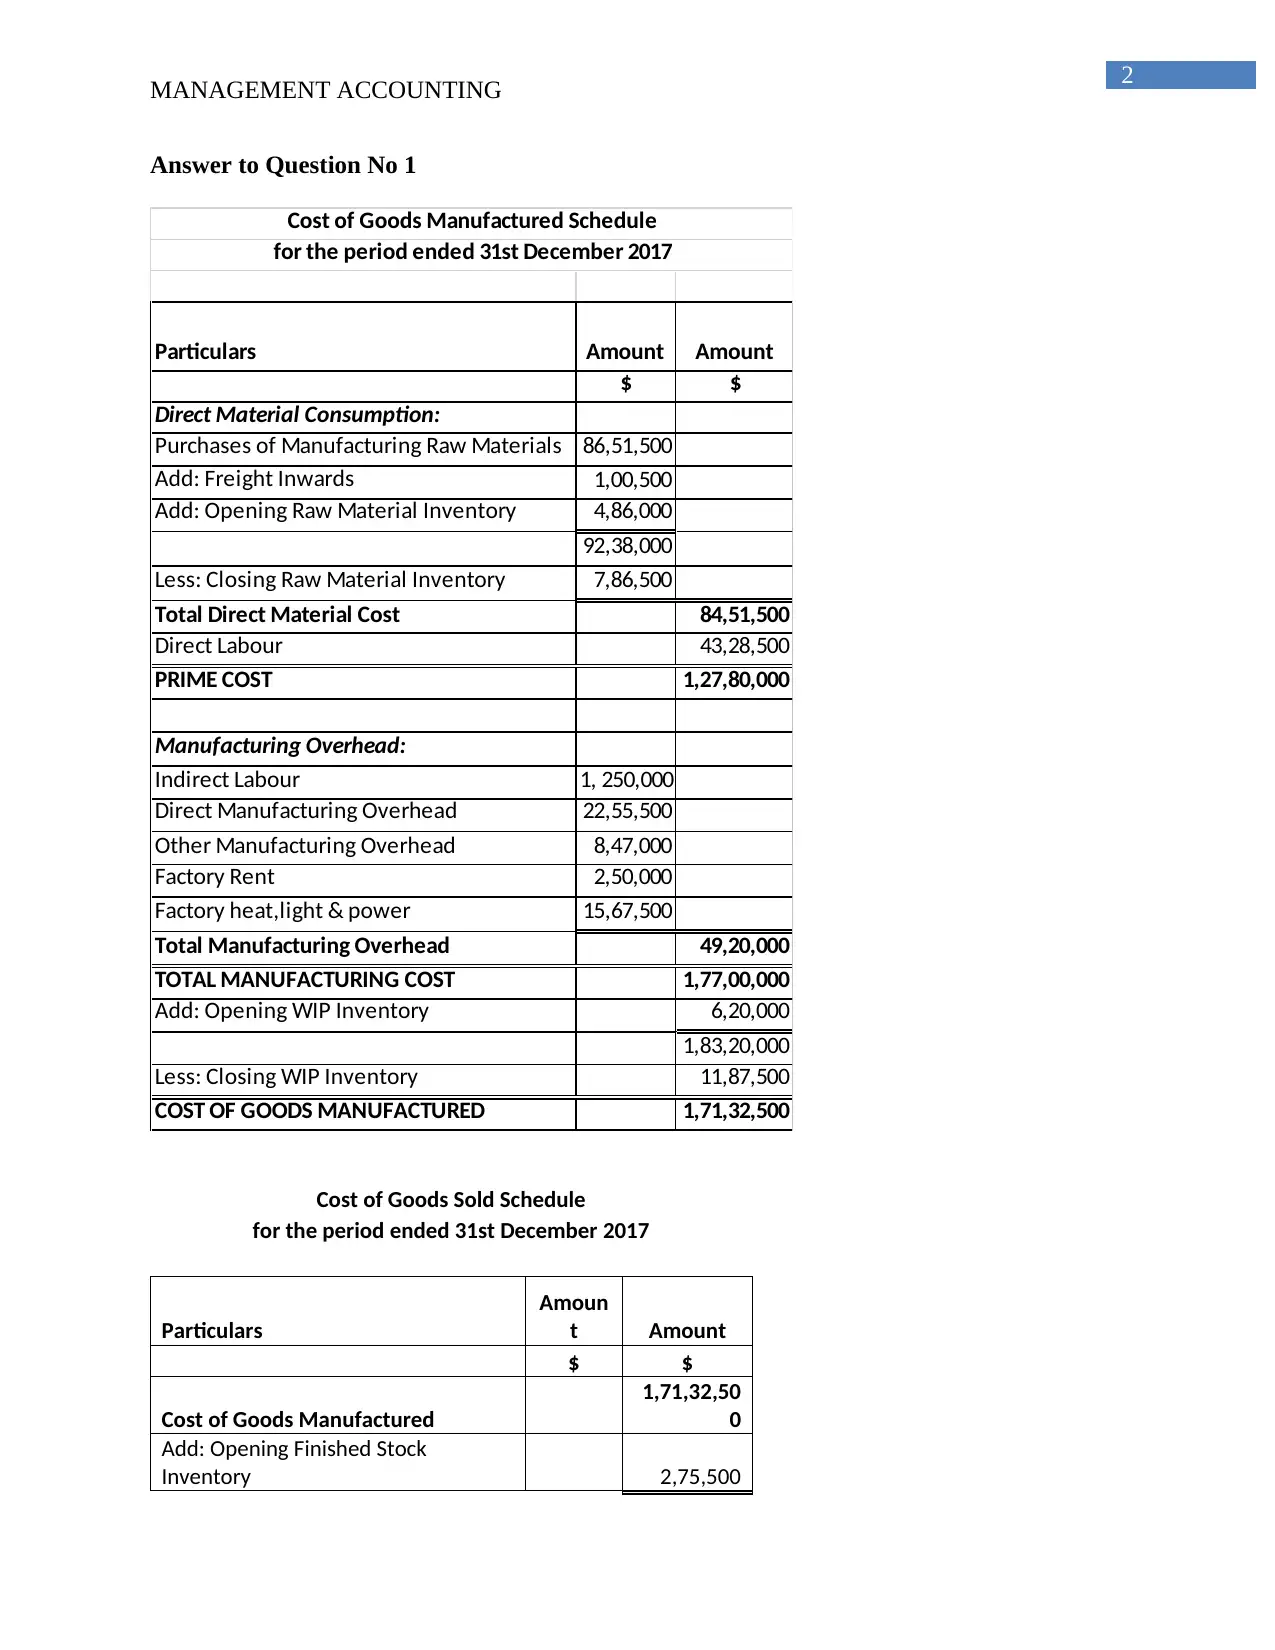
Answer to Question No 1
Particulars Amount Amount
$ $
Direct Material Consumption:
Purchases of Manufacturing Raw Materials 86,51,500
Add: Freight Inwards 1,00,500
Add: Opening Raw Material Inventory 4,86,000
92,38,000
Less: Closing Raw Material Inventory 7,86,500
Total Direct Material Cost 84,51,500
Direct Labour 43,28,500
PRIME COST 1,27,80,000
Manufacturing Overhead:
Indirect Labour 1, 250,000
Direct Manufacturing Overhead 22,55,500
Other Manufacturing Overhead 8,47,000
Factory Rent 2,50,000
Factory heat,light & power 15,67,500
Total Manufacturing Overhead 49,20,000
TOTAL MANUFACTURING COST 1,77,00,000
Add: Opening WIP Inventory 6,20,000
1,83,20,000
Less: Closing WIP Inventory 11,87,500
COST OF GOODS MANUFACTURED 1,71,32,500
Cost of Goods Manufactured Schedule
for the period ended 31st December 2017
Cost of Goods Sold Schedule
for the period ended 31st December 2017
Particulars
Amoun
t Amount
$ $
Cost of Goods Manufactured
1,71,32,50
0
Add: Opening Finished Stock
Inventory 2,75,500
MANAGEMENT ACCOUNTING
Answer to Question No 1
Particulars Amount Amount
$ $
Direct Material Consumption:
Purchases of Manufacturing Raw Materials 86,51,500
Add: Freight Inwards 1,00,500
Add: Opening Raw Material Inventory 4,86,000
92,38,000
Less: Closing Raw Material Inventory 7,86,500
Total Direct Material Cost 84,51,500
Direct Labour 43,28,500
PRIME COST 1,27,80,000
Manufacturing Overhead:
Indirect Labour 1, 250,000
Direct Manufacturing Overhead 22,55,500
Other Manufacturing Overhead 8,47,000
Factory Rent 2,50,000
Factory heat,light & power 15,67,500
Total Manufacturing Overhead 49,20,000
TOTAL MANUFACTURING COST 1,77,00,000
Add: Opening WIP Inventory 6,20,000
1,83,20,000
Less: Closing WIP Inventory 11,87,500
COST OF GOODS MANUFACTURED 1,71,32,500
Cost of Goods Manufactured Schedule
for the period ended 31st December 2017
Cost of Goods Sold Schedule
for the period ended 31st December 2017
Particulars
Amoun
t Amount
$ $
Cost of Goods Manufactured
1,71,32,50
0
Add: Opening Finished Stock
Inventory 2,75,500
3
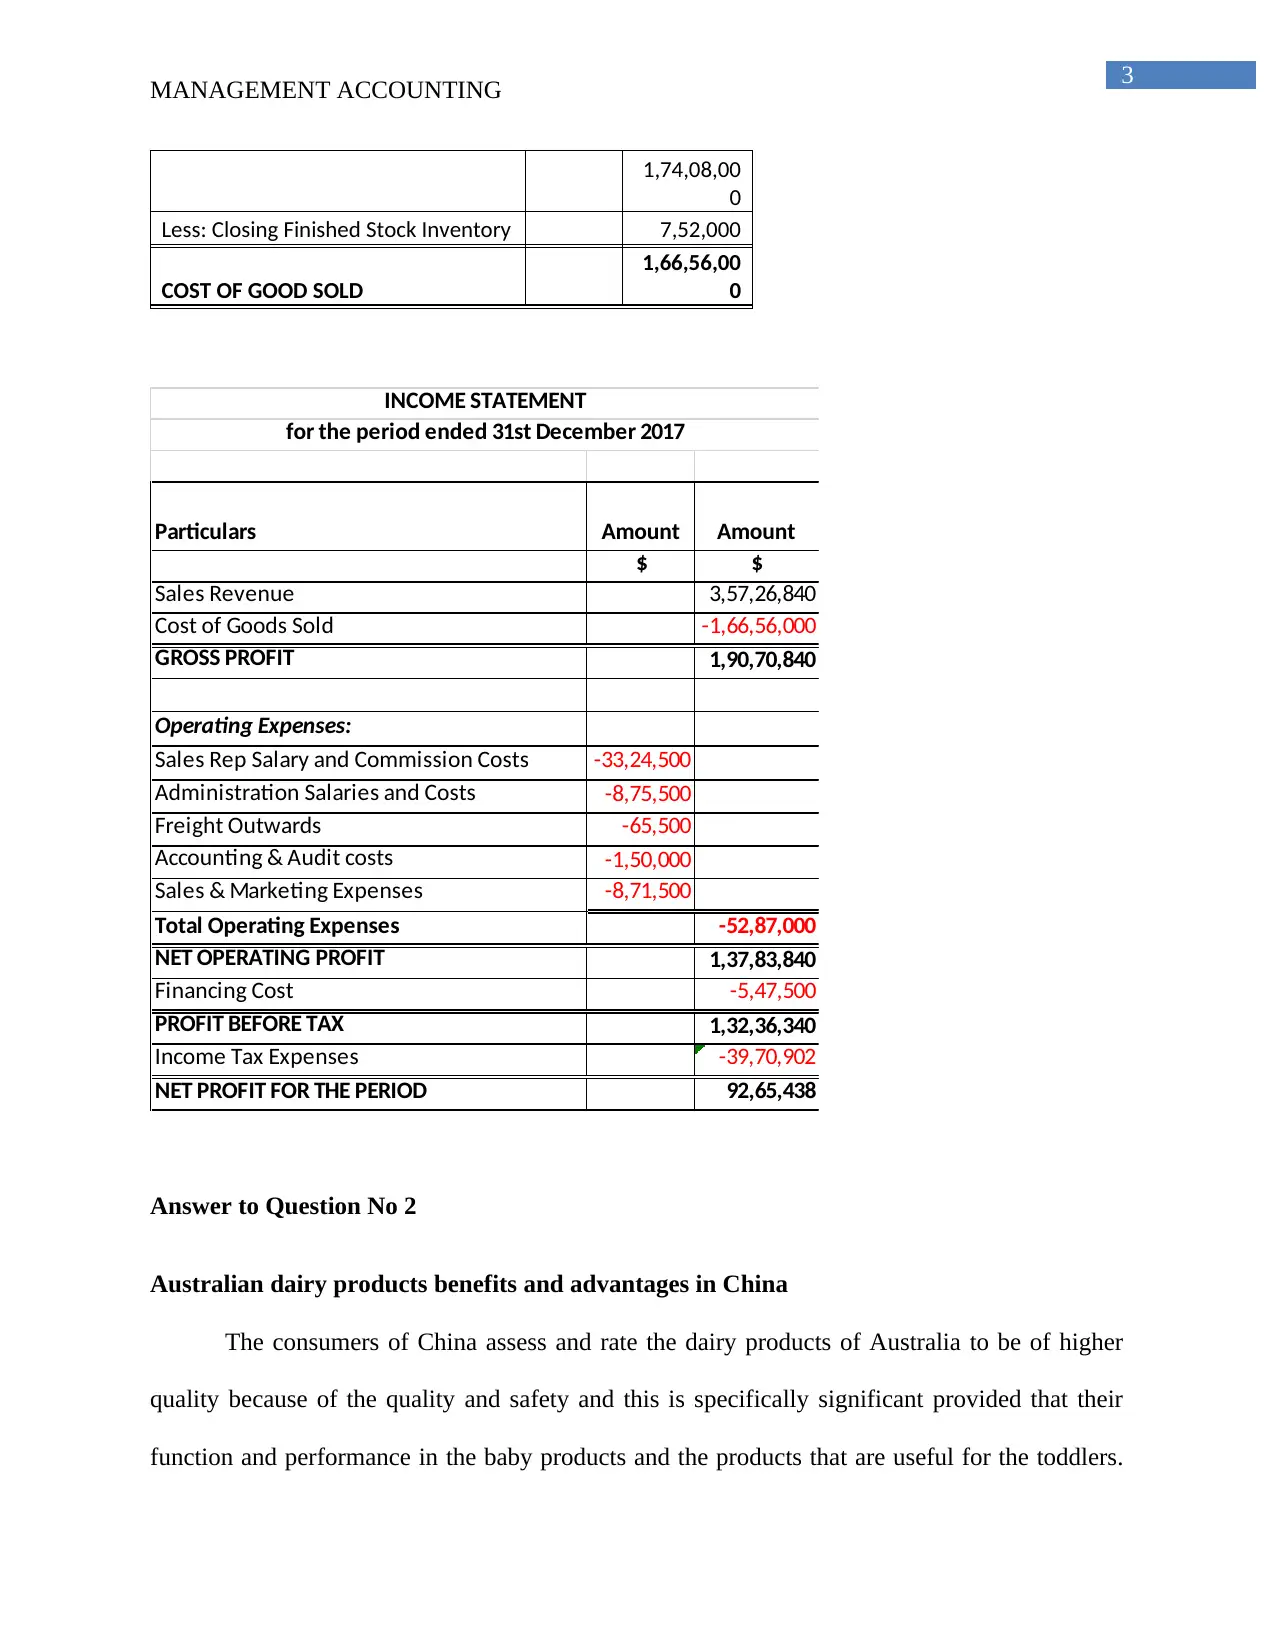
MANAGEMENT ACCOUNTING
1,74,08,00
0
Less: Closing Finished Stock Inventory 7,52,000
COST OF GOOD SOLD
1,66,56,00
0
Particulars Amount Amount
$ $
Sales Revenue 3,57,26,840
Cost of Goods Sold -1,66,56,000
GROSS PROFIT 1,90,70,840
Operating Expenses:
Sales Rep Salary and Commission Costs -33,24,500
Administration Salaries and Costs -8,75,500
Freight Outwards -65,500
Accounting & Audit costs -1,50,000
Sales & Marketing Expenses -8,71,500
Total Operating Expenses -52,87,000
NET OPERATING PROFIT 1,37,83,840
Financing Cost -5,47,500
PROFIT BEFORE TAX 1,32,36,340
Income Tax Expenses -39,70,902
NET PROFIT FOR THE PERIOD 92,65,438
INCOME STATEMENT
for the period ended 31st December 2017
Answer to Question No 2
Australian dairy products benefits and advantages in China
The consumers of China assess and rate the dairy products of Australia to be of higher
quality because of the quality and safety and this is specifically significant provided that their
function and performance in the baby products and the products that are useful for the toddlers.
Secure Best Marks with AI Grader
Need help grading? Try our AI Grader for instant feedback on your assignments.
4
MANAGEMENT ACCOUNTING
This would be helpful in developing and extending the profiles and the accessibility of the dairy
products of Australia. In accordance to the dairy products of Australia, China has become the
point of focus in order to increase their sales (Gray et al., 2016). The expansion and the
development for the desires and the demands for the dairy products in China is leading to an
extensive change in the society of China and create new opportunities for the products that are
ready for the consumers.
Difference between Chinese and the Western approaches to management accounting
In the countries that are located in the West, management accounting is even known as
the cost accounting of their ancestors that has been created after the early 19th century. The
establishment and the creation of management accounting are impacted by the management
science development factor (Deegan, 2017). The process of management accounting in the
western societies is the rational and real implication of the management operations that are
reliant on discipline. However, the implication of management accounting in China is limited by
the society that is existent in China. In order to enhancer and influence the extensive utilisation
of the process of management accounting, the factors related to the society and the culture is
even taken into consideration.
Concepts of guanxi and power distance
It is seen that power distance is the degree with respect to which information is granted
by the community that there is an existence of unequal power distribution. Every entity or an
individual has their authoritative place within the community and culture in case the culture has
extensive level of power distance (Russell et al., 2017). However, on the other hand, the entities
who are within the culture and have very low level of power distance prefers to stay powerful
and younger individuals and do not disclose their status, image and power. The fundamentals of
5
MANAGEMENT ACCOUNTING
guanxi are looked upon to be another kind of cultural value in China that is a replication of the
Confucianism philosophy.
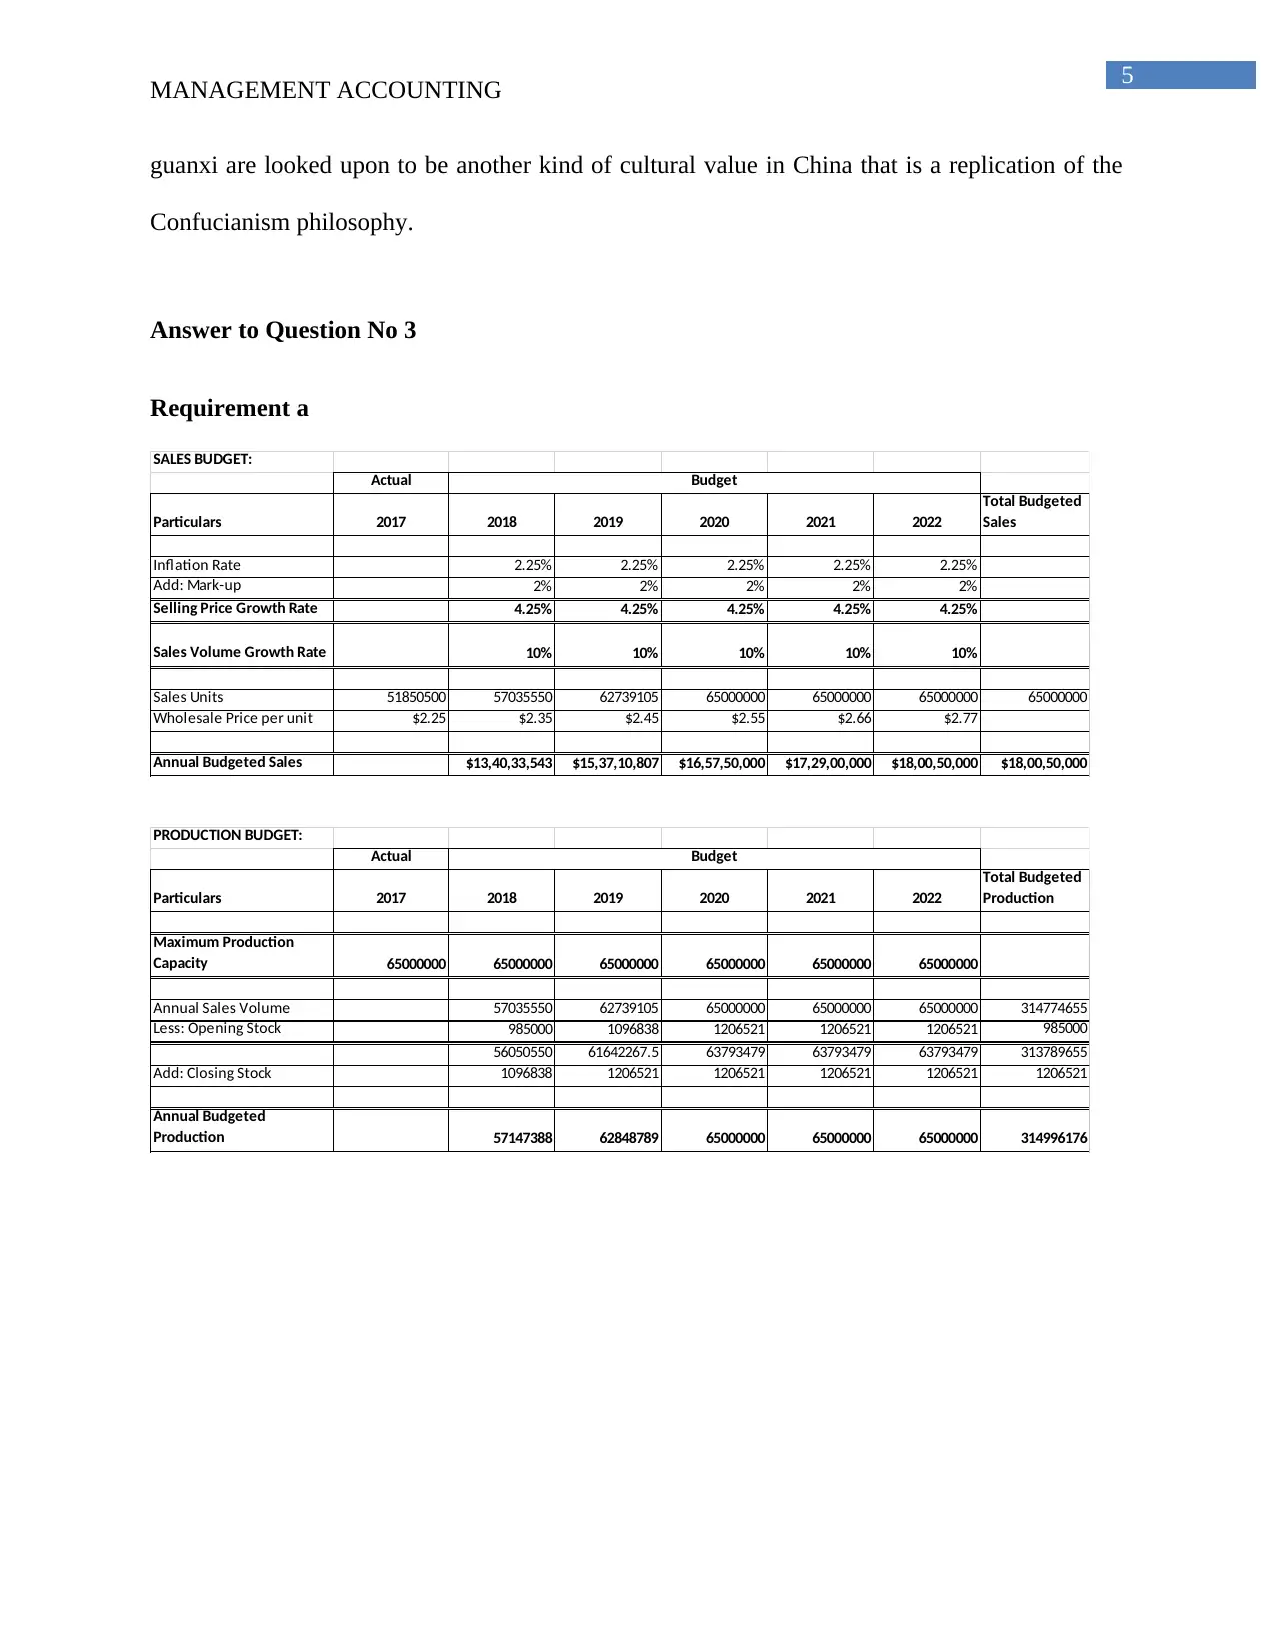
Answer to Question No 3
Requirement a
SALES BUDGET:
Actual
Particulars 2017 2018 2019 2020 2021 2022
Total Budgeted
Sales
Inflation Rate 2.25% 2.25% 2.25% 2.25% 2.25%
Add: Mark-up 2% 2% 2% 2% 2%
Selling Price Growth Rate 4.25% 4.25% 4.25% 4.25% 4.25%
Sales Volume Growth Rate 10% 10% 10% 10% 10%
Sales Units 51850500 57035550 62739105 65000000 65000000 65000000 65000000
Wholesale Price per unit $2.25 $2.35 $2.45 $2.55 $2.66 $2.77
Annual Budgeted Sales $13,40,33,543 $15,37,10,807 $16,57,50,000 $17,29,00,000 $18,00,50,000 $18,00,50,000
Budget
PRODUCTION BUDGET:
Actual
Particulars 2017 2018 2019 2020 2021 2022
Total Budgeted
Production
Maximum Production
Capacity 65000000 65000000 65000000 65000000 65000000 65000000
Annual Sales Volume 57035550 62739105 65000000 65000000 65000000 314774655
Less: Opening Stock 985000 1096838 1206521 1206521 1206521 985000
56050550 61642267.5 63793479 63793479 63793479 313789655
Add: Closing Stock 1096838 1206521 1206521 1206521 1206521 1206521
Annual Budgeted
Production 57147388 62848789 65000000 65000000 65000000 314996176
Budget
MANAGEMENT ACCOUNTING
guanxi are looked upon to be another kind of cultural value in China that is a replication of the
Confucianism philosophy.
Answer to Question No 3
Requirement a
SALES BUDGET:
Actual
Particulars 2017 2018 2019 2020 2021 2022
Total Budgeted
Sales
Inflation Rate 2.25% 2.25% 2.25% 2.25% 2.25%
Add: Mark-up 2% 2% 2% 2% 2%
Selling Price Growth Rate 4.25% 4.25% 4.25% 4.25% 4.25%
Sales Volume Growth Rate 10% 10% 10% 10% 10%
Sales Units 51850500 57035550 62739105 65000000 65000000 65000000 65000000
Wholesale Price per unit $2.25 $2.35 $2.45 $2.55 $2.66 $2.77
Annual Budgeted Sales $13,40,33,543 $15,37,10,807 $16,57,50,000 $17,29,00,000 $18,00,50,000 $18,00,50,000
Budget
PRODUCTION BUDGET:
Actual
Particulars 2017 2018 2019 2020 2021 2022
Total Budgeted
Production
Maximum Production
Capacity 65000000 65000000 65000000 65000000 65000000 65000000
Annual Sales Volume 57035550 62739105 65000000 65000000 65000000 314774655
Less: Opening Stock 985000 1096838 1206521 1206521 1206521 985000
56050550 61642267.5 63793479 63793479 63793479 313789655
Add: Closing Stock 1096838 1206521 1206521 1206521 1206521 1206521
Annual Budgeted
Production 57147388 62848789 65000000 65000000 65000000 314996176
Budget
6
MANAGEMENT ACCOUNTING
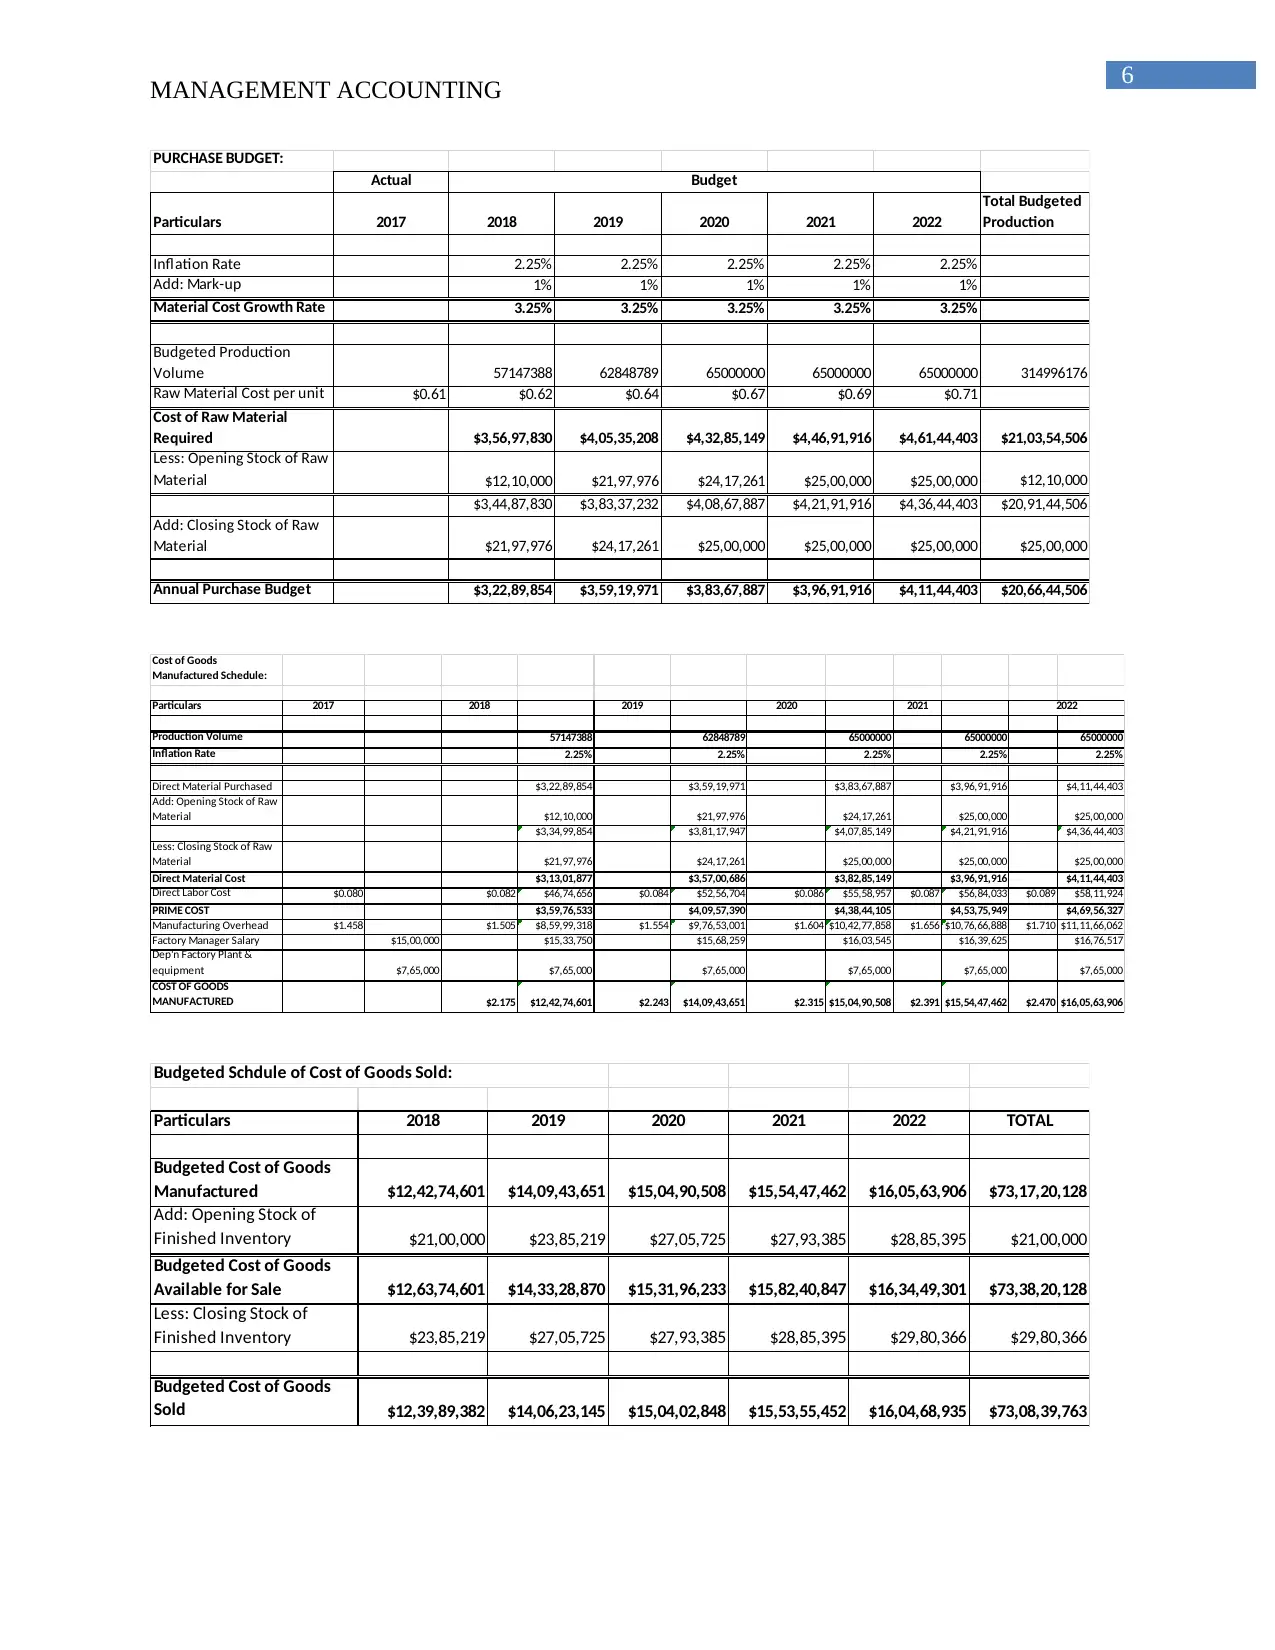
PURCHASE BUDGET:
Actual
Particulars 2017 2018 2019 2020 2021 2022
Total Budgeted
Production
Inflation Rate 2.25% 2.25% 2.25% 2.25% 2.25%
Add: Mark-up 1% 1% 1% 1% 1%
Material Cost Growth Rate 3.25% 3.25% 3.25% 3.25% 3.25%
Budgeted Production
Volume 57147388 62848789 65000000 65000000 65000000 314996176
Raw Material Cost per unit $0.61 $0.62 $0.64 $0.67 $0.69 $0.71
Cost of Raw Material
Required $3,56,97,830 $4,05,35,208 $4,32,85,149 $4,46,91,916 $4,61,44,403 $21,03,54,506
Less: Opening Stock of Raw
Material $12,10,000 $21,97,976 $24,17,261 $25,00,000 $25,00,000 $12,10,000
$3,44,87,830 $3,83,37,232 $4,08,67,887 $4,21,91,916 $4,36,44,403 $20,91,44,506
Add: Closing Stock of Raw
Material $21,97,976 $24,17,261 $25,00,000 $25,00,000 $25,00,000 $25,00,000
Annual Purchase Budget $3,22,89,854 $3,59,19,971 $3,83,67,887 $3,96,91,916 $4,11,44,403 $20,66,44,506
Budget
Cost of Goods
Manufactured Schedule:
Particulars 2017 2018 2019 2020 2021
Production Volume 57147388 62848789 65000000 65000000 65000000
Inflation Rate 2.25% 2.25% 2.25% 2.25% 2.25%
Direct Material Purchased $3,22,89,854 $3,59,19,971 $3,83,67,887 $3,96,91,916 $4,11,44,403
Add: Opening Stock of Raw
Material $12,10,000 $21,97,976 $24,17,261 $25,00,000 $25,00,000
$3,34,99,854 $3,81,17,947 $4,07,85,149 $4,21,91,916 $4,36,44,403
Less: Closing Stock of Raw
Material $21,97,976 $24,17,261 $25,00,000 $25,00,000 $25,00,000
Direct Material Cost $3,13,01,877 $3,57,00,686 $3,82,85,149 $3,96,91,916 $4,11,44,403
Direct Labor Cost $0.080 $0.082 $46,74,656 $0.084 $52,56,704 $0.086 $55,58,957 $0.087 $56,84,033 $0.089 $58,11,924
PRIME COST $3,59,76,533 $4,09,57,390 $4,38,44,105 $4,53,75,949 $4,69,56,327
Manufacturing Overhead $1.458 $1.505 $8,59,99,318 $1.554 $9,76,53,001 $1.604 $10,42,77,858 $1.656 $10,76,66,888 $1.710 $11,11,66,062
Factory Manager Salary $15,00,000 $15,33,750 $15,68,259 $16,03,545 $16,39,625 $16,76,517
Dep'n Factory Plant &
equipment $7,65,000 $7,65,000 $7,65,000 $7,65,000 $7,65,000 $7,65,000
COST OF GOODS
MANUFACTURED $2.175 $12,42,74,601 $2.243 $14,09,43,651 $2.315 $15,04,90,508 $2.391 $15,54,47,462 $2.470 $16,05,63,906
2022
Particulars 2018 2019 2020 2021 2022 TOTAL
Budgeted Cost of Goods
Manufactured $12,42,74,601 $14,09,43,651 $15,04,90,508 $15,54,47,462 $16,05,63,906 $73,17,20,128
Add: Opening Stock of
Finished Inventory $21,00,000 $23,85,219 $27,05,725 $27,93,385 $28,85,395 $21,00,000
Budgeted Cost of Goods
Available for Sale $12,63,74,601 $14,33,28,870 $15,31,96,233 $15,82,40,847 $16,34,49,301 $73,38,20,128
Less: Closing Stock of
Finished Inventory $23,85,219 $27,05,725 $27,93,385 $28,85,395 $29,80,366 $29,80,366
Budgeted Cost of Goods
Sold $12,39,89,382 $14,06,23,145 $15,04,02,848 $15,53,55,452 $16,04,68,935 $73,08,39,763
Budgeted Schdule of Cost of Goods Sold:
MANAGEMENT ACCOUNTING
PURCHASE BUDGET:
Actual
Particulars 2017 2018 2019 2020 2021 2022
Total Budgeted
Production
Inflation Rate 2.25% 2.25% 2.25% 2.25% 2.25%
Add: Mark-up 1% 1% 1% 1% 1%
Material Cost Growth Rate 3.25% 3.25% 3.25% 3.25% 3.25%
Budgeted Production
Volume 57147388 62848789 65000000 65000000 65000000 314996176
Raw Material Cost per unit $0.61 $0.62 $0.64 $0.67 $0.69 $0.71
Cost of Raw Material
Required $3,56,97,830 $4,05,35,208 $4,32,85,149 $4,46,91,916 $4,61,44,403 $21,03,54,506
Less: Opening Stock of Raw
Material $12,10,000 $21,97,976 $24,17,261 $25,00,000 $25,00,000 $12,10,000
$3,44,87,830 $3,83,37,232 $4,08,67,887 $4,21,91,916 $4,36,44,403 $20,91,44,506
Add: Closing Stock of Raw
Material $21,97,976 $24,17,261 $25,00,000 $25,00,000 $25,00,000 $25,00,000
Annual Purchase Budget $3,22,89,854 $3,59,19,971 $3,83,67,887 $3,96,91,916 $4,11,44,403 $20,66,44,506
Budget
Cost of Goods
Manufactured Schedule:
Particulars 2017 2018 2019 2020 2021
Production Volume 57147388 62848789 65000000 65000000 65000000
Inflation Rate 2.25% 2.25% 2.25% 2.25% 2.25%
Direct Material Purchased $3,22,89,854 $3,59,19,971 $3,83,67,887 $3,96,91,916 $4,11,44,403
Add: Opening Stock of Raw
Material $12,10,000 $21,97,976 $24,17,261 $25,00,000 $25,00,000
$3,34,99,854 $3,81,17,947 $4,07,85,149 $4,21,91,916 $4,36,44,403
Less: Closing Stock of Raw
Material $21,97,976 $24,17,261 $25,00,000 $25,00,000 $25,00,000
Direct Material Cost $3,13,01,877 $3,57,00,686 $3,82,85,149 $3,96,91,916 $4,11,44,403
Direct Labor Cost $0.080 $0.082 $46,74,656 $0.084 $52,56,704 $0.086 $55,58,957 $0.087 $56,84,033 $0.089 $58,11,924
PRIME COST $3,59,76,533 $4,09,57,390 $4,38,44,105 $4,53,75,949 $4,69,56,327
Manufacturing Overhead $1.458 $1.505 $8,59,99,318 $1.554 $9,76,53,001 $1.604 $10,42,77,858 $1.656 $10,76,66,888 $1.710 $11,11,66,062
Factory Manager Salary $15,00,000 $15,33,750 $15,68,259 $16,03,545 $16,39,625 $16,76,517
Dep'n Factory Plant &
equipment $7,65,000 $7,65,000 $7,65,000 $7,65,000 $7,65,000 $7,65,000
COST OF GOODS
MANUFACTURED $2.175 $12,42,74,601 $2.243 $14,09,43,651 $2.315 $15,04,90,508 $2.391 $15,54,47,462 $2.470 $16,05,63,906
2022
Particulars 2018 2019 2020 2021 2022 TOTAL
Budgeted Cost of Goods
Manufactured $12,42,74,601 $14,09,43,651 $15,04,90,508 $15,54,47,462 $16,05,63,906 $73,17,20,128
Add: Opening Stock of
Finished Inventory $21,00,000 $23,85,219 $27,05,725 $27,93,385 $28,85,395 $21,00,000
Budgeted Cost of Goods
Available for Sale $12,63,74,601 $14,33,28,870 $15,31,96,233 $15,82,40,847 $16,34,49,301 $73,38,20,128
Less: Closing Stock of
Finished Inventory $23,85,219 $27,05,725 $27,93,385 $28,85,395 $29,80,366 $29,80,366
Budgeted Cost of Goods
Sold $12,39,89,382 $14,06,23,145 $15,04,02,848 $15,53,55,452 $16,04,68,935 $73,08,39,763
Budgeted Schdule of Cost of Goods Sold:
Paraphrase This Document
Need a fresh take? Get an instant paraphrase of this document with our AI Paraphraser
7
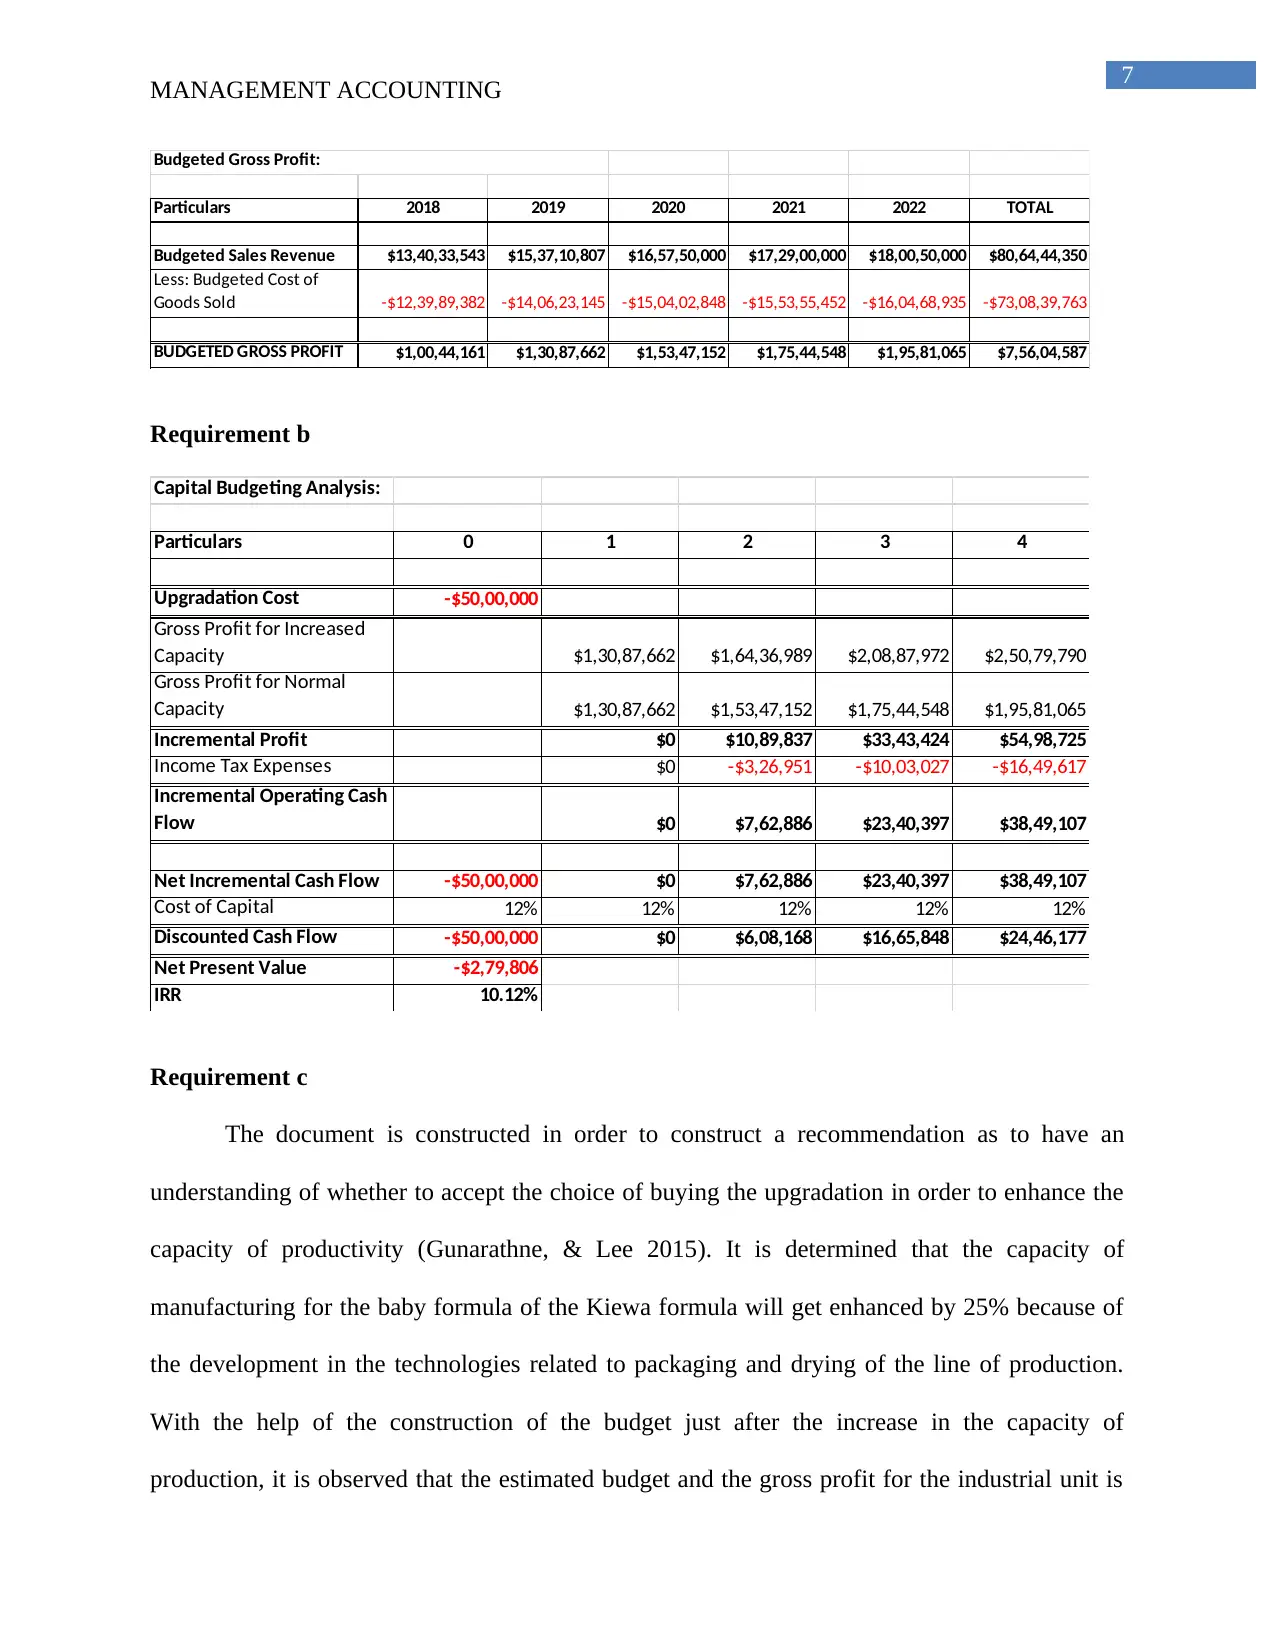
MANAGEMENT ACCOUNTING
Particulars 2018 2019 2020 2021 2022 TOTAL
Budgeted Sales Revenue $13,40,33,543 $15,37,10,807 $16,57,50,000 $17,29,00,000 $18,00,50,000 $80,64,44,350
Less: Budgeted Cost of
Goods Sold -$12,39,89,382 -$14,06,23,145 -$15,04,02,848 -$15,53,55,452 -$16,04,68,935 -$73,08,39,763
BUDGETED GROSS PROFIT $1,00,44,161 $1,30,87,662 $1,53,47,152 $1,75,44,548 $1,95,81,065 $7,56,04,587
Budgeted Gross Profit:
Requirement b
Capital Budgeting Analysis:
Particulars 0 1 2 3 4
Upgradation Cost -$50,00,000
Gross Profit for Increased
Capacity $1,30,87,662 $1,64,36,989 $2,08,87,972 $2,50,79,790
Gross Profit for Normal
Capacity $1,30,87,662 $1,53,47,152 $1,75,44,548 $1,95,81,065
Incremental Profit $0 $10,89,837 $33,43,424 $54,98,725
Income Tax Expenses $0 -$3,26,951 -$10,03,027 -$16,49,617
Incremental Operating Cash
Flow $0 $7,62,886 $23,40,397 $38,49,107
Net Incremental Cash Flow -$50,00,000 $0 $7,62,886 $23,40,397 $38,49,107
Cost of Capital 12% 12% 12% 12% 12%
Discounted Cash Flow -$50,00,000 $0 $6,08,168 $16,65,848 $24,46,177
Net Present Value -$2,79,806
IRR 10.12%
Requirement c
The document is constructed in order to construct a recommendation as to have an
understanding of whether to accept the choice of buying the upgradation in order to enhance the
capacity of productivity (Gunarathne, & Lee 2015). It is determined that the capacity of
manufacturing for the baby formula of the Kiewa formula will get enhanced by 25% because of
the development in the technologies related to packaging and drying of the line of production.
With the help of the construction of the budget just after the increase in the capacity of
production, it is observed that the estimated budget and the gross profit for the industrial unit is
8
MANAGEMENT ACCOUNTING
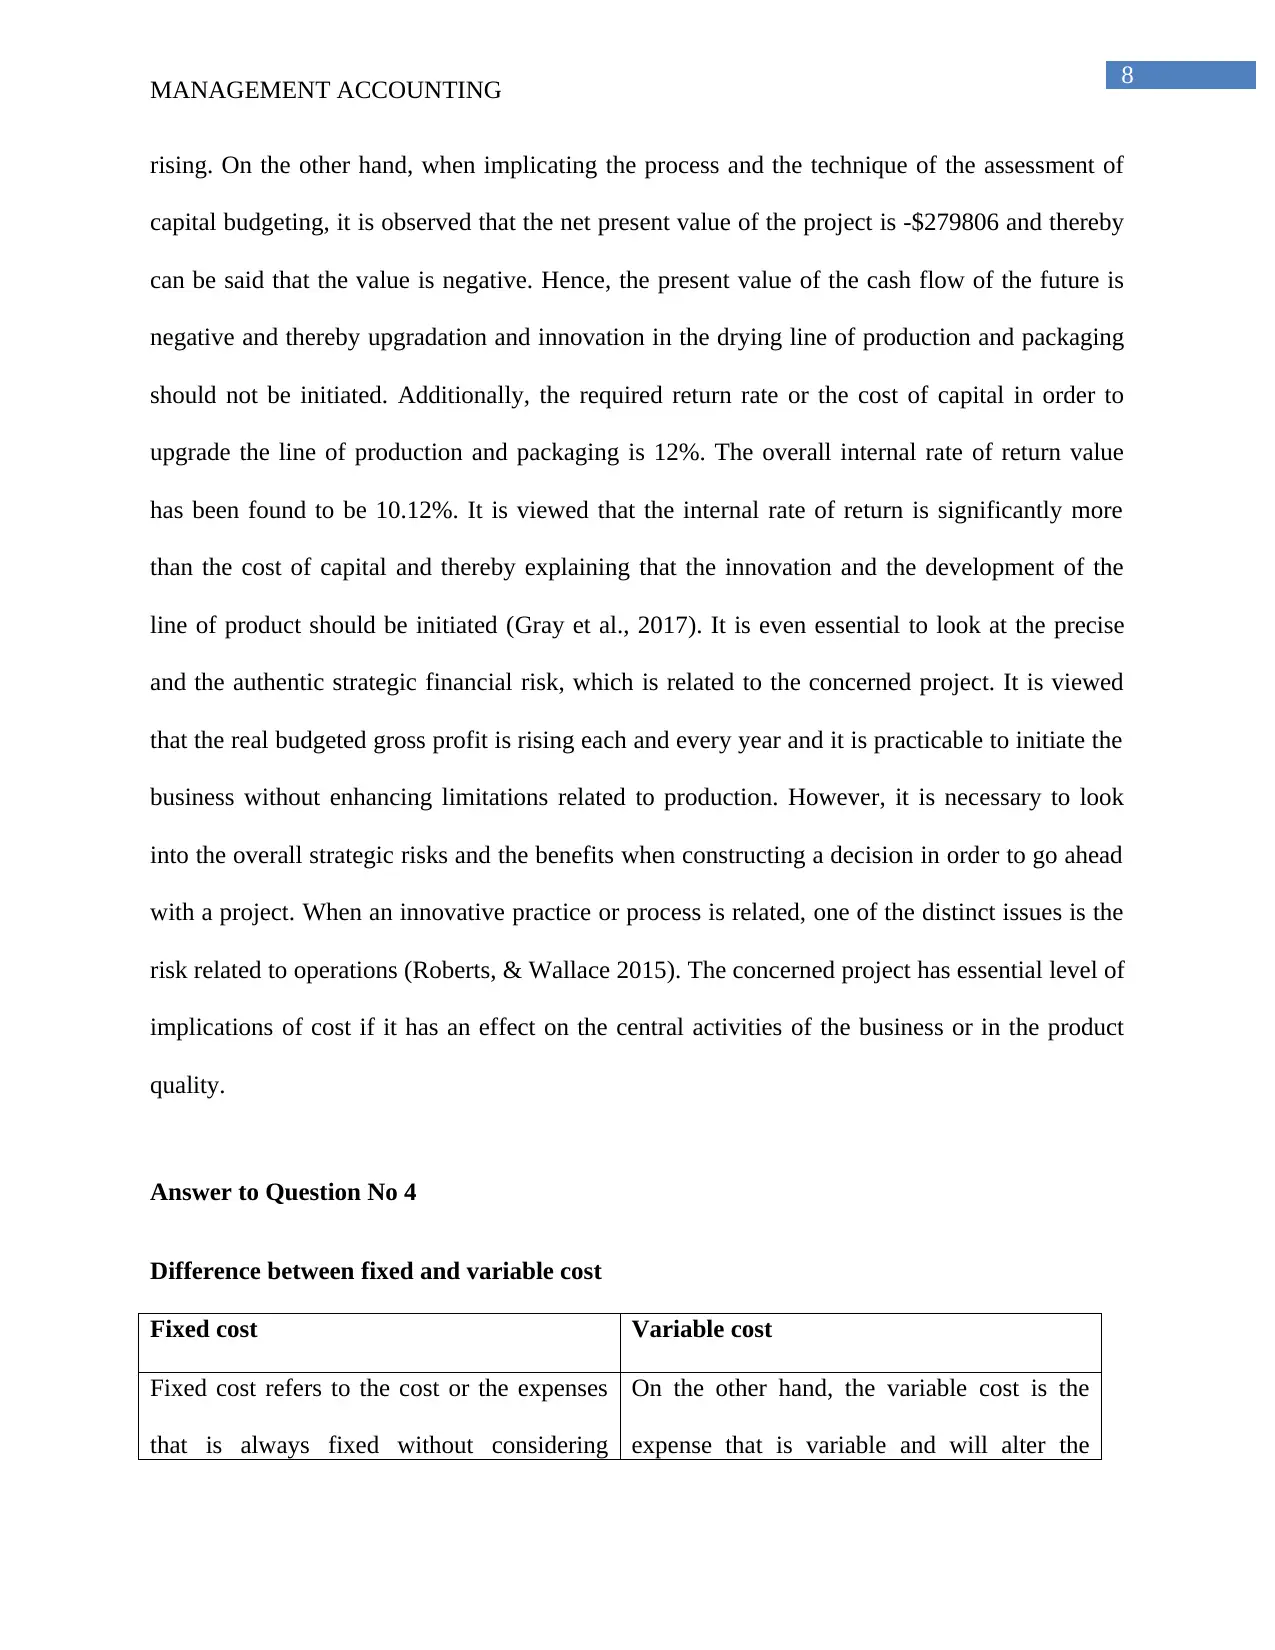
rising. On the other hand, when implicating the process and the technique of the assessment of
capital budgeting, it is observed that the net present value of the project is -$279806 and thereby
can be said that the value is negative. Hence, the present value of the cash flow of the future is
negative and thereby upgradation and innovation in the drying line of production and packaging
should not be initiated. Additionally, the required return rate or the cost of capital in order to
upgrade the line of production and packaging is 12%. The overall internal rate of return value
has been found to be 10.12%. It is viewed that the internal rate of return is significantly more
than the cost of capital and thereby explaining that the innovation and the development of the
line of product should be initiated (Gray et al., 2017). It is even essential to look at the precise
and the authentic strategic financial risk, which is related to the concerned project. It is viewed
that the real budgeted gross profit is rising each and every year and it is practicable to initiate the
business without enhancing limitations related to production. However, it is necessary to look
into the overall strategic risks and the benefits when constructing a decision in order to go ahead
with a project. When an innovative practice or process is related, one of the distinct issues is the
risk related to operations (Roberts, & Wallace 2015). The concerned project has essential level of
implications of cost if it has an effect on the central activities of the business or in the product
quality.
Answer to Question No 4
Difference between fixed and variable cost
Fixed cost Variable cost
Fixed cost refers to the cost or the expenses
that is always fixed without considering
On the other hand, the variable cost is the
expense that is variable and will alter the
MANAGEMENT ACCOUNTING
rising. On the other hand, when implicating the process and the technique of the assessment of
capital budgeting, it is observed that the net present value of the project is -$279806 and thereby
can be said that the value is negative. Hence, the present value of the cash flow of the future is
negative and thereby upgradation and innovation in the drying line of production and packaging
should not be initiated. Additionally, the required return rate or the cost of capital in order to
upgrade the line of production and packaging is 12%. The overall internal rate of return value
has been found to be 10.12%. It is viewed that the internal rate of return is significantly more
than the cost of capital and thereby explaining that the innovation and the development of the
line of product should be initiated (Gray et al., 2017). It is even essential to look at the precise
and the authentic strategic financial risk, which is related to the concerned project. It is viewed
that the real budgeted gross profit is rising each and every year and it is practicable to initiate the
business without enhancing limitations related to production. However, it is necessary to look
into the overall strategic risks and the benefits when constructing a decision in order to go ahead
with a project. When an innovative practice or process is related, one of the distinct issues is the
risk related to operations (Roberts, & Wallace 2015). The concerned project has essential level of
implications of cost if it has an effect on the central activities of the business or in the product
quality.
Answer to Question No 4
Difference between fixed and variable cost
Fixed cost Variable cost
Fixed cost refers to the cost or the expenses
that is always fixed without considering
On the other hand, the variable cost is the
expense that is variable and will alter the
9
MANAGEMENT ACCOUNTING
degree of output that is manufactured by a
company (Burritt, R., & Christ 2016)
extent of output (Latan et al., 2018).
It is seen that fixed cost is the mixture of the
fixed distribution and selling overhead,
production overhead that is fixed and the
fixed administrative overhead.
On the other hand, variable cost is the blend
of the direct expenditure, direct labor, and
production overhead that is variable, direct
material and variable distribution and selling
overhead.
Fixed costs that is related to rent, tax,
depreciation and salary are instances of fixed
cost
Variable cost associated with the materials
used, wages, sales commission and
packaging expenses are examples of variable
cost.
Difference between product and period cost
Product cost Period cost
The product cost takes place when the
products are gained or purchased
Period cost on the other hand takes place
when there is an absence in the purchase of
inventory or in the manufacturing operations.
Product cost is a key element of the
manufacturing expenses.
On the other hand, periodic cost is not
essentially a segment of the manufacturing
mechanisms.
Relevant range addresses the distinct degree of the operations that is limited by the
minimum and the maximum value (Correa, & Larrinaga 2015). There is distinct revenue and cost
Secure Best Marks with AI Grader
Need help grading? Try our AI Grader for instant feedback on your assignments.
10
MANAGEMENT ACCOUNTING
extent that is likely to take place within the specified boundaries is shown by the relevant range.
The revenues and the costs are looked upon to differ from the anticipated value that is outside the
relevant range. Relevant range is looked upon as the essential qualifier when assigning the
budgeted fixed expenses.
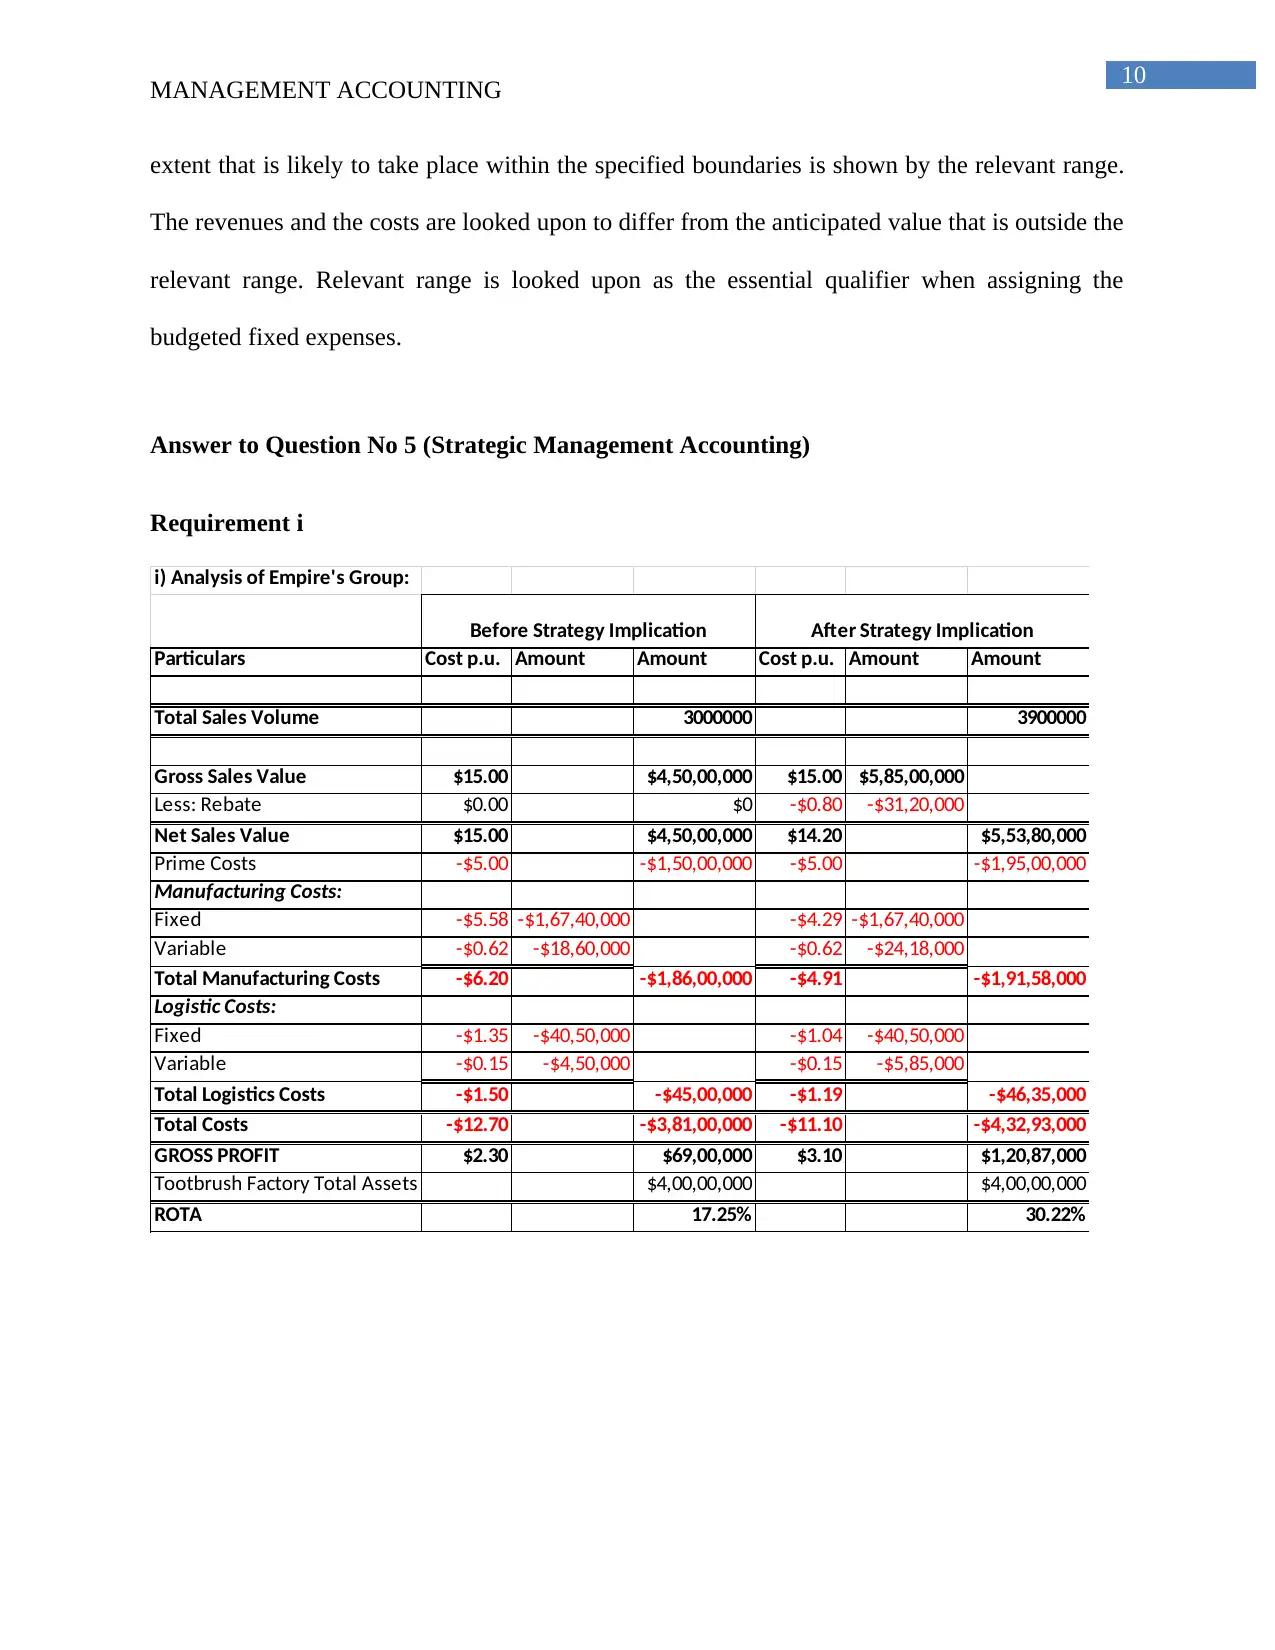
Answer to Question No 5 (Strategic Management Accounting)
Requirement i
i) Analysis of Empire's Group:
Particulars Cost p.u. Amount Amount Cost p.u. Amount Amount
Total Sales Volume 3000000 3900000
Gross Sales Value $15.00 $4,50,00,000 $15.00 $5,85,00,000
Less: Rebate $0.00 $0 -$0.80 -$31,20,000
Net Sales Value $15.00 $4,50,00,000 $14.20 $5,53,80,000
Prime Costs -$5.00 -$1,50,00,000 -$5.00 -$1,95,00,000
Manufacturing Costs:
Fixed -$5.58 -$1,67,40,000 -$4.29 -$1,67,40,000
Variable -$0.62 -$18,60,000 -$0.62 -$24,18,000
Total Manufacturing Costs -$6.20 -$1,86,00,000 -$4.91 -$1,91,58,000
Logistic Costs:
Fixed -$1.35 -$40,50,000 -$1.04 -$40,50,000
Variable -$0.15 -$4,50,000 -$0.15 -$5,85,000
Total Logistics Costs -$1.50 -$45,00,000 -$1.19 -$46,35,000
Total Costs -$12.70 -$3,81,00,000 -$11.10 -$4,32,93,000
GROSS PROFIT $2.30 $69,00,000 $3.10 $1,20,87,000
Tootbrush Factory Total Assets $4,00,00,000 $4,00,00,000
ROTA 17.25% 30.22%
Before Strategy Implication After Strategy Implication
MANAGEMENT ACCOUNTING
extent that is likely to take place within the specified boundaries is shown by the relevant range.
The revenues and the costs are looked upon to differ from the anticipated value that is outside the
relevant range. Relevant range is looked upon as the essential qualifier when assigning the
budgeted fixed expenses.
Answer to Question No 5 (Strategic Management Accounting)
Requirement i
i) Analysis of Empire's Group:
Particulars Cost p.u. Amount Amount Cost p.u. Amount Amount
Total Sales Volume 3000000 3900000
Gross Sales Value $15.00 $4,50,00,000 $15.00 $5,85,00,000
Less: Rebate $0.00 $0 -$0.80 -$31,20,000
Net Sales Value $15.00 $4,50,00,000 $14.20 $5,53,80,000
Prime Costs -$5.00 -$1,50,00,000 -$5.00 -$1,95,00,000
Manufacturing Costs:
Fixed -$5.58 -$1,67,40,000 -$4.29 -$1,67,40,000
Variable -$0.62 -$18,60,000 -$0.62 -$24,18,000
Total Manufacturing Costs -$6.20 -$1,86,00,000 -$4.91 -$1,91,58,000
Logistic Costs:
Fixed -$1.35 -$40,50,000 -$1.04 -$40,50,000
Variable -$0.15 -$4,50,000 -$0.15 -$5,85,000
Total Logistics Costs -$1.50 -$45,00,000 -$1.19 -$46,35,000
Total Costs -$12.70 -$3,81,00,000 -$11.10 -$4,32,93,000
GROSS PROFIT $2.30 $69,00,000 $3.10 $1,20,87,000
Tootbrush Factory Total Assets $4,00,00,000 $4,00,00,000
ROTA 17.25% 30.22%
Before Strategy Implication After Strategy Implication
11
MANAGEMENT ACCOUNTING
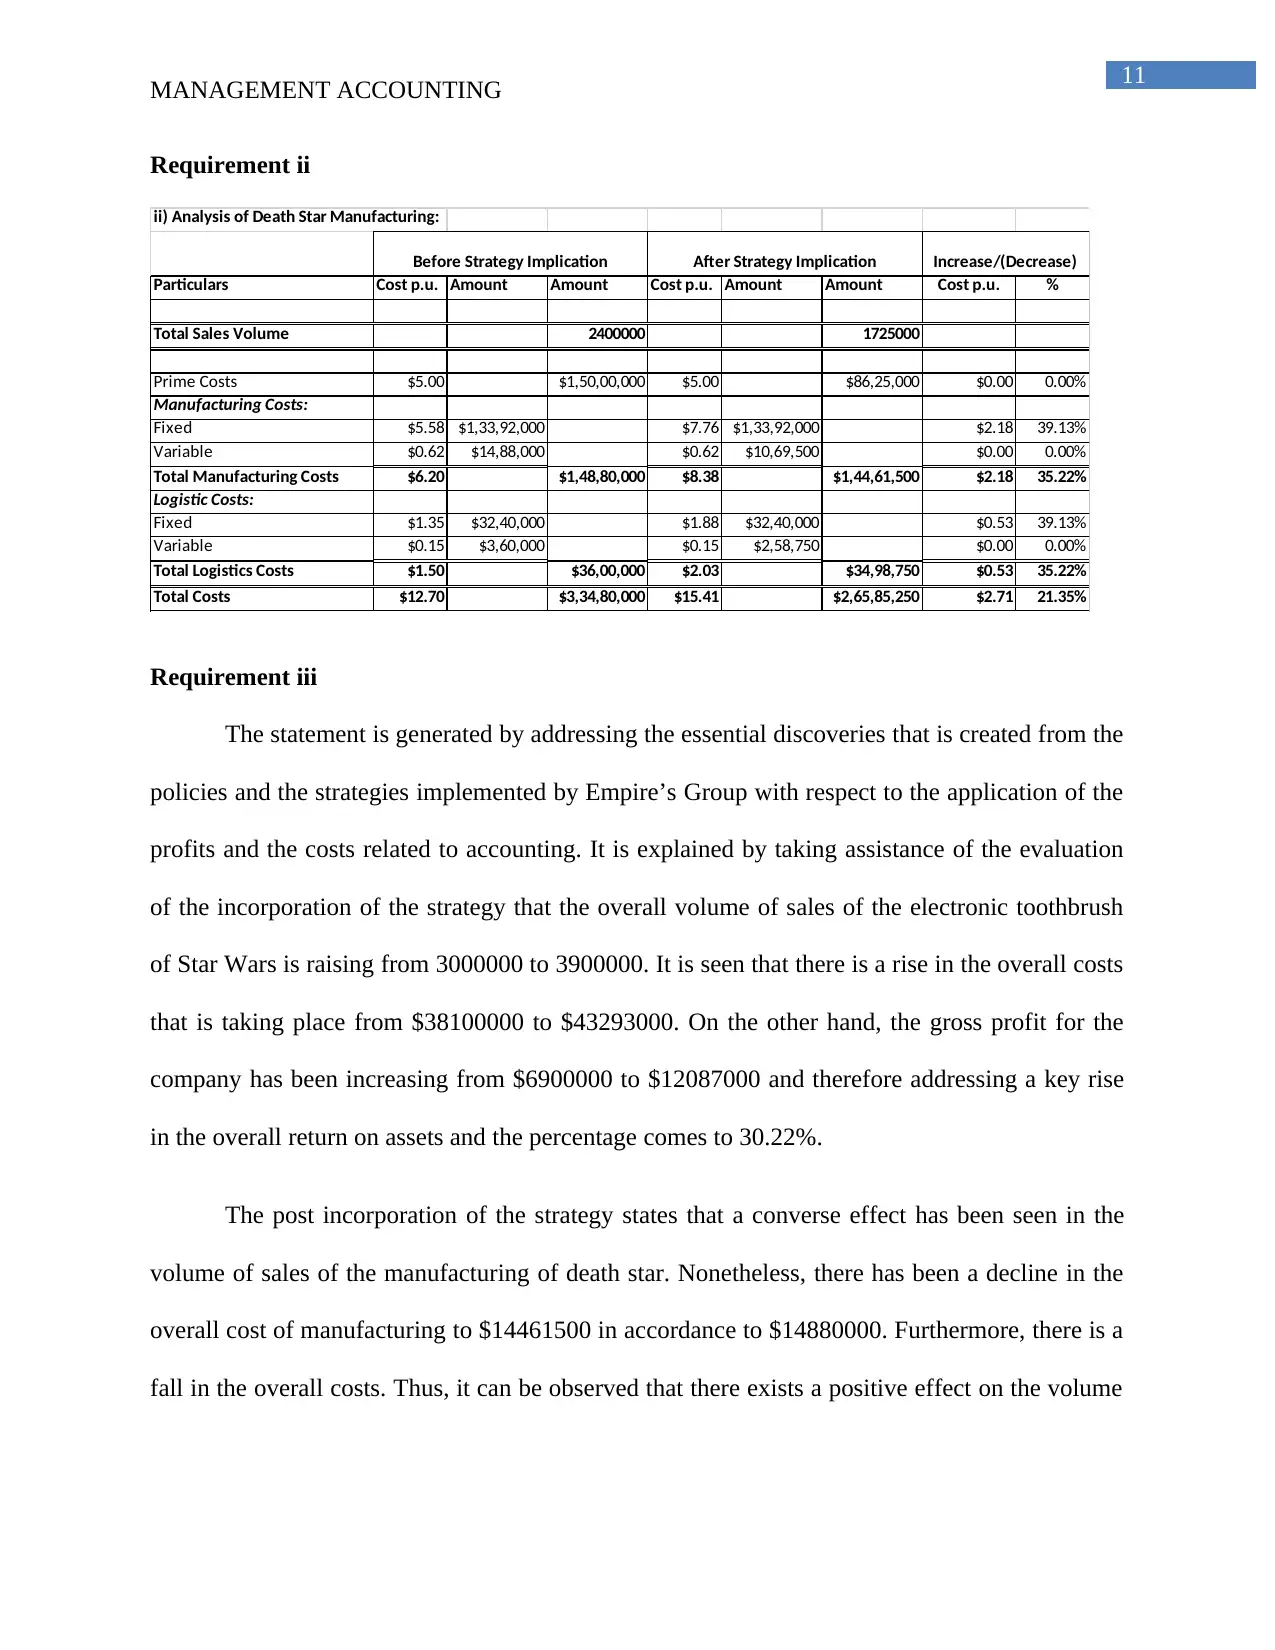
Requirement ii
ii) Analysis of Death Star Manufacturing:
Particulars Cost p.u. Amount Amount Cost p.u. Amount Amount Cost p.u. %
Total Sales Volume 2400000 1725000
Prime Costs $5.00 $1,50,00,000 $5.00 $86,25,000 $0.00 0.00%
Manufacturing Costs:
Fixed $5.58 $1,33,92,000 $7.76 $1,33,92,000 $2.18 39.13%
Variable $0.62 $14,88,000 $0.62 $10,69,500 $0.00 0.00%
Total Manufacturing Costs $6.20 $1,48,80,000 $8.38 $1,44,61,500 $2.18 35.22%
Logistic Costs:
Fixed $1.35 $32,40,000 $1.88 $32,40,000 $0.53 39.13%
Variable $0.15 $3,60,000 $0.15 $2,58,750 $0.00 0.00%
Total Logistics Costs $1.50 $36,00,000 $2.03 $34,98,750 $0.53 35.22%
Total Costs $12.70 $3,34,80,000 $15.41 $2,65,85,250 $2.71 21.35%
Before Strategy Implication After Strategy Implication Increase/(Decrease)
Requirement iii
The statement is generated by addressing the essential discoveries that is created from the
policies and the strategies implemented by Empire’s Group with respect to the application of the
profits and the costs related to accounting. It is explained by taking assistance of the evaluation
of the incorporation of the strategy that the overall volume of sales of the electronic toothbrush
of Star Wars is raising from 3000000 to 3900000. It is seen that there is a rise in the overall costs
that is taking place from $38100000 to $43293000. On the other hand, the gross profit for the
company has been increasing from $6900000 to $12087000 and therefore addressing a key rise
in the overall return on assets and the percentage comes to 30.22%.
The post incorporation of the strategy states that a converse effect has been seen in the
volume of sales of the manufacturing of death star. Nonetheless, there has been a decline in the
overall cost of manufacturing to $14461500 in accordance to $14880000. Furthermore, there is a
fall in the overall costs. Thus, it can be observed that there exists a positive effect on the volume
MANAGEMENT ACCOUNTING
Requirement ii
ii) Analysis of Death Star Manufacturing:
Particulars Cost p.u. Amount Amount Cost p.u. Amount Amount Cost p.u. %
Total Sales Volume 2400000 1725000
Prime Costs $5.00 $1,50,00,000 $5.00 $86,25,000 $0.00 0.00%
Manufacturing Costs:
Fixed $5.58 $1,33,92,000 $7.76 $1,33,92,000 $2.18 39.13%
Variable $0.62 $14,88,000 $0.62 $10,69,500 $0.00 0.00%
Total Manufacturing Costs $6.20 $1,48,80,000 $8.38 $1,44,61,500 $2.18 35.22%
Logistic Costs:
Fixed $1.35 $32,40,000 $1.88 $32,40,000 $0.53 39.13%
Variable $0.15 $3,60,000 $0.15 $2,58,750 $0.00 0.00%
Total Logistics Costs $1.50 $36,00,000 $2.03 $34,98,750 $0.53 35.22%
Total Costs $12.70 $3,34,80,000 $15.41 $2,65,85,250 $2.71 21.35%
Before Strategy Implication After Strategy Implication Increase/(Decrease)
Requirement iii
The statement is generated by addressing the essential discoveries that is created from the
policies and the strategies implemented by Empire’s Group with respect to the application of the
profits and the costs related to accounting. It is explained by taking assistance of the evaluation
of the incorporation of the strategy that the overall volume of sales of the electronic toothbrush
of Star Wars is raising from 3000000 to 3900000. It is seen that there is a rise in the overall costs
that is taking place from $38100000 to $43293000. On the other hand, the gross profit for the
company has been increasing from $6900000 to $12087000 and therefore addressing a key rise
in the overall return on assets and the percentage comes to 30.22%.
The post incorporation of the strategy states that a converse effect has been seen in the
volume of sales of the manufacturing of death star. Nonetheless, there has been a decline in the
overall cost of manufacturing to $14461500 in accordance to $14880000. Furthermore, there is a
fall in the overall costs. Thus, it can be observed that there exists a positive effect on the volume
12
MANAGEMENT ACCOUNTING
of sales and the return on the total assets of electronic toothbrush of star war. Thus, it is advisable
to the strategic committee to move forward with the alterations that have been planned.
Answer to Question 5 (Ethics Case Study)
It can be suggested to Burdon to undertake the objectivity that is anticipated from the
management accountant in accordance to the responsibilities for conveying the data in a precise
manner even though these data is not favourable for the one who is asking for it (Al-Shaer et al.,
2017). Hence, Burdon requires to be recommended to address the treatment of accounting to the
management at the top level.
Burdon is advised to undertake the following steps:
It is essential that Burdon ascertains the fact of the scenario and discovering the ethical
problems related with the condition
Values associated to the condition needs to be recognised
Alternate action course needs to be identified \
Probable outcomes of every action course needs to be recognised
Paraphrase This Document
Need a fresh take? Get an instant paraphrase of this document with our AI Paraphraser
13
MANAGEMENT ACCOUNTING
Reference List
Al-Shaer, H., Salama, A., & Toms, S. (2017). Audit committees and financial reporting quality:
Evidence from uk environmental accounting disclosures. Journal of Applied Accounting
Research, 18(1), 2-21.
Burritt, R., & Christ, K. (2016). Industry 4.0 and environmental accounting: a new
revolution?. Asian Journal of Sustainability and Social Responsibility, 1(1), 23-38.
Correa, C., & Larrinaga, C. (2015). Engagement research in social and environmental
accounting. Sustainability Accounting, Management and Policy Journal, 6(1), 5-28.
Deegan, C. (2017). Twenty five years of social and environmental accounting research within
Critical Perspectives of Accounting: Hits, misses and ways forward. Critical Perspectives
on Accounting, 43, 65-87.
Gray, R., Bebbington, J., & Gray, S. (2017). Social and environmental accounting. Vol. I (Los
Angeles, London, New Delhi, Singapore, Washington, 41-56: Sage, 210).
Gray, R., O’Dochartaigh, A., & Rannou, C. (2016). Organisational Effectiveness and Social and
Environmental Accounting: Through the Past Darkly. In Pioneers of Critical
Accounting (pp. 53-71). Palgrave Macmillan, London.
Gunarathne, N., & Lee, K. H. (2015). Environmental Management Accounting (EMA) for
environmental management and organizational change: An eco-control approach. Journal
of Accounting & Organizational Change, 11(3), 362-383.
Latan, H., Jabbour, C. J. C., de Sousa Jabbour, A. B. L., Wamba, S. F., & Shahbaz, M. (2018).
Effects of environmental strategy, environmental uncertainty and top management's
14
MANAGEMENT ACCOUNTING
commitment on corporate environmental performance: The role of environmental
management accounting. Journal of Cleaner Production, 180, 297-306.
Roberts, R. W., & Wallace, D. M. (2015). Sustaining diversity in social and environmental
accounting research. Critical Perspectives on Accounting, 32, 78-87.
Russell, S., Milne, M. J., & Dey, C. (2017). Accounts of Nature and the Nature of Accounts:
Critical reflections on environmental accounting and propositions for ecologically
informed accounting. Accounting, Auditing & Accountability Journal, 30(7), 1426-1458.
1 out of 15
Related Documents


Your All-in-One AI-Powered Toolkit for Academic Success.
+13062052269
info@desklib.com
Available 24*7 on WhatsApp / Email
![[object Object]](/_next/static/media/star-bottom.7253800d.svg)
Unlock your academic potential
© 2024 | Zucol Services PVT LTD | All rights reserved.