Comprehensive Data Analysis Report: UK Construction Sector Trends
VerifiedAdded on 2020/06/04
|16
|2702
|115
Report
AI Summary
This report presents a data analysis of the UK construction sector, examining various factors such as neighborhood, offers, square footage, number of bedrooms and bathrooms, price, and brick usage. The study employs descriptive statistics, including mean, standard deviation, and mode, to analyze the dataset of 129 samples. Statistical tests like t-tests and regression analysis are conducted using Gretl and Excel to identify trends and relationships between variables. Findings reveal insights into property prices, square footage, and the impact of variables like bedrooms, bathrooms, and square footage on property values. The report concludes with key observations and suggests further research areas, offering valuable insights for firms in the construction sector to make informed business decisions. The analysis indicates that while there is a moderate association between prices and independent variables, the overall impact of bedroom, bathroom, and size on the prices charged is not significant, highlighting the need for a deeper understanding of the market dynamics.

MANAGEMENT DATA ANALYSIS
Paraphrase This Document
Need a fresh take? Get an instant paraphrase of this document with our AI Paraphraser
TABLE OF CONTENTS
INTRODUCTION...........................................................................................................................1
Sample.............................................................................................................................................1
Findings...........................................................................................................................................2
Descriptive statistics....................................................................................................................2
CONCLUSION................................................................................................................................8
Further research...............................................................................................................................9
Recommendation.............................................................................................................................9
REFERENCES..............................................................................................................................10
APPENDIX....................................................................................................................................11
INTRODUCTION
Construction sector is one of the growing field in the UK however, due to impact of
recession slowdown is observed in this sector. Sign of recovery are observed in the sector and it
is identified that in mentioned sector construction of building for people residential purpose
increased at fast pace. However, commercial purpose building construction does not get that
momentum which is seen in respect to residential buildings construction growth rate. It can be
said that revival comes in the UK construction sector but it does not happened at fast rate and
there are lot more things that need to be seen in the mentioned industry. In the present research
study data related to offers, square feet of premises, number of bedrooms and number of
bathrooms are analyzed (Gurran and Bramley, 2017). Price of premises and whether bricks are
used in construction of building or not are also explained in detail. Data analytics is the one of
the important key tool that can be used by the firms for data analysis purpose and it help them to
identify number of factors that need to be consider while making busines decisions. In present
research study varied statistical tests are applied on data and their results are interpreted in proper
manner. In this regard, Gretl and excel software is used for data analysis purpose. By using
mentioned softwares t test aere applied and it is identified whether variable sample mean is
different from standard. This is done for multiple variables in the dataset. It can be said that
systmatic approach is followed to carry out research work and to analyze data in proper manner
in order to develop broad understanding of the variable. At end of the report conclusion is
formed and in this way entire research work is carried out (Shuyun and Yin, 2015). It must be
noted that analysis of current data set will help firm in making strong business decisions. It can
be seen from table that different price levels are given in the dataset and due to this reason it is
very important to identify that what trends are going on in terms of square feet and bedrooms as
well as bathrooms. After doing thorough analysis finally conclusion section is prepared in the
report.
Sample
In present research study sample of 129 people is taken and different questions were
asked from them in relation to neighbiurhood, number of offers that are made in the house,
number of bedrooms and bathrooms there are in the house. Apart from this, price related
information and bricks whether used or not are given in dataset. While analyzing dataset it is
identified that there are no missing values in dataset and due to this reason its cleaning is not
1 | P a g e
⊘ This is a preview!⊘
Do you want full access?
Subscribe today to unlock all pages.
Trusted by 1+ million students worldwide
required. Hence, it can be said that data is already prepared. There is no need to do any sort of
modifications in dataset as it is already perfect and can be used for analysis purpose directly.
Findings
Descriptive statistics NBHD: Mean value of variable neighbourhood is 1.96 and its standard deviation is 0.80
which means that neighbourhood is in traditional area. Mode value is 2 and this also
reflect that similar results are revealed by mode. Hence, it can be said that most of
respondents homes are in tradtional area. Offers: In case of offers it can be observed that mean value is 2.57 and standard deviation
value is 1.06 which is reflecting that number of offers made on home purchase is 3 which
means that most of home owners receive offers for home sale three times in specific
duration. Square foot: Square foot mean value is 2000 and standard deviation is 211.57. On other
hand, mode value is 1920 and it is reflecting that on average basis people homes are of
square foot 2000 and apart from this there are many other homes where square foot size
is 1920. Bedroom: Mean value of bedroom is 3.092 and its standard deviation is 0.72 which
reflect that on average basis people have 3 bedrooms in their homes. Mode value is also 3
and this is also indicating that on average basis and most of times respondents give
similar reponse. Bathroom: It can be seen from table that mean value of variable is 2.44 and its standard
deviation is 0.51. On other hand, mode value is 2 which means that most of homes have
two bathrooms and this number is deviating at very low rate. Price: Mean value of price is 260854 and standard deviation value is 53737 which make
it clear that most of times price of house remain 260854 and this value is deviating at at
very low pace. It can be said that price of product is flucutating at low or moderate rate. Brick: Table that is given in appendix is clearly reflecting that mean value of brick is
1.32 and mode value is 1 which means that majority of homes are not made of bricks.
Instead stones are used to prepare homes.
2 | P a g e
Paraphrase This Document
Need a fresh take? Get an instant paraphrase of this document with our AI Paraphraser
0 2 4 6 8 10 12
0
2
4
6
8
10
12
Chart Title
Bedrooms Bathrooms
Figure 1Number of bedroom and bathroom
It can be observed that number of bedrooms and bathrooms matched to each other and there are
few cases where number of bedrooms are higher then number of bathrooms.
1 7 13 19 25 31 37 43 49 55 61 67 73 79 85 91 97 103 109 115 121 127
0
50000
100000
150000
200000
250000
300000
350000
400000
450000
Price
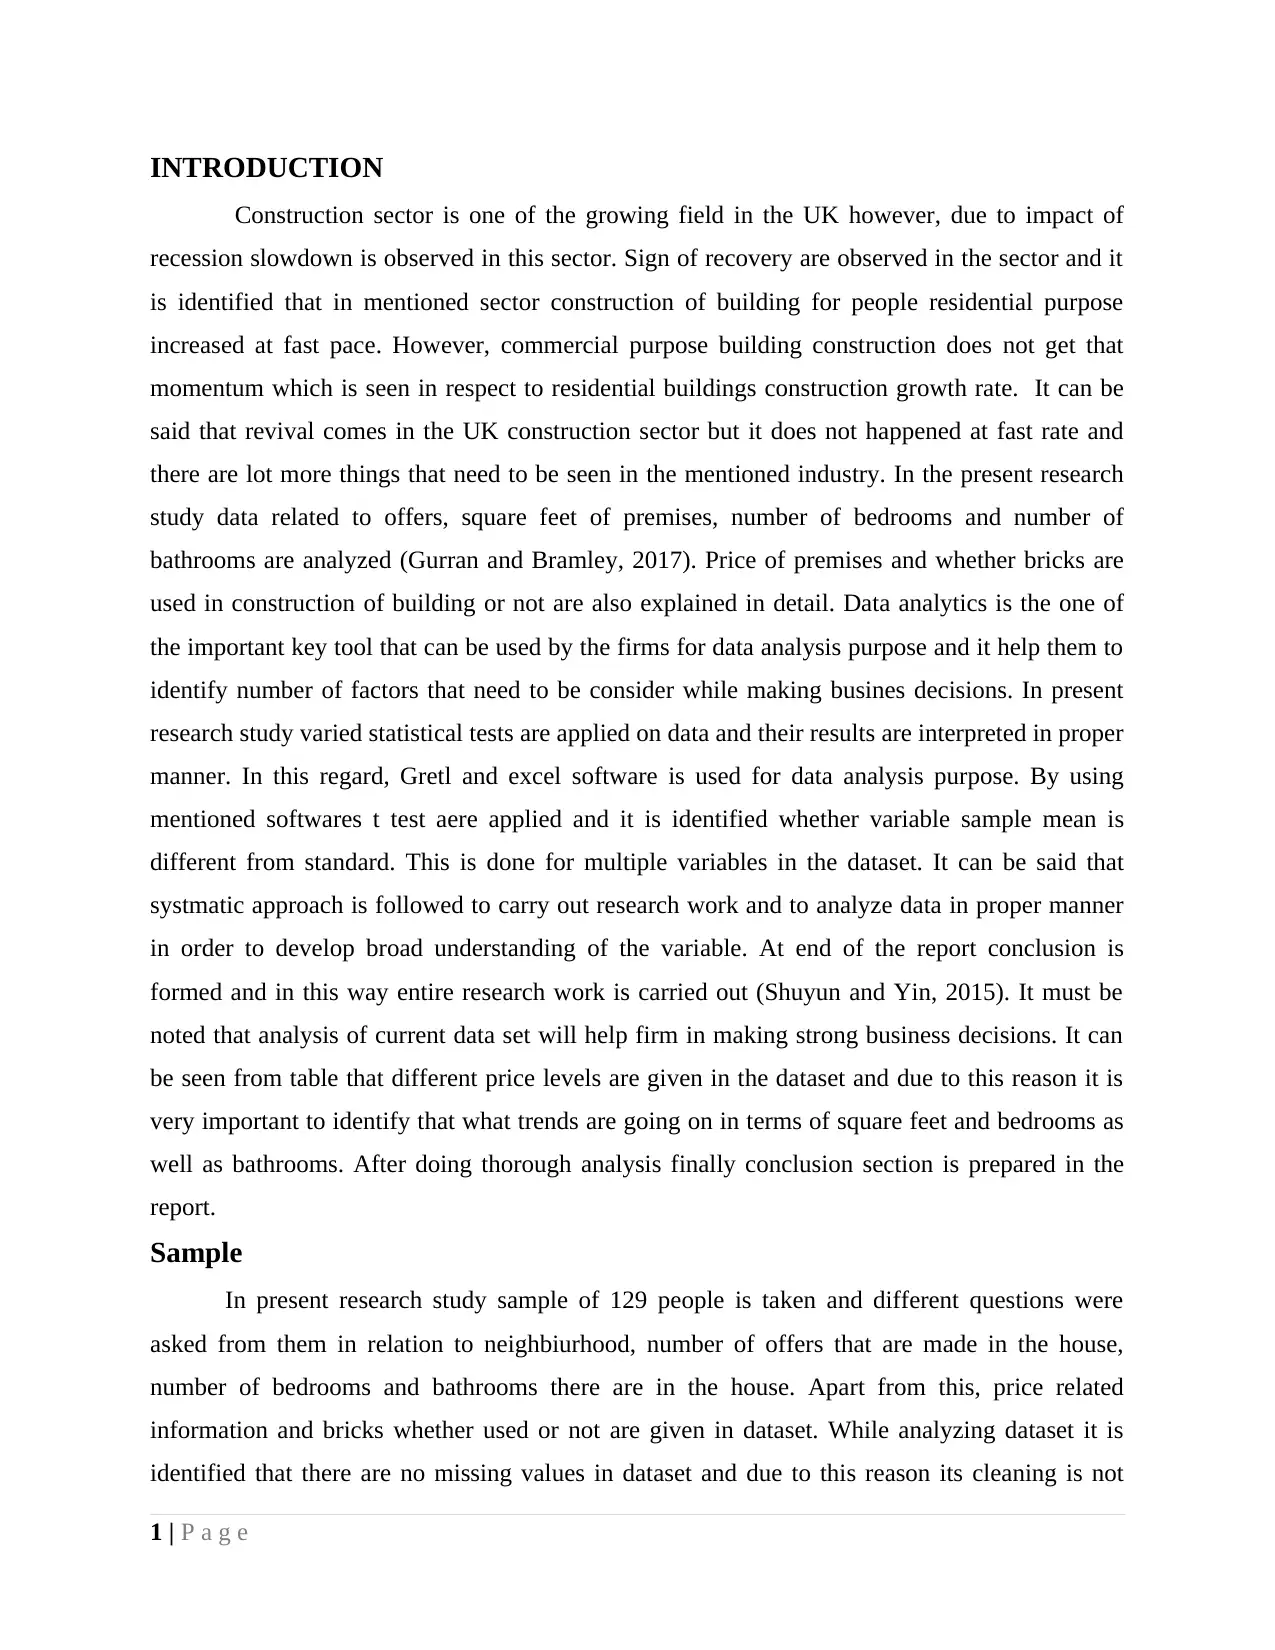
Figure 2Line chart of price
It can be observed that price of properties are fluctuating consistently and are not stable at
particular point. Hence, it can be said that other variables that are in data set does not play any
role in determinng price of property.
3 | P a g e
0
2
4
6
8
10
12
Chart Title
Bedrooms Bathrooms
Figure 1Number of bedroom and bathroom
It can be observed that number of bedrooms and bathrooms matched to each other and there are
few cases where number of bedrooms are higher then number of bathrooms.
1 7 13 19 25 31 37 43 49 55 61 67 73 79 85 91 97 103 109 115 121 127
0
50000
100000
150000
200000
250000
300000
350000
400000
450000
Price
Figure 2Line chart of price
It can be observed that price of properties are fluctuating consistently and are not stable at
particular point. Hence, it can be said that other variables that are in data set does not play any
role in determinng price of property.
3 | P a g e
2071.818182
2279.090909
1657.272727
More
0
15
30
0.00%
60.00%
120.00%
Histogram
Frequency
Cumulative %
Bin
Frequency
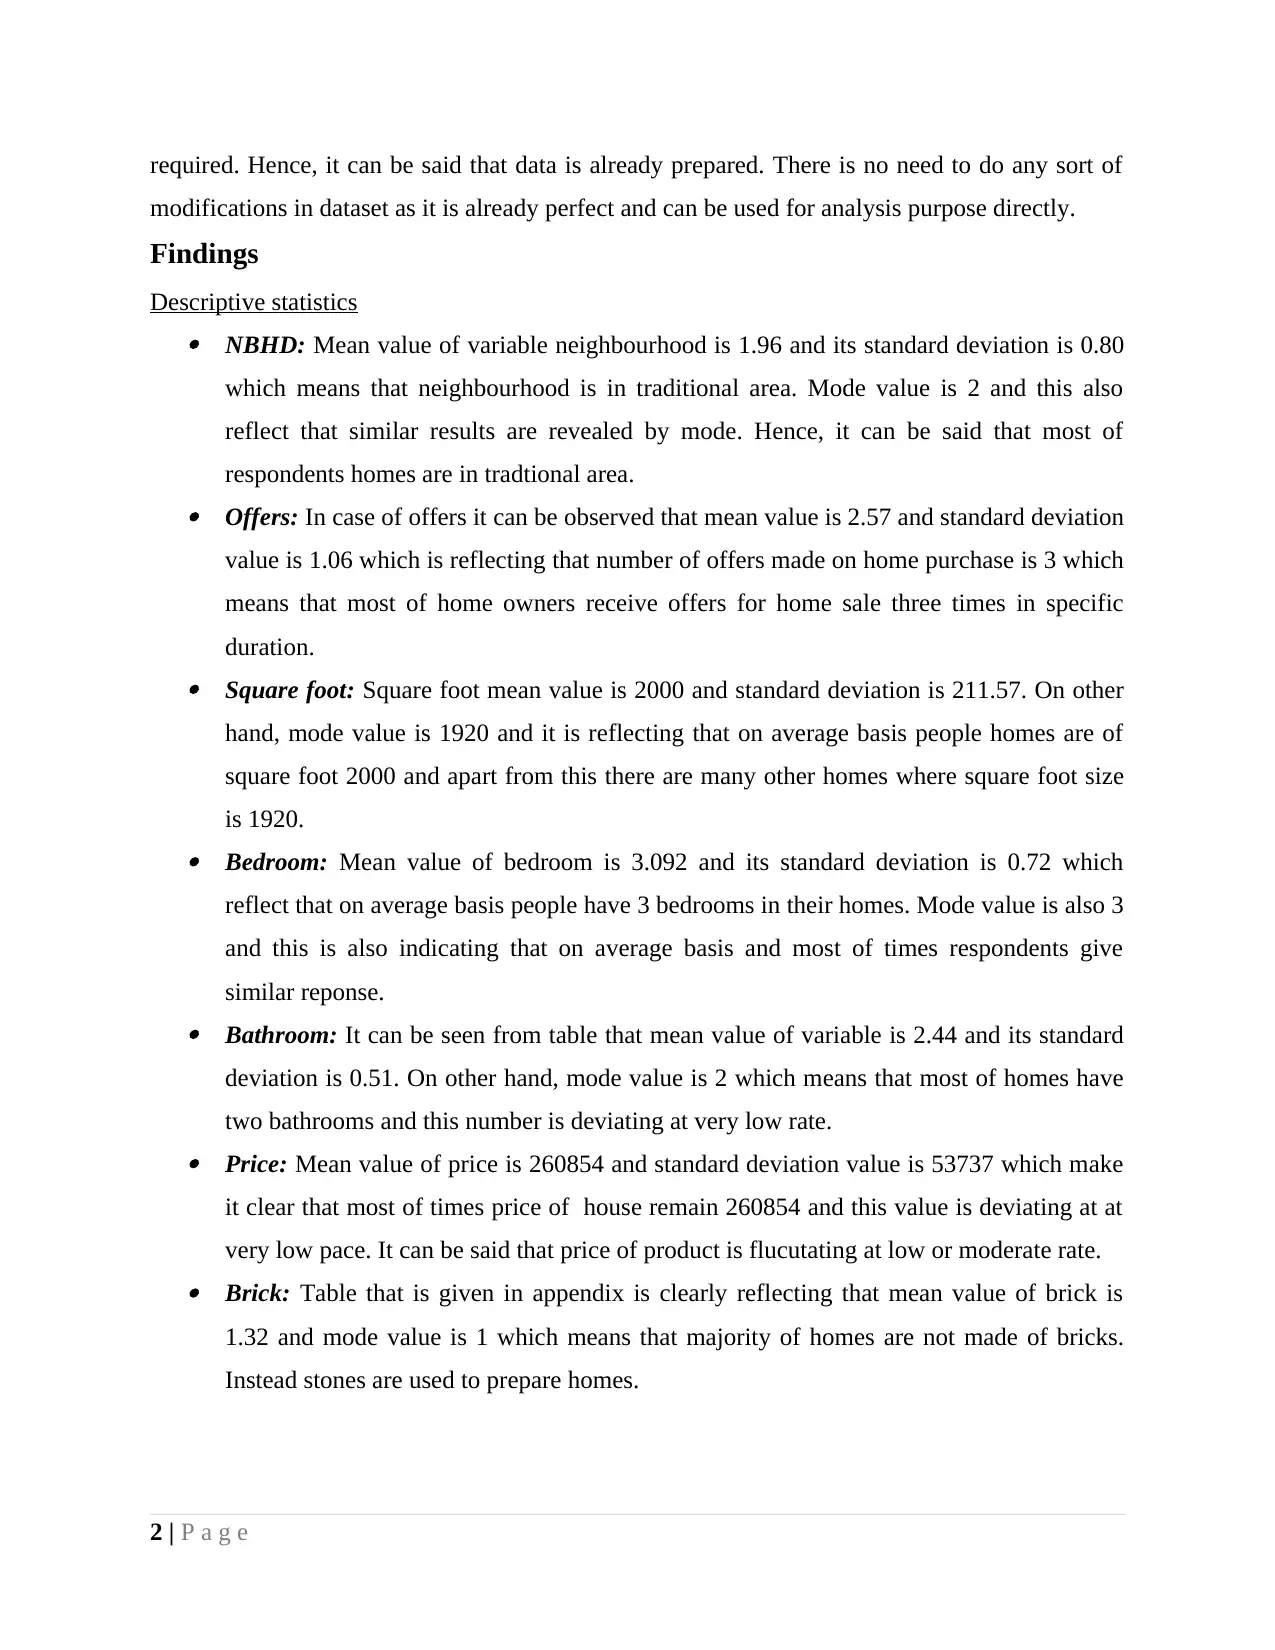
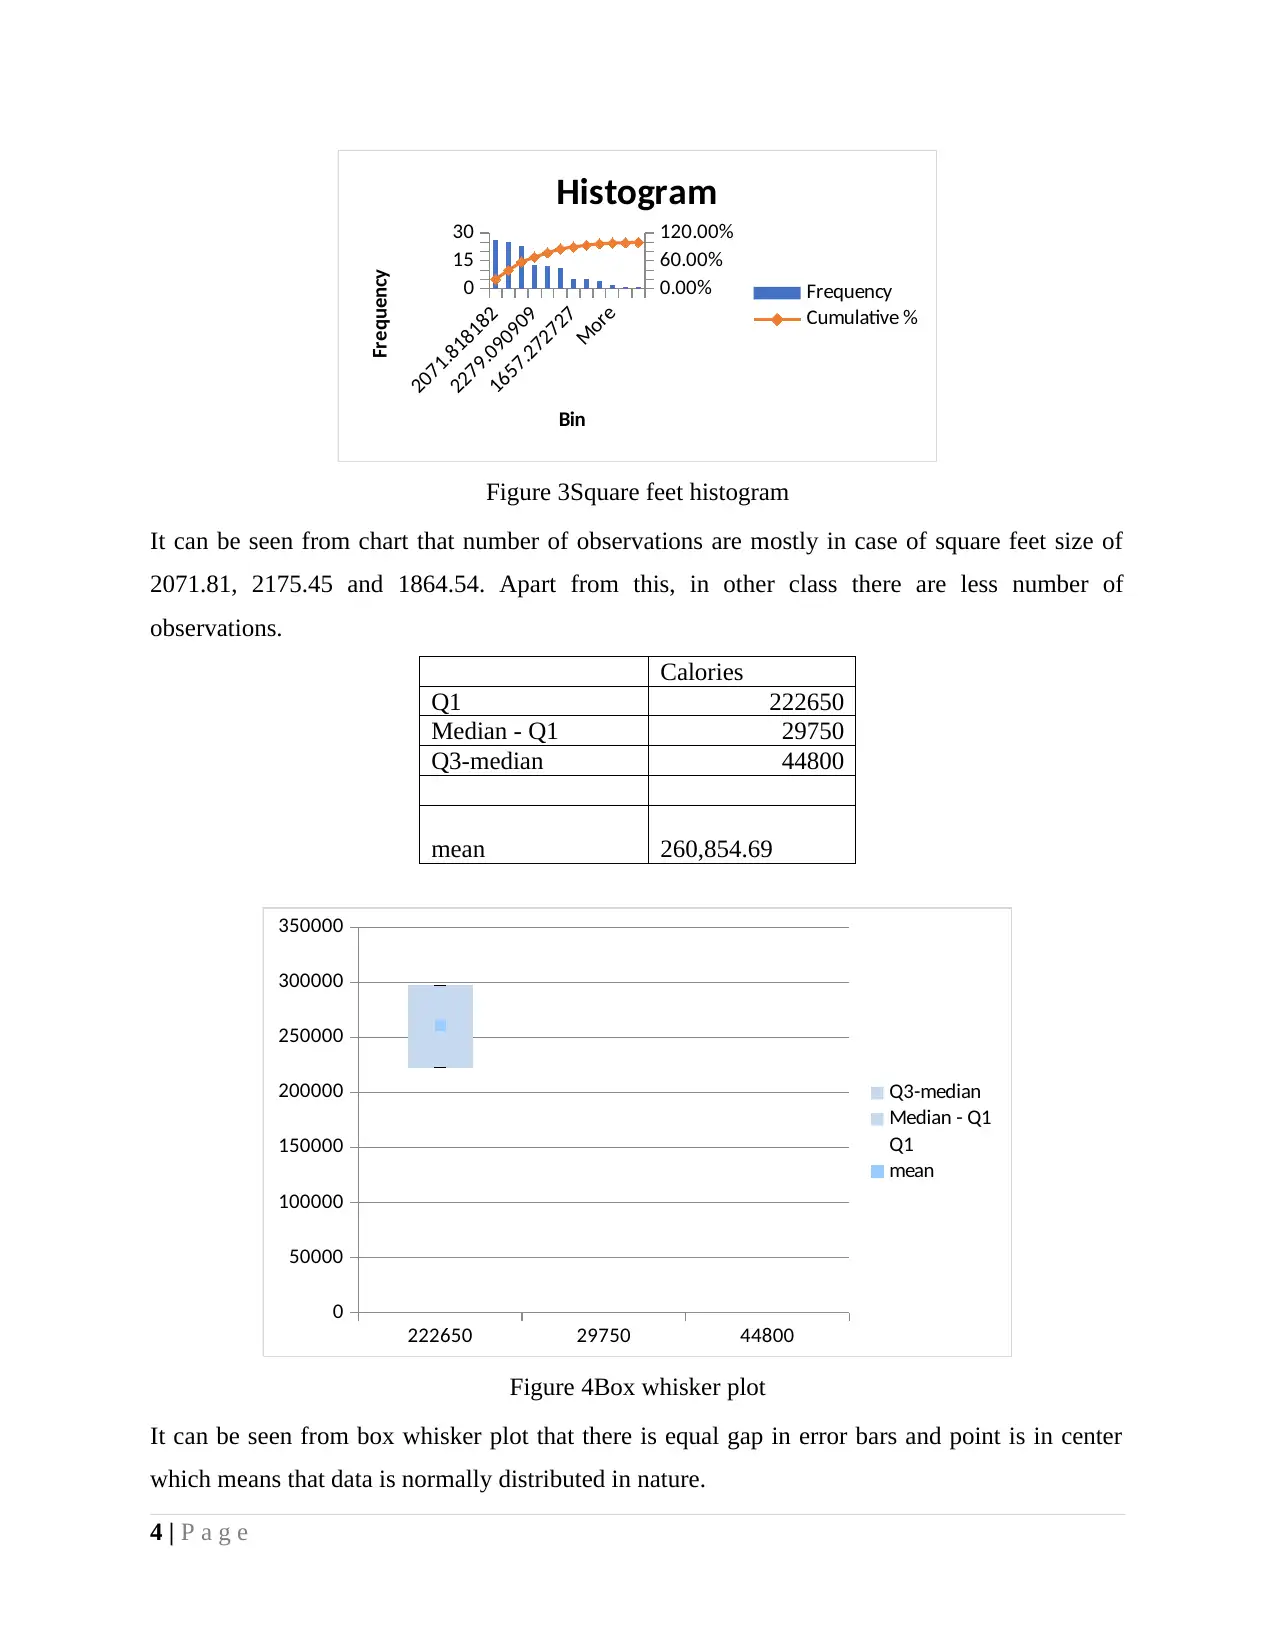
Figure 3Square feet histogram
It can be seen from chart that number of observations are mostly in case of square feet size of
2071.81, 2175.45 and 1864.54. Apart from this, in other class there are less number of
observations.
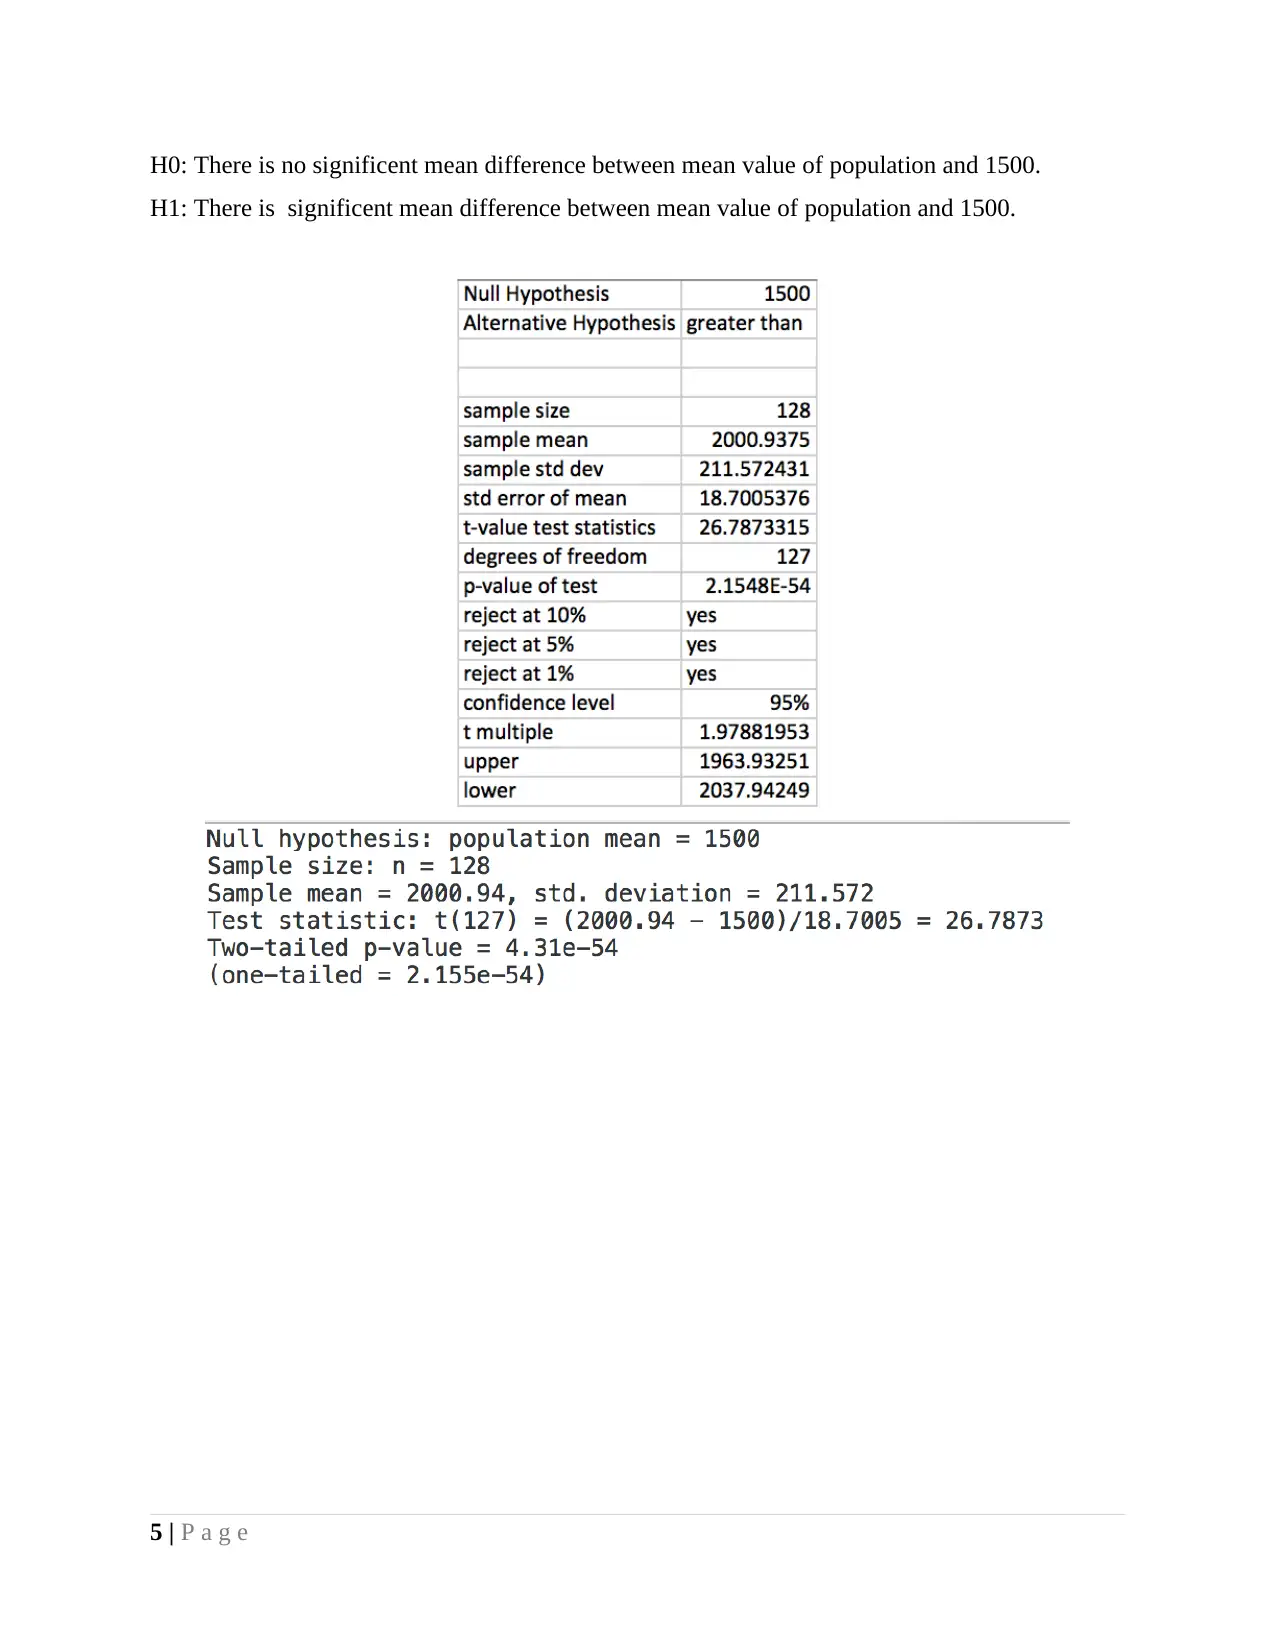
Calories
Q1 222650
Median - Q1 29750
Q3-median 44800
mean 260,854.69
222650 29750 44800
0
50000
100000
150000
200000
250000
300000
350000
Q3-median
Median - Q1
Q1
mean
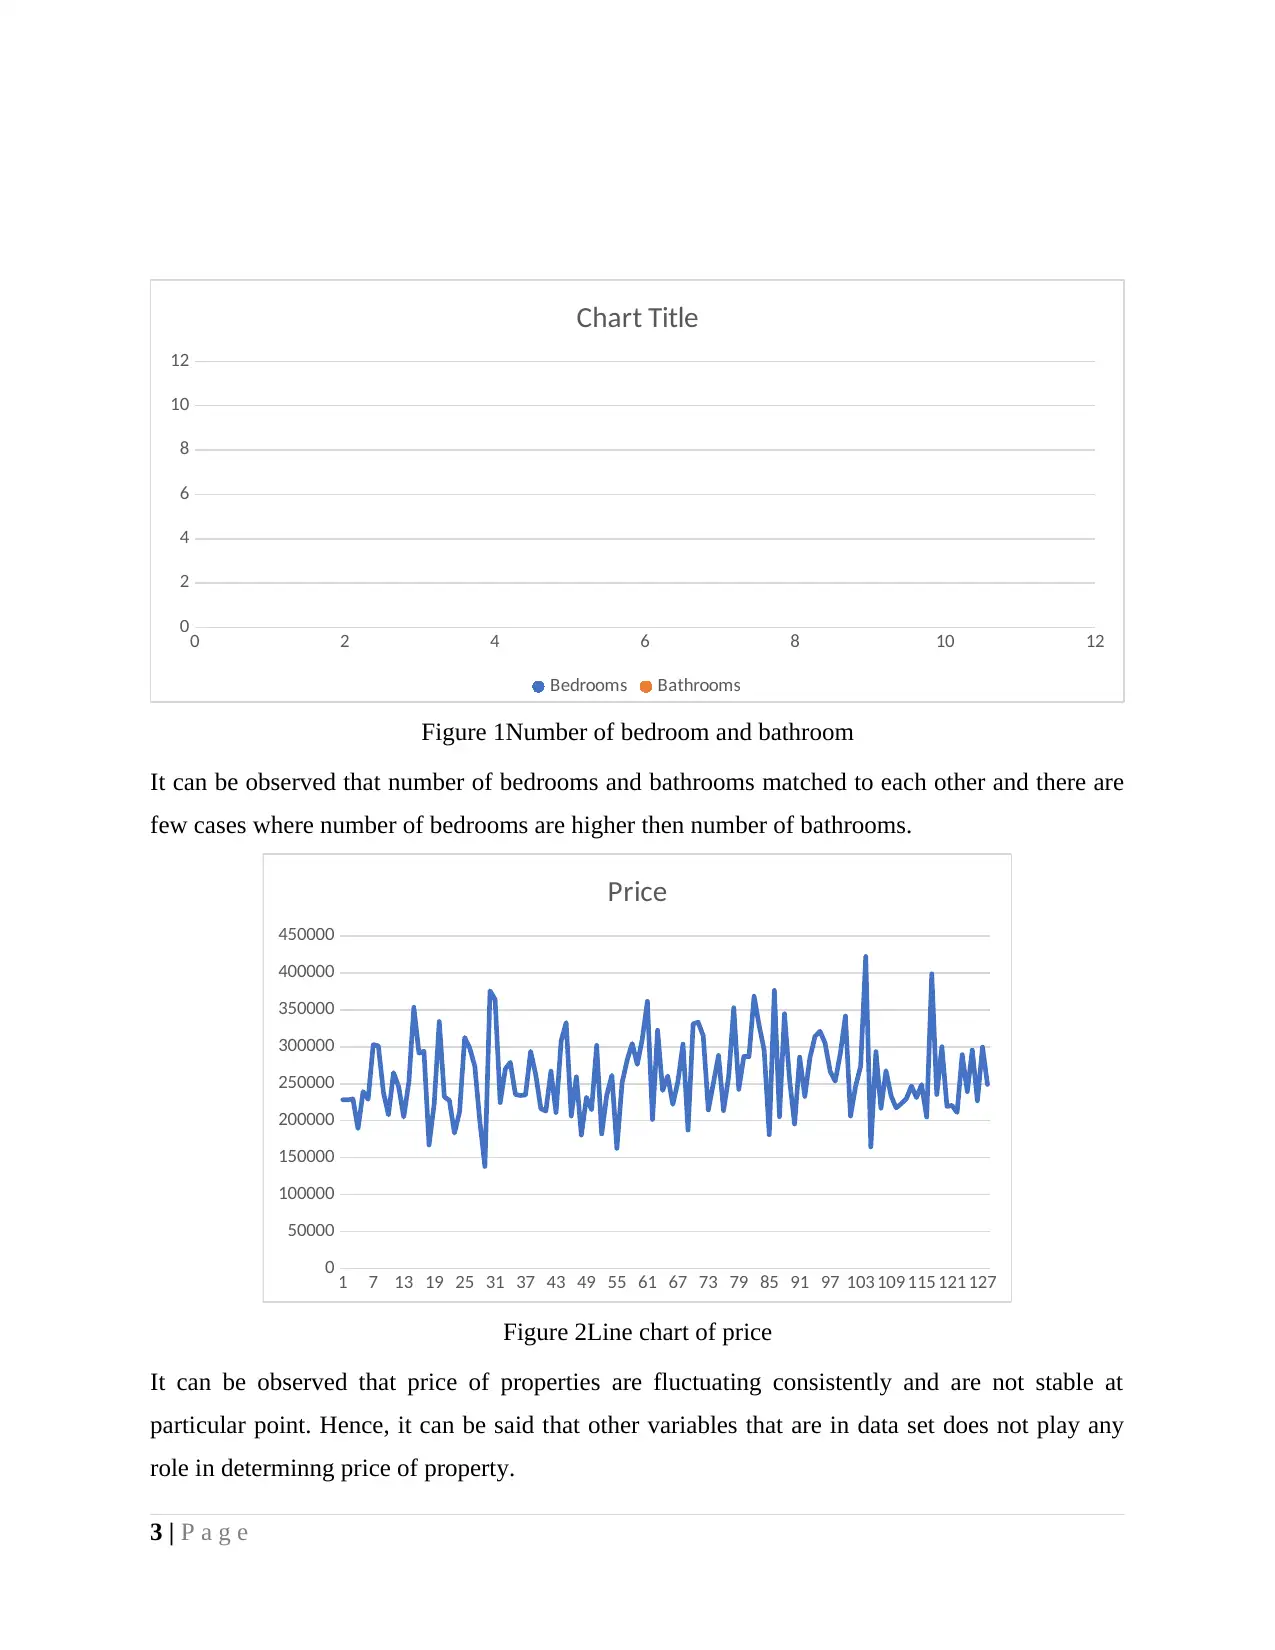
Figure 4Box whisker plot
It can be seen from box whisker plot that there is equal gap in error bars and point is in center
which means that data is normally distributed in nature.
4 | P a g e
2279.090909
1657.272727
More
0
15
30
0.00%
60.00%
120.00%
Histogram
Frequency
Cumulative %
Bin
Frequency
Figure 3Square feet histogram
It can be seen from chart that number of observations are mostly in case of square feet size of
2071.81, 2175.45 and 1864.54. Apart from this, in other class there are less number of
observations.
Calories
Q1 222650
Median - Q1 29750
Q3-median 44800
mean 260,854.69
222650 29750 44800
0
50000
100000
150000
200000
250000
300000
350000
Q3-median
Median - Q1
Q1
mean
Figure 4Box whisker plot
It can be seen from box whisker plot that there is equal gap in error bars and point is in center
which means that data is normally distributed in nature.
4 | P a g e
⊘ This is a preview!⊘
Do you want full access?
Subscribe today to unlock all pages.
Trusted by 1+ million students worldwide
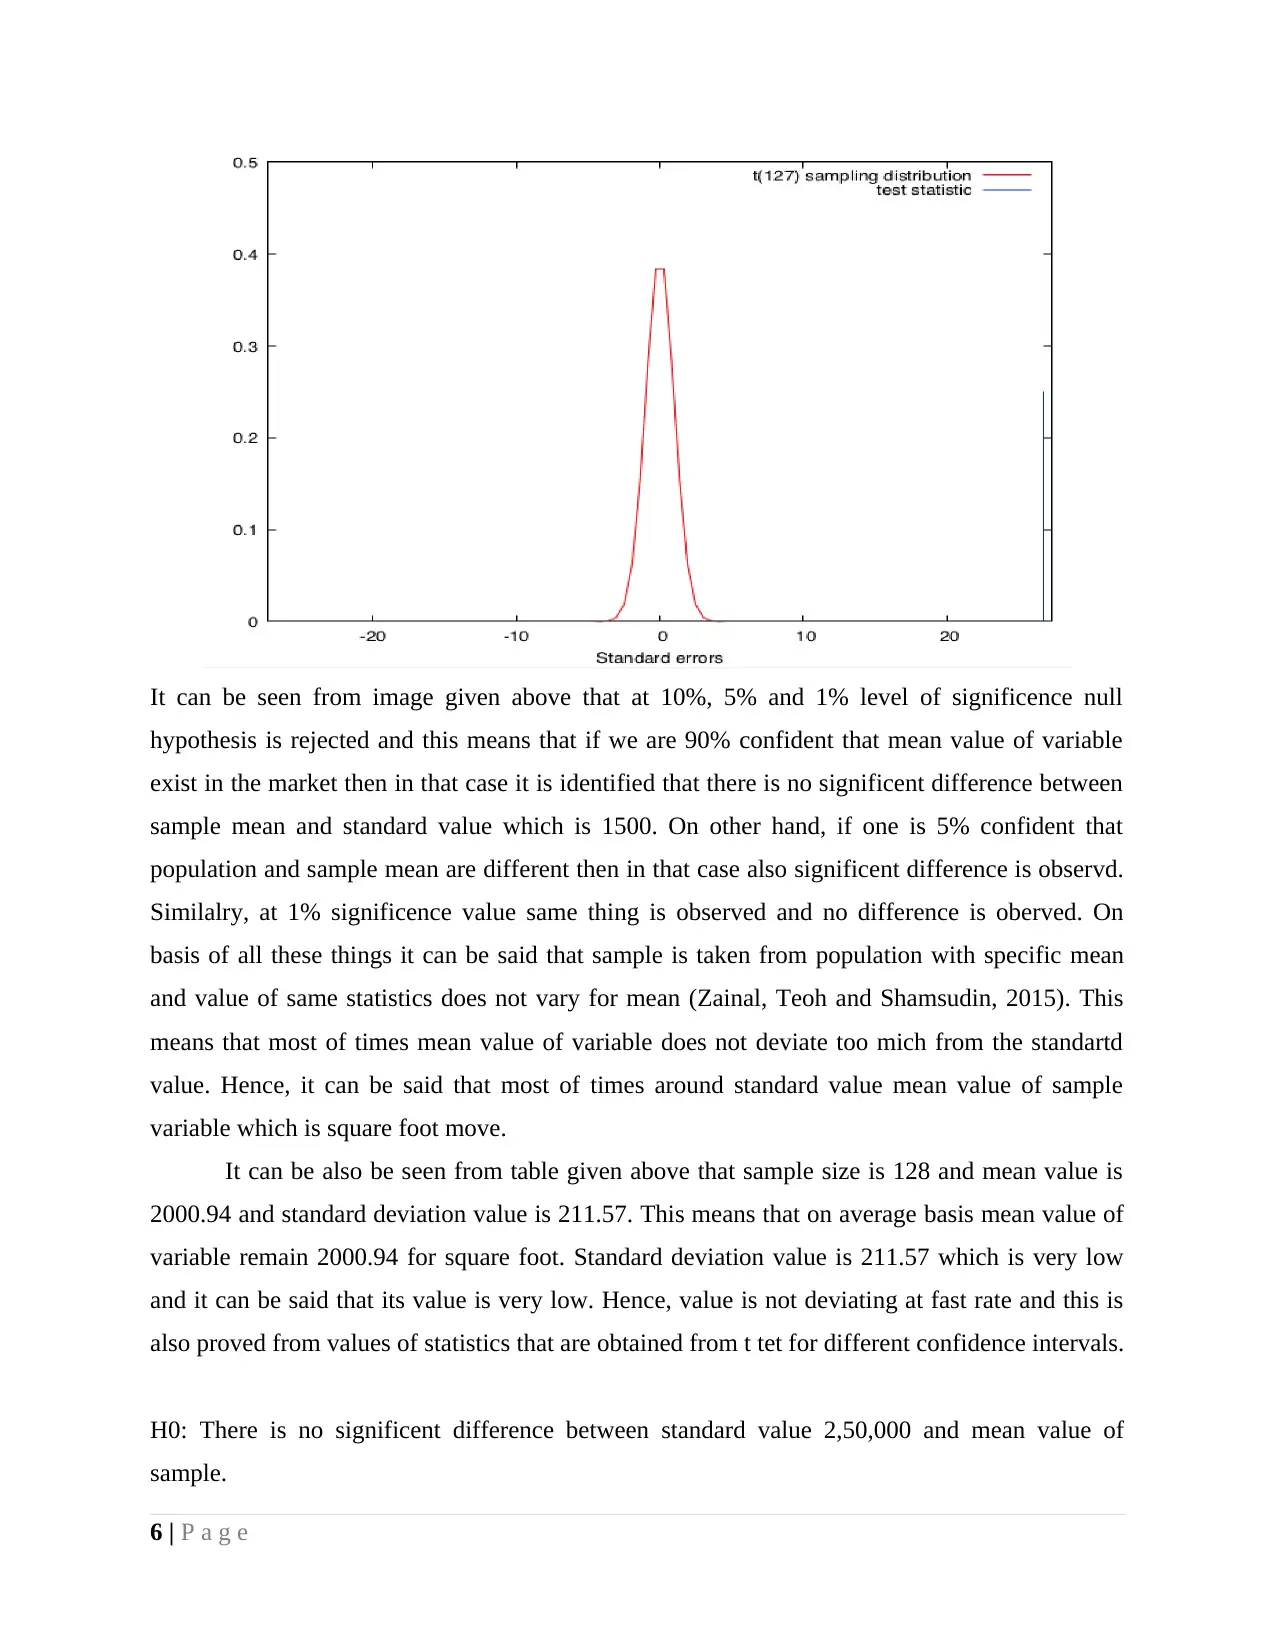
H0: There is no significent mean difference between mean value of population and 1500.
H1: There is significent mean difference between mean value of population and 1500.
5 | P a g e
H1: There is significent mean difference between mean value of population and 1500.
5 | P a g e
Paraphrase This Document
Need a fresh take? Get an instant paraphrase of this document with our AI Paraphraser
It can be seen from image given above that at 10%, 5% and 1% level of significence null
hypothesis is rejected and this means that if we are 90% confident that mean value of variable
exist in the market then in that case it is identified that there is no significent difference between
sample mean and standard value which is 1500. On other hand, if one is 5% confident that
population and sample mean are different then in that case also significent difference is observd.
Similalry, at 1% significence value same thing is observed and no difference is oberved. On
basis of all these things it can be said that sample is taken from population with specific mean
and value of same statistics does not vary for mean (Zainal, Teoh and Shamsudin, 2015). This
means that most of times mean value of variable does not deviate too mich from the standartd
value. Hence, it can be said that most of times around standard value mean value of sample
variable which is square foot move.
It can be also be seen from table given above that sample size is 128 and mean value is
2000.94 and standard deviation value is 211.57. This means that on average basis mean value of
variable remain 2000.94 for square foot. Standard deviation value is 211.57 which is very low
and it can be said that its value is very low. Hence, value is not deviating at fast rate and this is
also proved from values of statistics that are obtained from t tet for different confidence intervals.
H0: There is no significent difference between standard value 2,50,000 and mean value of
sample.
6 | P a g e
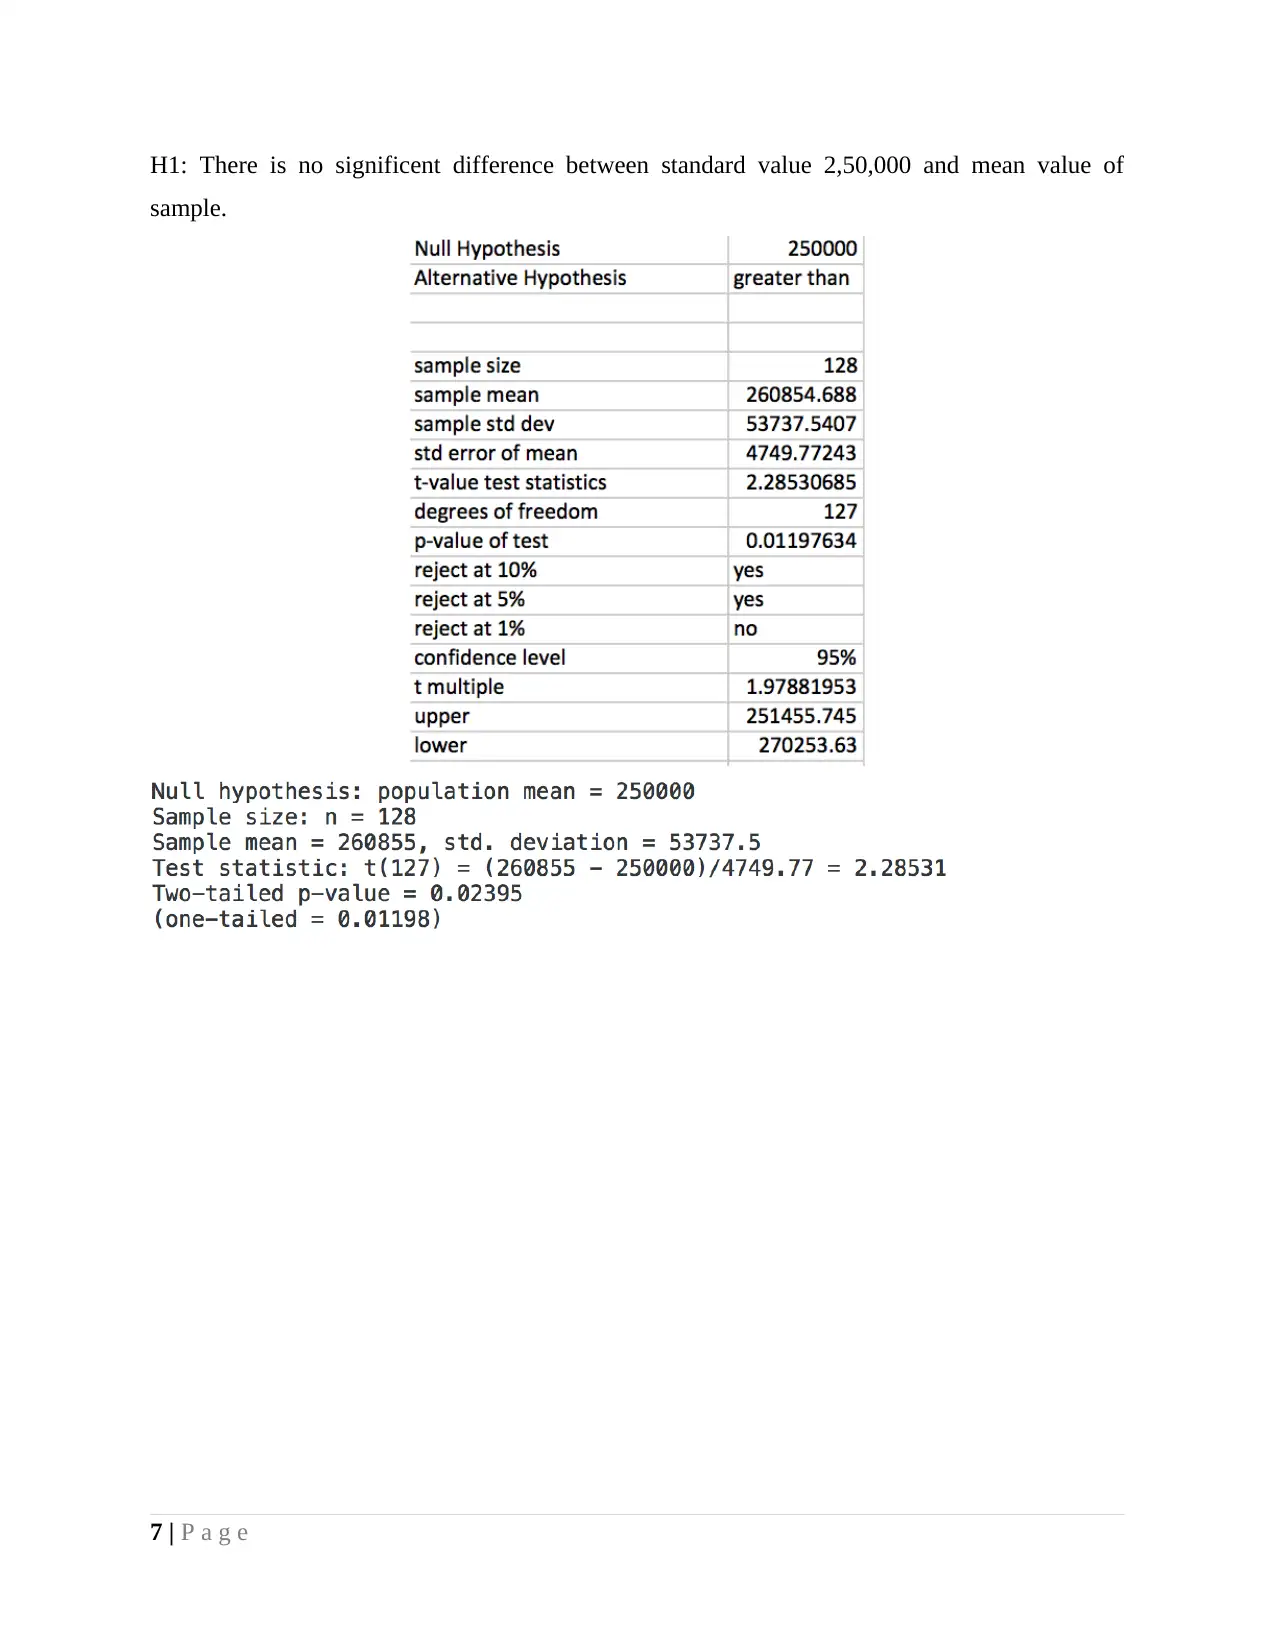
H1: There is no significent difference between standard value 2,50,000 and mean value of
sample.
7 | P a g e
sample.
7 | P a g e
⊘ This is a preview!⊘
Do you want full access?
Subscribe today to unlock all pages.
Trusted by 1+ million students worldwide
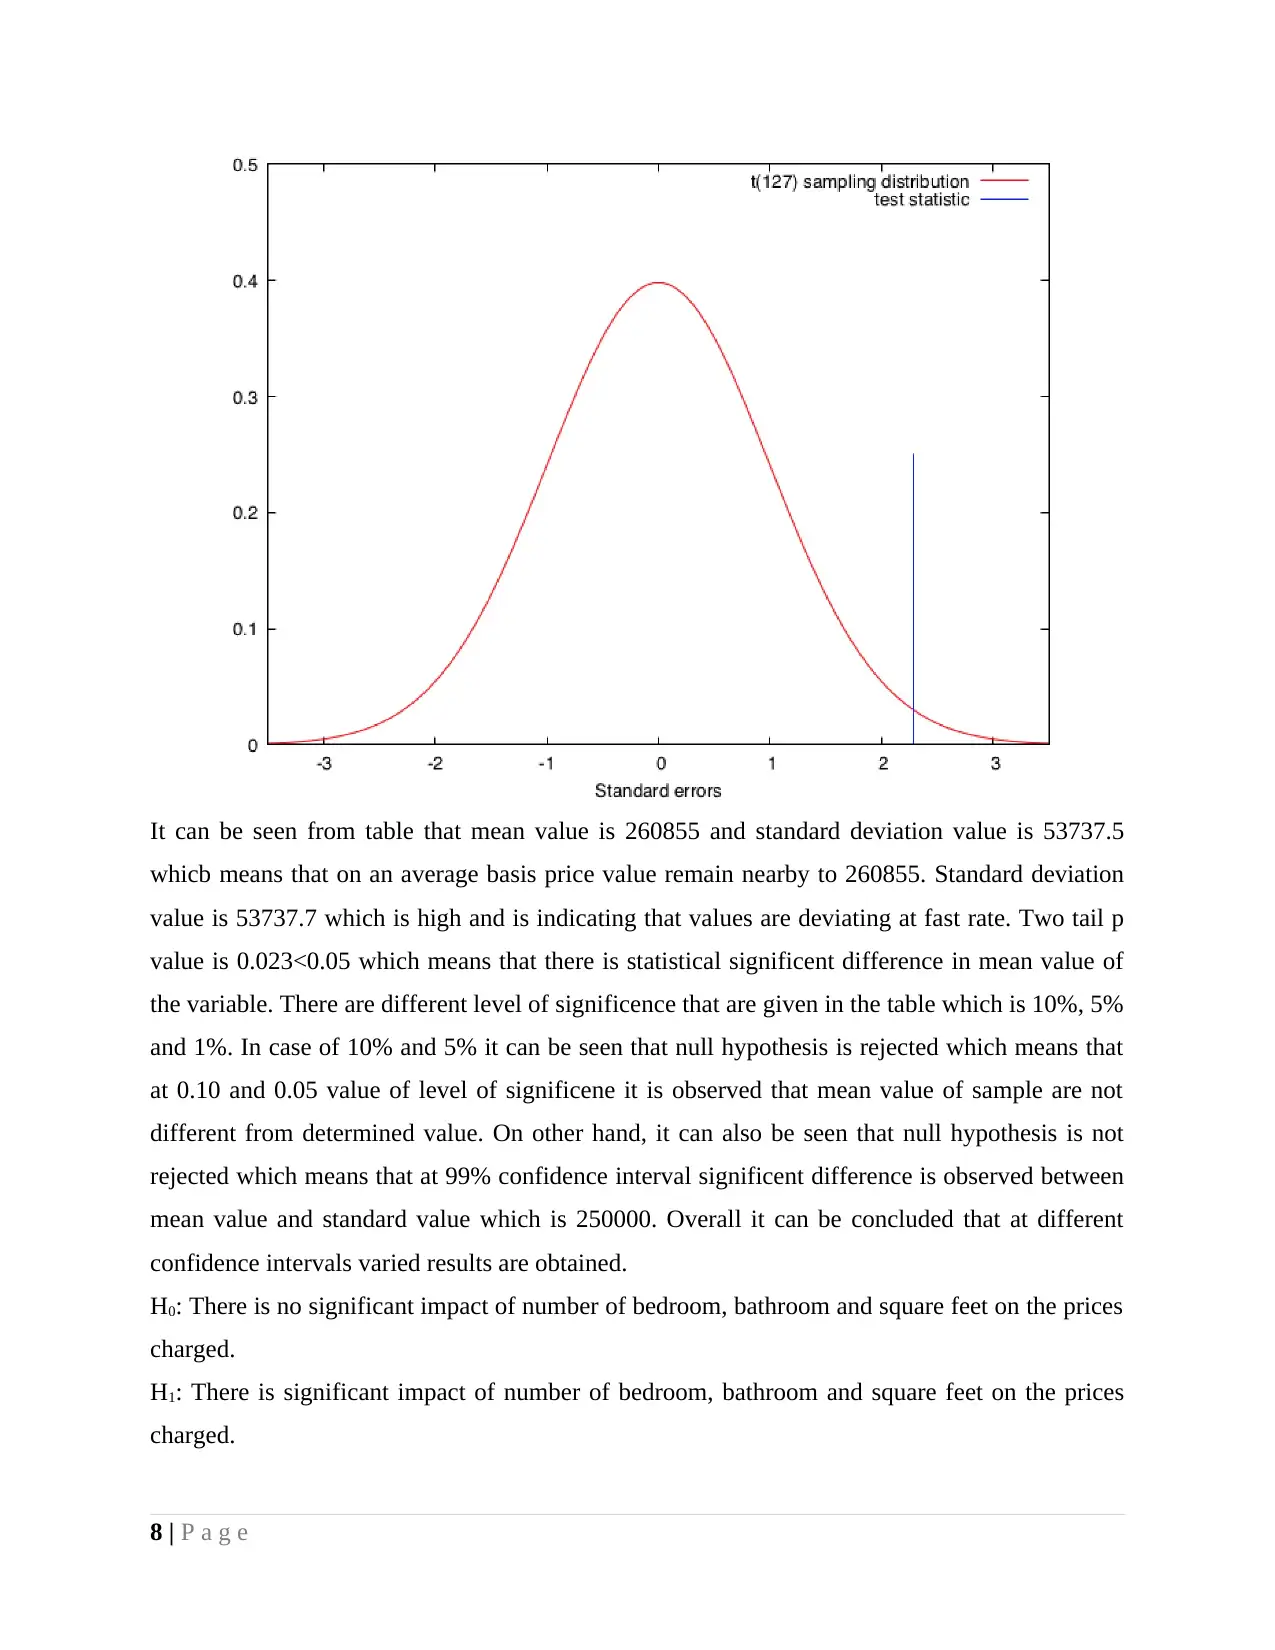
It can be seen from table that mean value is 260855 and standard deviation value is 53737.5
whicb means that on an average basis price value remain nearby to 260855. Standard deviation
value is 53737.7 which is high and is indicating that values are deviating at fast rate. Two tail p
value is 0.023<0.05 which means that there is statistical significent difference in mean value of
the variable. There are different level of significence that are given in the table which is 10%, 5%
and 1%. In case of 10% and 5% it can be seen that null hypothesis is rejected which means that
at 0.10 and 0.05 value of level of significene it is observed that mean value of sample are not
different from determined value. On other hand, it can also be seen that null hypothesis is not
rejected which means that at 99% confidence interval significent difference is observed between
mean value and standard value which is 250000. Overall it can be concluded that at different
confidence intervals varied results are obtained.
H0: There is no significant impact of number of bedroom, bathroom and square feet on the prices
charged.
H1: There is significant impact of number of bedroom, bathroom and square feet on the prices
charged.
8 | P a g e
Paraphrase This Document
Need a fresh take? Get an instant paraphrase of this document with our AI Paraphraser
Test: Regression: In statistical modelling, regression is used for the predictive analysis that
explains relationship among various variables. The measure is used as an attempt to determine
the impact of various independent variables over one dependent variable. Thus, it is the best
statistical measure that will help analyst to determine whether number of bedroom, bathroom and
square feet significantly affects the prices charged or not.
Results attached in Appendix
Interpretation: The regression statistics found multiple R of 0.662 shows moderate
association between prices and all the independent variables because the value of correlation
coefficient of 0.662 is middle of 0.25-0.75. However, coefficient of determination (R square) is
found to 0.439 for the given variable.
The statistical results present that for each unit increase in number of bedroom, prices
changed by 20919.85 or vice-versa. However, with per square feet increase, prices increase by
71.28 whereas with the increase in bathroom number, it rises up by 27092.26. P-value indicates
likelihood whether the results is real or occur by chance. In statistics, P value is used to
determine that whether the impact is significant or not. Considering sq ft as an independent
variable, P-value is 0.001 shows that it has a significant impact over price. Similarly, bedroom
and bathroom shows P-value of 0.00047 and 0.0016 that is below 0.05 (5% level of
significance). Hence, it can be said that all the independent variables affects the prices. However,
on the other side, looking to overall significance F value, it is found that value goes beyond 0.05
as it is 1.53, hence, it can be interpreted that overall impact of all the independent variables,
bedroom, bathroom and size does not have a significant impact over the prices charged.
CONCLUSION
On basis of above discussion it is concluded that there is significent importance of
analytical tool for the firms because it help them in analyzing situation in better manner. It is also
concluded that majority of respondents received offer 3 times in respect to their homes. Square
feet of 2000 is observed in case of most of homes. It is also identified that there 3 bedrooms and
3 bathrooms in case of most of homes. Due to all these factors price of home remain in range of
260854. Regression results reflect that due to change in number of bedrooms no change comes in
price of homes or properties. Means that there may be other components that may play important
role in affecting sales price of property.
9 | P a g e
Further research
On basis of research done it is identified that there is further need to do research and
under this an attempt must be made to identify whether with change in economic environment
any sort of variation comes in price of residential properties.
Recommendation
On basis of above discussion it is recommended that focus must be on increasing number
of bedrooms so that price of property can be increased at rapid rate. It is important to do because
people give much importance to this factor while purchasing home or any flat.
10 | P a g e
⊘ This is a preview!⊘
Do you want full access?
Subscribe today to unlock all pages.
Trusted by 1+ million students worldwide
1 out of 16
Related Documents


Your All-in-One AI-Powered Toolkit for Academic Success.
+13062052269
info@desklib.com
Available 24*7 on WhatsApp / Email
![[object Object]](/_next/static/media/star-bottom.7253800d.svg)
Unlock your academic potential
Copyright © 2020–2026 A2Z Services. All Rights Reserved. Developed and managed by ZUCOL.