Managerial Accounting: Ratio Analysis of Rio Tinto and Anglo American
VerifiedAdded on 2023/06/17
|26
|4593
|157
AI Summary
This report analyzes the performance of Rio Tinto and Anglo American through different financial techniques such as ratio analysis, income statement, cash flow statement, and balance sheet. It also suggests diversification opportunities for both companies in the mining sector.
Contribute Materials
Your contribution can guide someone’s learning journey. Share your
documents today.

Managerial Accounting
Secure Best Marks with AI Grader
Need help grading? Try our AI Grader for instant feedback on your assignments.

Contents
INTRODUCTION...........................................................................................................................................3
MAIN BODY.................................................................................................................................................3
Overview of company..............................................................................................................................3
Ratio analysis of Rio Tinto and Anglo American.......................................................................................4
Income statement.................................................................................................................................13
Balance sheet........................................................................................................................................14
Comparison on basis of profit................................................................................................................16
Diversification opportunities for Anglo and Rio.....................................................................................16
CONCLUSION.............................................................................................................................................17
REFERENCES..............................................................................................................................................18
APPENDIX..................................................................................................................................................20
INTRODUCTION
Managerial accounting is the act of obtaining, collecting, understanding, and delivering guidance
to stakeholders in order to assist them in making choices inside an organisation and achieving
corporate objectives. The information gathered covers all areas of accountancy that tell the
effective management processes about the expenses of items or services acquired by the
organisation. Budgets are used by budget holders to evaluate the business' operational plan.
Managerial accounting is especially useful in strongly efficient and dynamic company contexts
where immediate choices must be addressed (Poorhassan, 2020). Certain considerations might be
related to a business strategy, financing, or cash flow analysis. Managerial accounting will utilize
performance data to promptly assess the issue. The idea would be to use the budgeting to assist
create smaller operations choices that will improve the organisation boost its operational
effectiveness.
This report based on the two companies which are related to same sectors such as, Anglo
American and Rio Tinto. In this report analysis both company performance by different financial
techniques. For this require to calculate financial ratios which are presented actual performance
of the business and analysis income statement, cash flow statement and balance sheet both
companies. At the end concluded that which company is best in mining sector and run their
business activities in proper manner (Janie and et.al, 2020).
MAIN BODY
Overview of company
Rio Tinto is an Anglo-Australian multinational business that produces iron ore, copper,
diamonds, gold, and uranium. It is the country's second commodities and mining firm, trailing
only BHP. The corporation was created in 1873, when an international coalition of businessmen
acquired from the Spanish government a mine facility on the Rio Tinto in Huelva, Spain. Rio
Anglo American plc is a global mining business headquartered in London, England. It is
the biggest producer of platinum, accounting for almost 40% of world exports, and also a
significant supplier of diamonds, copper, nickel, iron ore, and metallurgy and thermal coal.
Anglo American is a component of the FTSE 100 Index and has its principal listed on the
Secure Best Marks with AI Grader
Need help grading? Try our AI Grader for instant feedback on your assignments.
London Stock. The Johannesburg Stock Exchange has a notable influence for the corporation
(Korhonen and et.al, 2020).
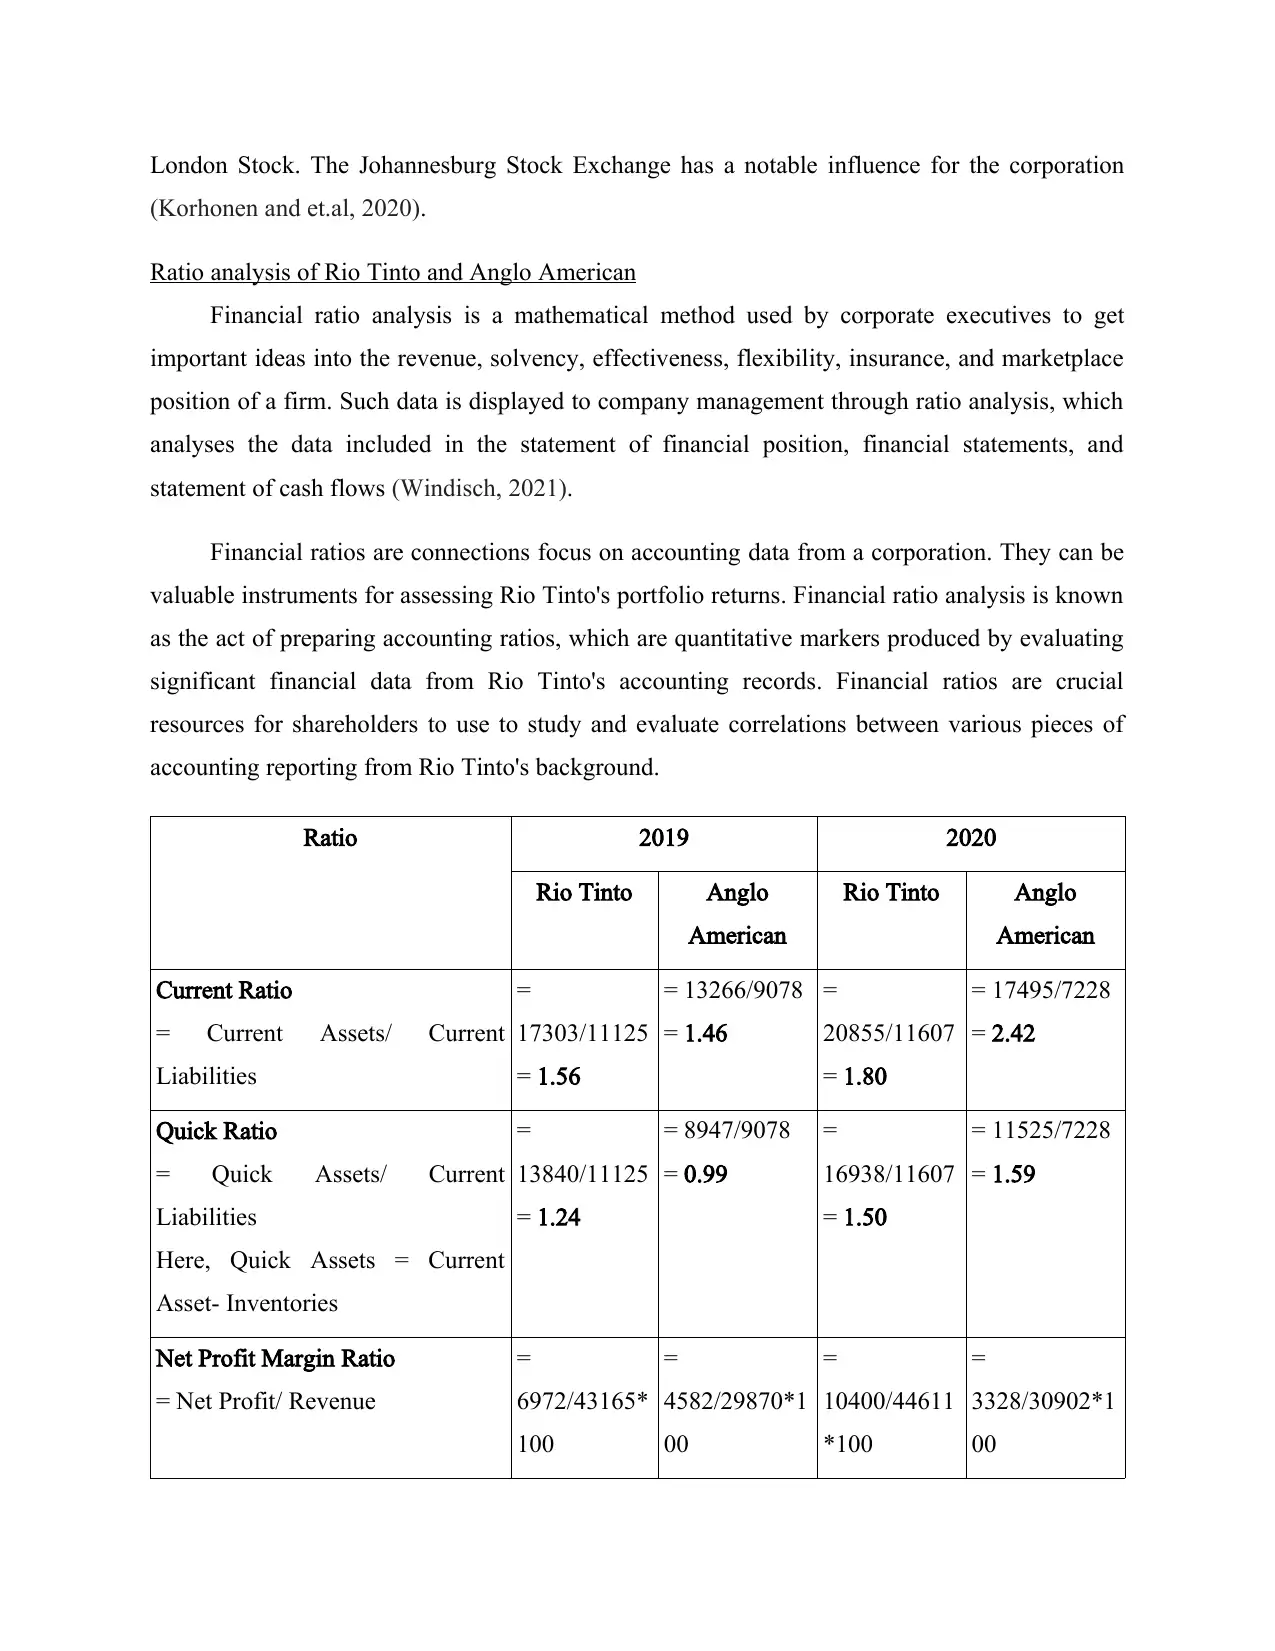
Ratio analysis of Rio Tinto and Anglo American
Financial ratio analysis is a mathematical method used by corporate executives to get
important ideas into the revenue, solvency, effectiveness, flexibility, insurance, and marketplace
position of a firm. Such data is displayed to company management through ratio analysis, which
analyses the data included in the statement of financial position, financial statements, and
statement of cash flows (Windisch, 2021).
Financial ratios are connections focus on accounting data from a corporation. They can be
valuable instruments for assessing Rio Tinto's portfolio returns. Financial ratio analysis is known
as the act of preparing accounting ratios, which are quantitative markers produced by evaluating
significant financial data from Rio Tinto's accounting records. Financial ratios are crucial
resources for shareholders to use to study and evaluate correlations between various pieces of
accounting reporting from Rio Tinto's background.
Ratio 2019 2020
Rio Tinto Anglo
American
Rio Tinto Anglo
American
Current Ratio
= Current Assets/ Current
Liabilities
=
17303/11125
= 1.56
= 13266/9078
= 1.46
=
20855/11607
= 1.80
= 17495/7228
= 2.42
Quick Ratio
= Quick Assets/ Current
Liabilities
Here, Quick Assets = Current
Asset- Inventories
=
13840/11125
= 1.24
= 8947/9078
= 0.99
=
16938/11607
= 1.50
= 11525/7228
= 1.59
Net Profit Margin Ratio
= Net Profit/ Revenue
=
6972/43165*
100
=
4582/29870*1
00
=
10400/44611
*100
=
3328/30902*1
00
(Korhonen and et.al, 2020).
Ratio analysis of Rio Tinto and Anglo American
Financial ratio analysis is a mathematical method used by corporate executives to get
important ideas into the revenue, solvency, effectiveness, flexibility, insurance, and marketplace
position of a firm. Such data is displayed to company management through ratio analysis, which
analyses the data included in the statement of financial position, financial statements, and
statement of cash flows (Windisch, 2021).
Financial ratios are connections focus on accounting data from a corporation. They can be
valuable instruments for assessing Rio Tinto's portfolio returns. Financial ratio analysis is known
as the act of preparing accounting ratios, which are quantitative markers produced by evaluating
significant financial data from Rio Tinto's accounting records. Financial ratios are crucial
resources for shareholders to use to study and evaluate correlations between various pieces of
accounting reporting from Rio Tinto's background.
Ratio 2019 2020
Rio Tinto Anglo
American
Rio Tinto Anglo
American
Current Ratio
= Current Assets/ Current
Liabilities
=
17303/11125
= 1.56
= 13266/9078
= 1.46
=
20855/11607
= 1.80
= 17495/7228
= 2.42
Quick Ratio
= Quick Assets/ Current
Liabilities
Here, Quick Assets = Current
Asset- Inventories
=
13840/11125
= 1.24
= 8947/9078
= 0.99
=
16938/11607
= 1.50
= 11525/7228
= 1.59
Net Profit Margin Ratio
= Net Profit/ Revenue
=
6972/43165*
100
=
4582/29870*1
00
=
10400/44611
*100
=
3328/30902*1
00
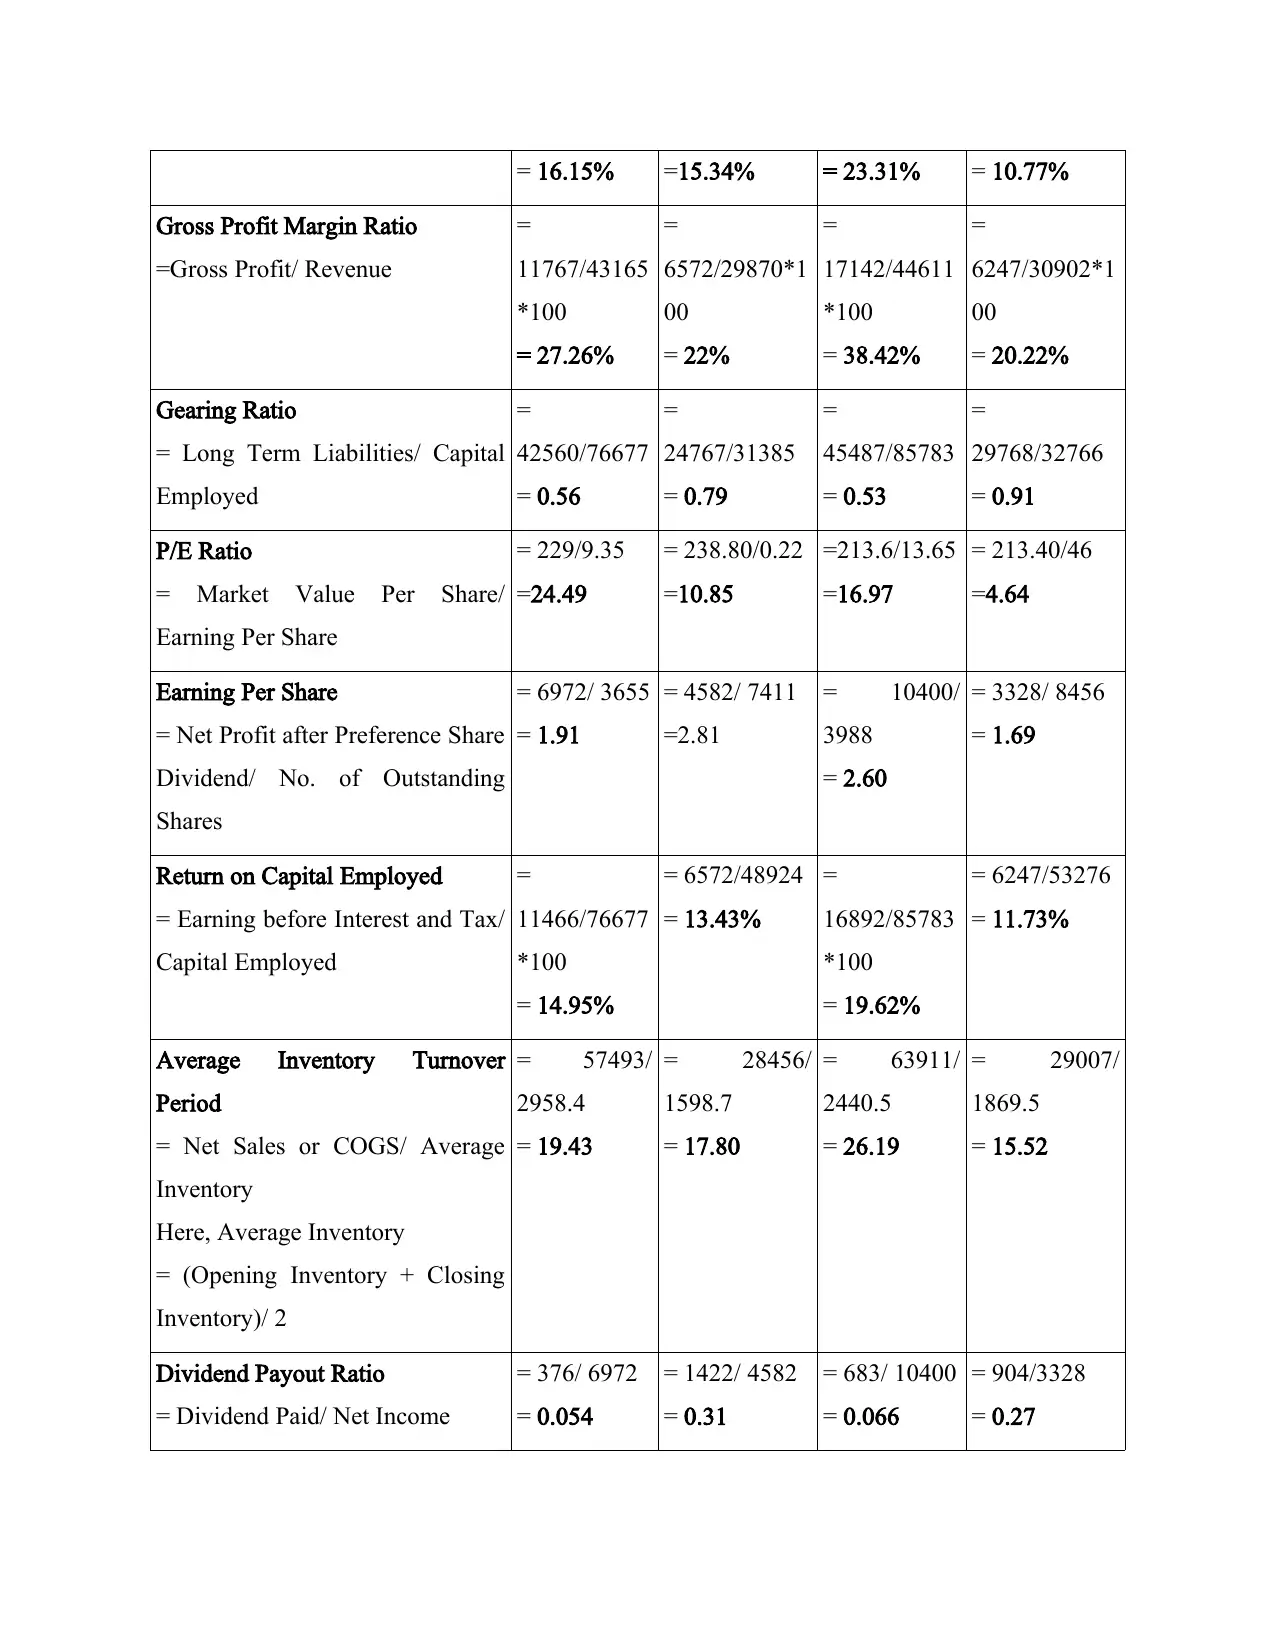
= 16.15% =15.34% = 23.31% = 10.77%
Gross Profit Margin Ratio
=Gross Profit/ Revenue
=
11767/43165
*100
= 27.26%
=
6572/29870*1
00
= 22%
=
17142/44611
*100
= 38.42%
=
6247/30902*1
00
= 20.22%
Gearing Ratio
= Long Term Liabilities/ Capital
Employed
=
42560/76677
= 0.56
=
24767/31385
= 0.79
=
45487/85783
= 0.53
=
29768/32766
= 0.91
P/E Ratio
= Market Value Per Share/
Earning Per Share
= 229/9.35
=24.49
= 238.80/0.22
=10.85
=213.6/13.65
=16.97
= 213.40/46
=4.64
Earning Per Share
= Net Profit after Preference Share
Dividend/ No. of Outstanding
Shares
= 6972/ 3655
= 1.91
= 4582/ 7411
=2.81
= 10400/
3988
= 2.60
= 3328/ 8456
= 1.69
Return on Capital Employed
= Earning before Interest and Tax/
Capital Employed
=
11466/76677
*100
= 14.95%
= 6572/48924
= 13.43%
=
16892/85783
*100
= 19.62%
= 6247/53276
= 11.73%
Average Inventory Turnover
Period
= Net Sales or COGS/ Average
Inventory
Here, Average Inventory
= (Opening Inventory + Closing
Inventory)/ 2
= 57493/
2958.4
= 19.43
= 28456/
1598.7
= 17.80
= 63911/
2440.5
= 26.19
= 29007/
1869.5
= 15.52
Dividend Payout Ratio
= Dividend Paid/ Net Income
= 376/ 6972
= 0.054
= 1422/ 4582
= 0.31
= 683/ 10400
= 0.066
= 904/3328
= 0.27
Current ratio:
Rio Tinto Anglo
American Rio Tinto Anglo
American
2019 2020
0
0.5
1
1.5
2
2.5
1.56 1.46
1.8
2.42
Current ratio
Current ratio
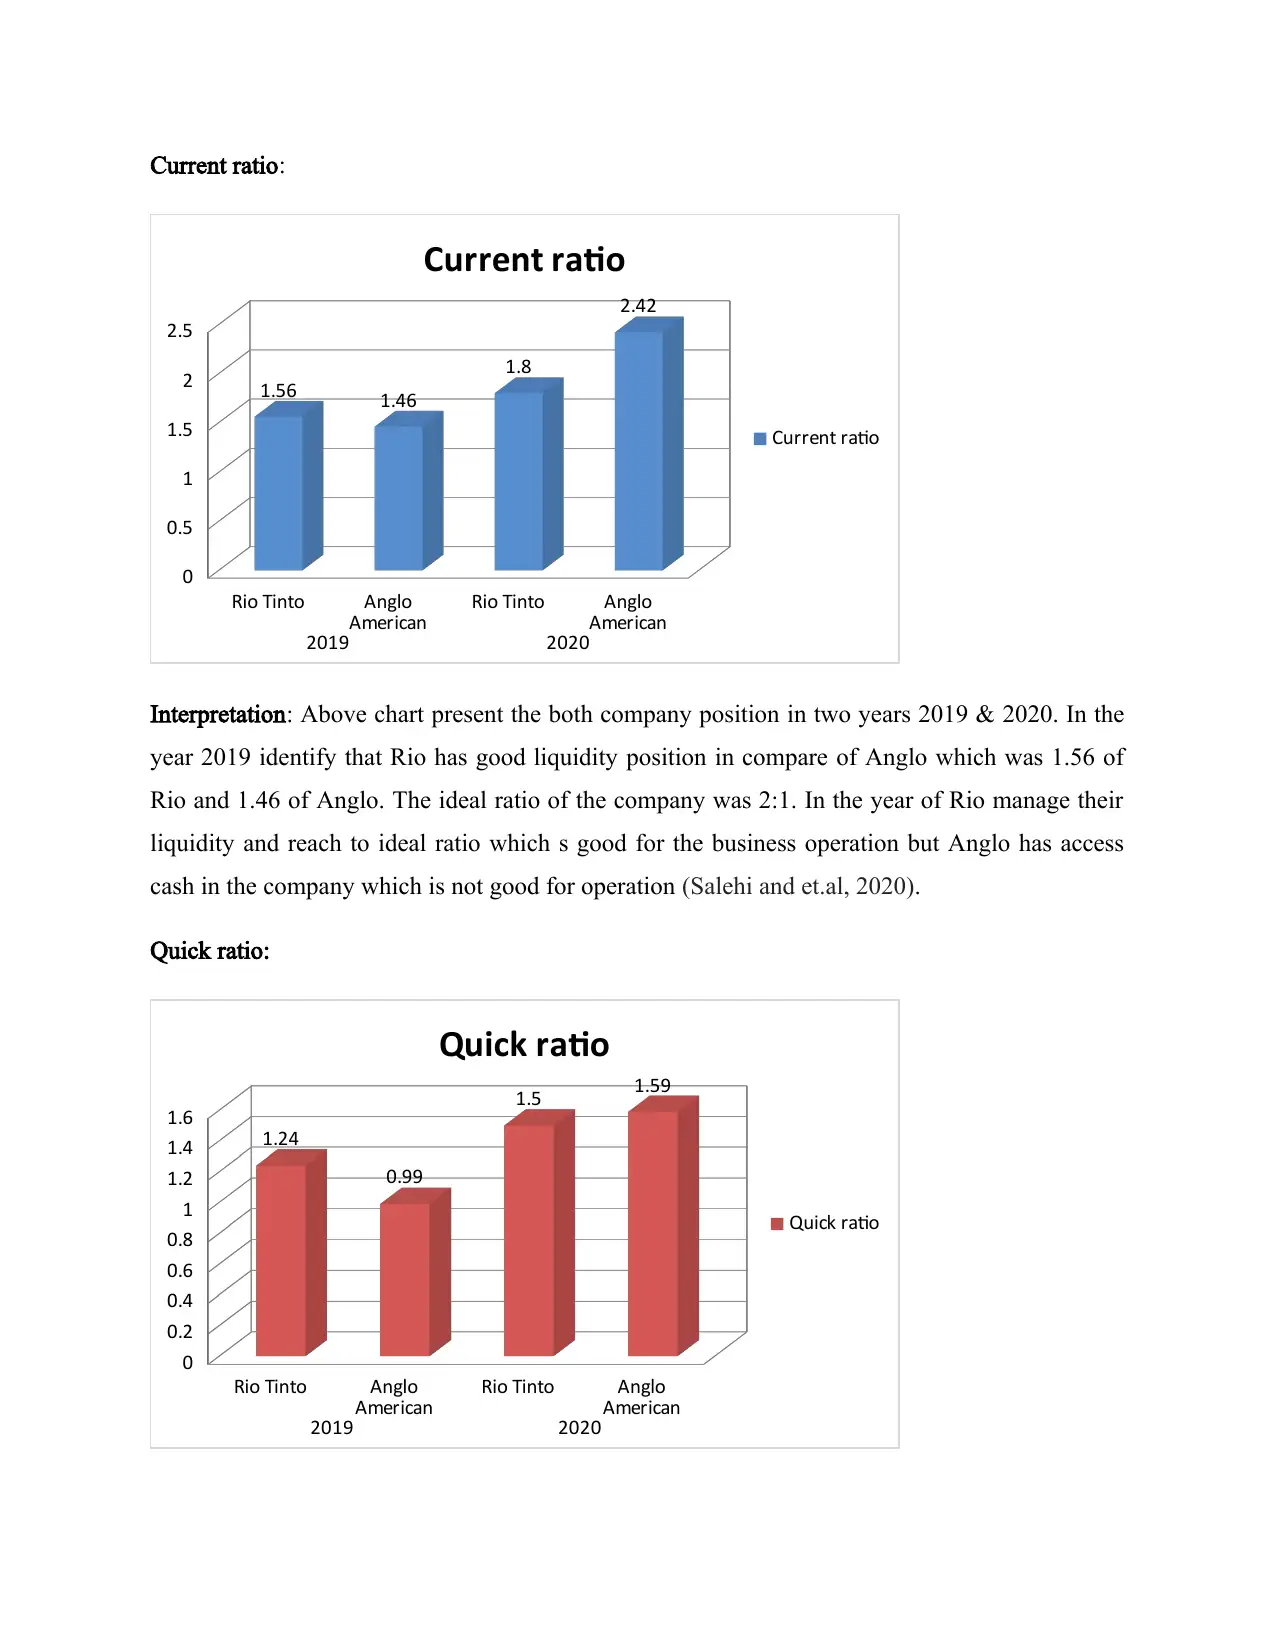
Interpretation: Above chart present the both company position in two years 2019 & 2020. In the
year 2019 identify that Rio has good liquidity position in compare of Anglo which was 1.56 of
Rio and 1.46 of Anglo. The ideal ratio of the company was 2:1. In the year of Rio manage their
liquidity and reach to ideal ratio which s good for the business operation but Anglo has access
cash in the company which is not good for operation (Salehi and et.al, 2020).
Quick ratio:
Rio Tinto Anglo
American Rio Tinto Anglo
American
2019 2020
0
0.2
0.4
0.6
0.8
1
1.2
1.4
1.6
1.24
0.99
1.5 1.59
Quick ratio
Quick ratio
Rio Tinto Anglo
American Rio Tinto Anglo
American
2019 2020
0
0.5
1
1.5
2
2.5
1.56 1.46
1.8
2.42
Current ratio
Current ratio
Interpretation: Above chart present the both company position in two years 2019 & 2020. In the
year 2019 identify that Rio has good liquidity position in compare of Anglo which was 1.56 of
Rio and 1.46 of Anglo. The ideal ratio of the company was 2:1. In the year of Rio manage their
liquidity and reach to ideal ratio which s good for the business operation but Anglo has access
cash in the company which is not good for operation (Salehi and et.al, 2020).
Quick ratio:
Rio Tinto Anglo
American Rio Tinto Anglo
American
2019 2020
0
0.2
0.4
0.6
0.8
1
1.2
1.4
1.6
1.24
0.99
1.5 1.59
Quick ratio
Quick ratio
Paraphrase This Document
Need a fresh take? Get an instant paraphrase of this document with our AI Paraphraser
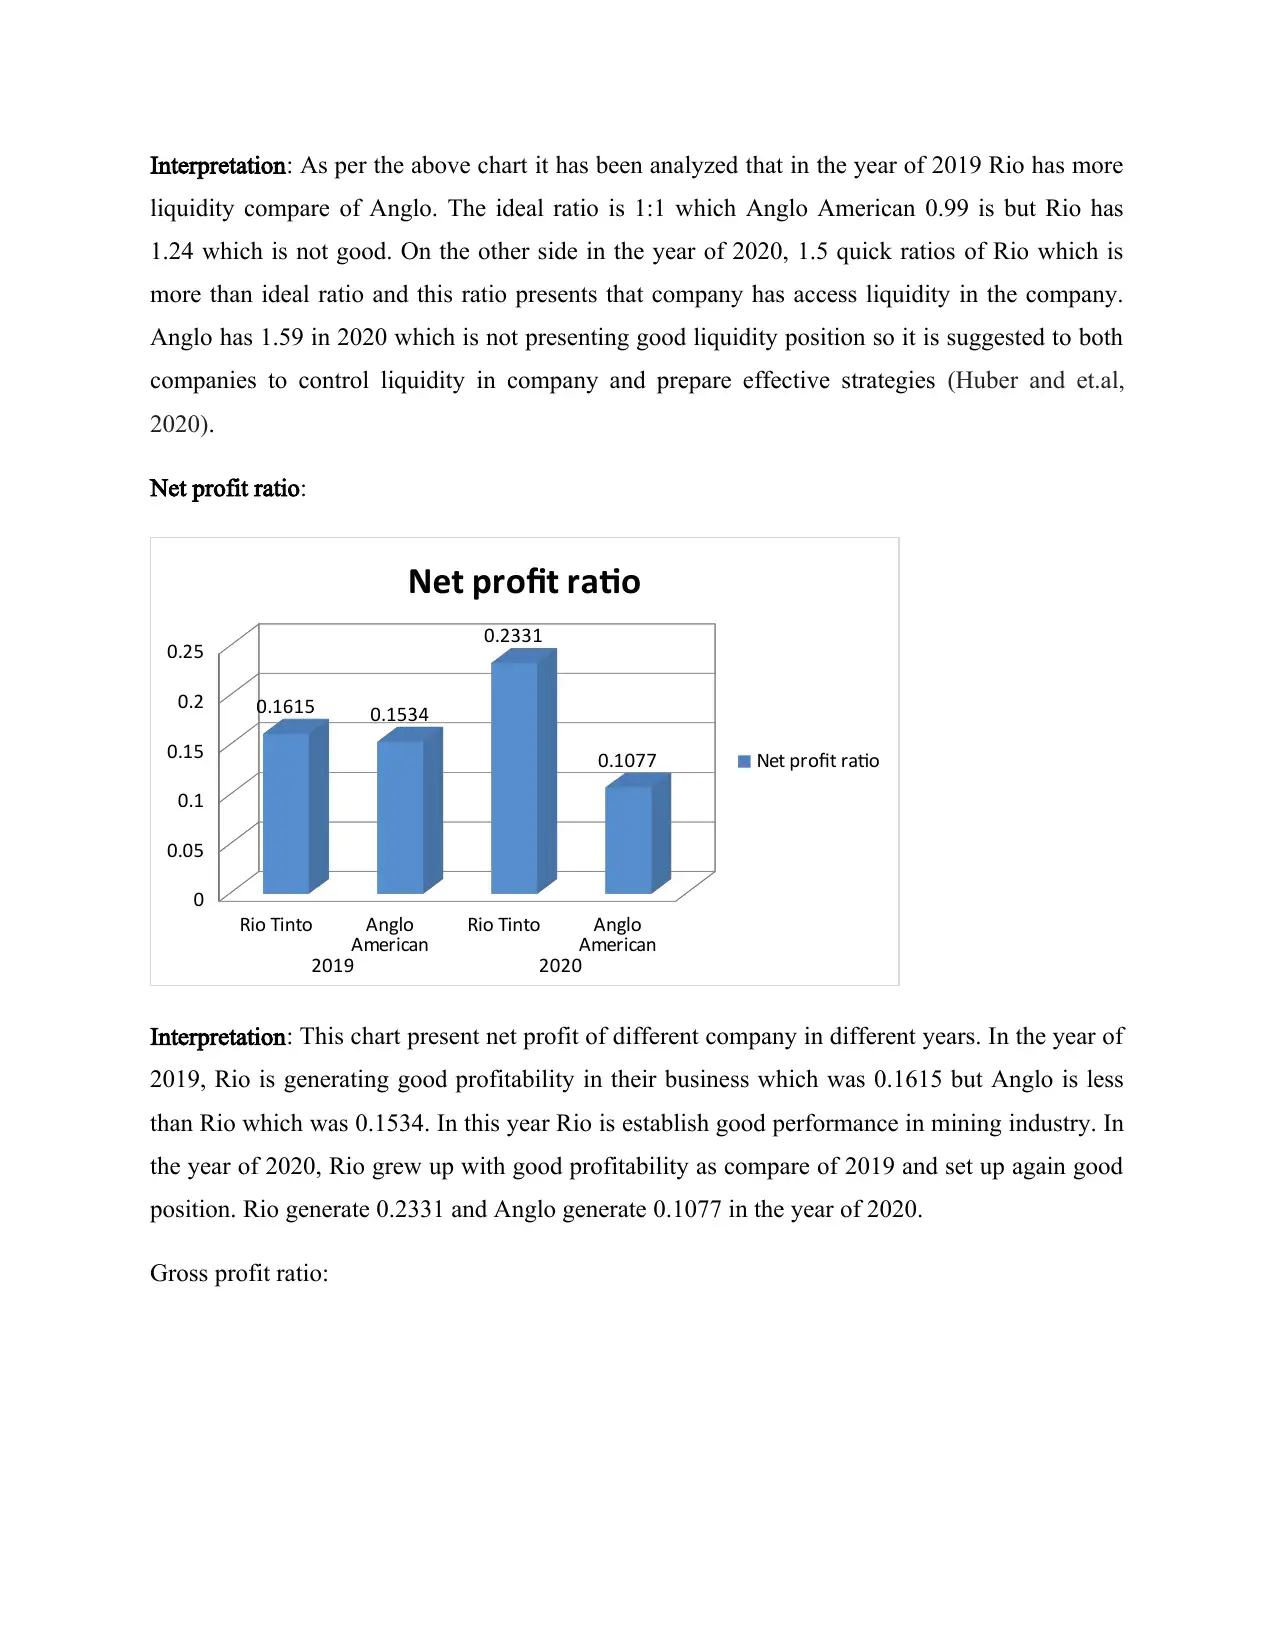
Interpretation: As per the above chart it has been analyzed that in the year of 2019 Rio has more
liquidity compare of Anglo. The ideal ratio is 1:1 which Anglo American 0.99 is but Rio has
1.24 which is not good. On the other side in the year of 2020, 1.5 quick ratios of Rio which is
more than ideal ratio and this ratio presents that company has access liquidity in the company.
Anglo has 1.59 in 2020 which is not presenting good liquidity position so it is suggested to both
companies to control liquidity in company and prepare effective strategies (Huber and et.al,
2020).
Net profit ratio:
Rio Tinto Anglo
American Rio Tinto Anglo
American
2019 2020
0
0.05
0.1
0.15
0.2
0.25
0.1615 0.1534
0.2331
0.1077
Net profit ratio
Net profit ratio
Interpretation: This chart present net profit of different company in different years. In the year of
2019, Rio is generating good profitability in their business which was 0.1615 but Anglo is less
than Rio which was 0.1534. In this year Rio is establish good performance in mining industry. In
the year of 2020, Rio grew up with good profitability as compare of 2019 and set up again good
position. Rio generate 0.2331 and Anglo generate 0.1077 in the year of 2020.
Gross profit ratio:
Rio Tinto Anglo
American Rio Tinto Anglo
American
2019 2020
0
0.05
0.1
0.15
0.2
0.25
0.3
0.35
0.4
0.2726
0.22
0.3842
0.2022
Gross profit ratio
Gross profit ratio
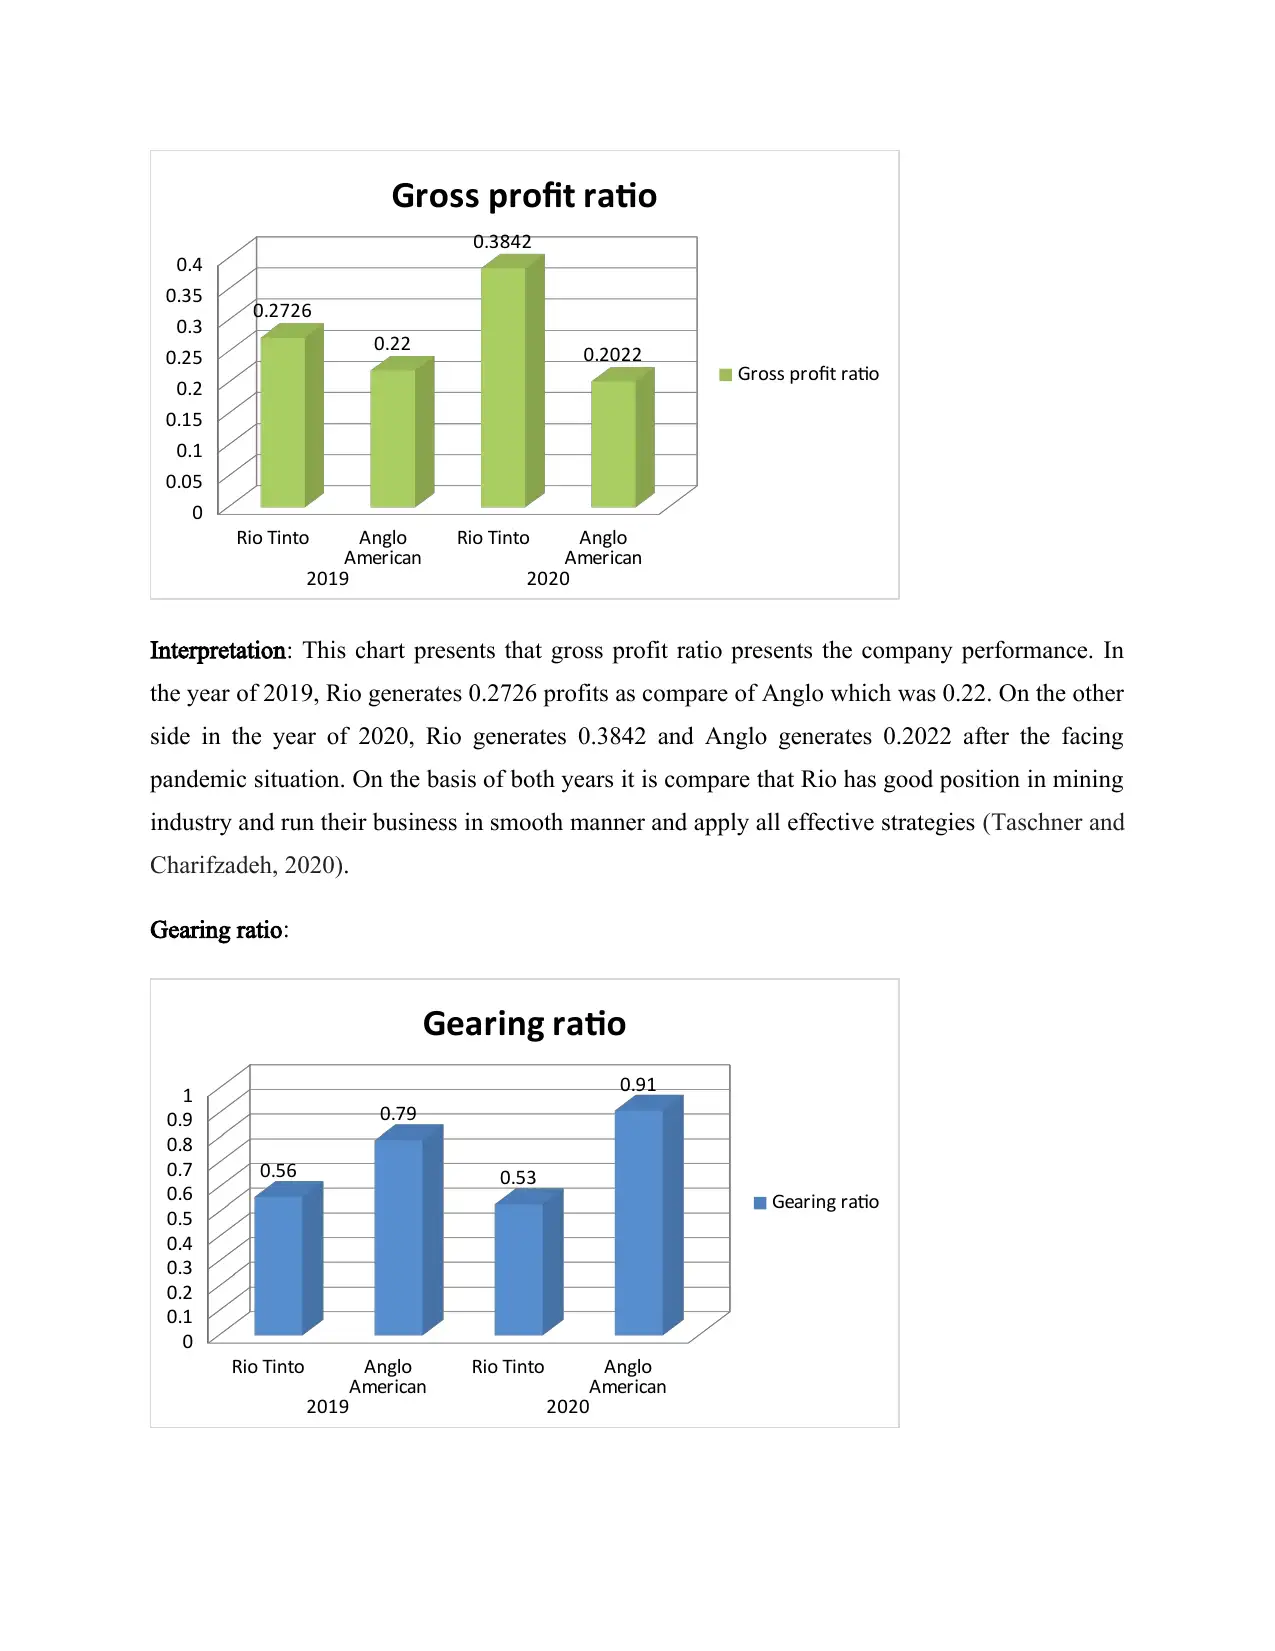
Interpretation: This chart presents that gross profit ratio presents the company performance. In
the year of 2019, Rio generates 0.2726 profits as compare of Anglo which was 0.22. On the other
side in the year of 2020, Rio generates 0.3842 and Anglo generates 0.2022 after the facing
pandemic situation. On the basis of both years it is compare that Rio has good position in mining
industry and run their business in smooth manner and apply all effective strategies (Taschner and
Charifzadeh, 2020).
Gearing ratio:
Rio Tinto Anglo
American Rio Tinto Anglo
American
2019 2020
0
0.1
0.2
0.3
0.4
0.5
0.6
0.7
0.8
0.9
1
0.56
0.79
0.53
0.91
Gearing ratio
Gearing ratio
American Rio Tinto Anglo
American
2019 2020
0
0.05
0.1
0.15
0.2
0.25
0.3
0.35
0.4
0.2726
0.22
0.3842
0.2022
Gross profit ratio
Gross profit ratio
Interpretation: This chart presents that gross profit ratio presents the company performance. In
the year of 2019, Rio generates 0.2726 profits as compare of Anglo which was 0.22. On the other
side in the year of 2020, Rio generates 0.3842 and Anglo generates 0.2022 after the facing
pandemic situation. On the basis of both years it is compare that Rio has good position in mining
industry and run their business in smooth manner and apply all effective strategies (Taschner and
Charifzadeh, 2020).
Gearing ratio:
Rio Tinto Anglo
American Rio Tinto Anglo
American
2019 2020
0
0.1
0.2
0.3
0.4
0.5
0.6
0.7
0.8
0.9
1
0.56
0.79
0.53
0.91
Gearing ratio
Gearing ratio
Interpretation: It is investment based ratio that helps investors to take decision for investment.
On the basis of this ratio they are taking decision to in different companies (Hidayat, 2020). A
per the above chart it is analyzing tat in the year of 2019, Rio generate 0.56 and Anglo earn 0.79.
It means a gearing ratio more than 50% is usually regarded substantially robust and durable or
graded. A gearing ratio of less than 25% is often seen as reduced by both shareholders and
creditors. For very well businesses, a gearing ratio of 25 to 50 percent is particularly suited or
standard. In the year of 2020, Rio earns 0.53 and Anglo 0.91 so need to control by both
companies to their leveraging activities specially suggested to Anglo American.
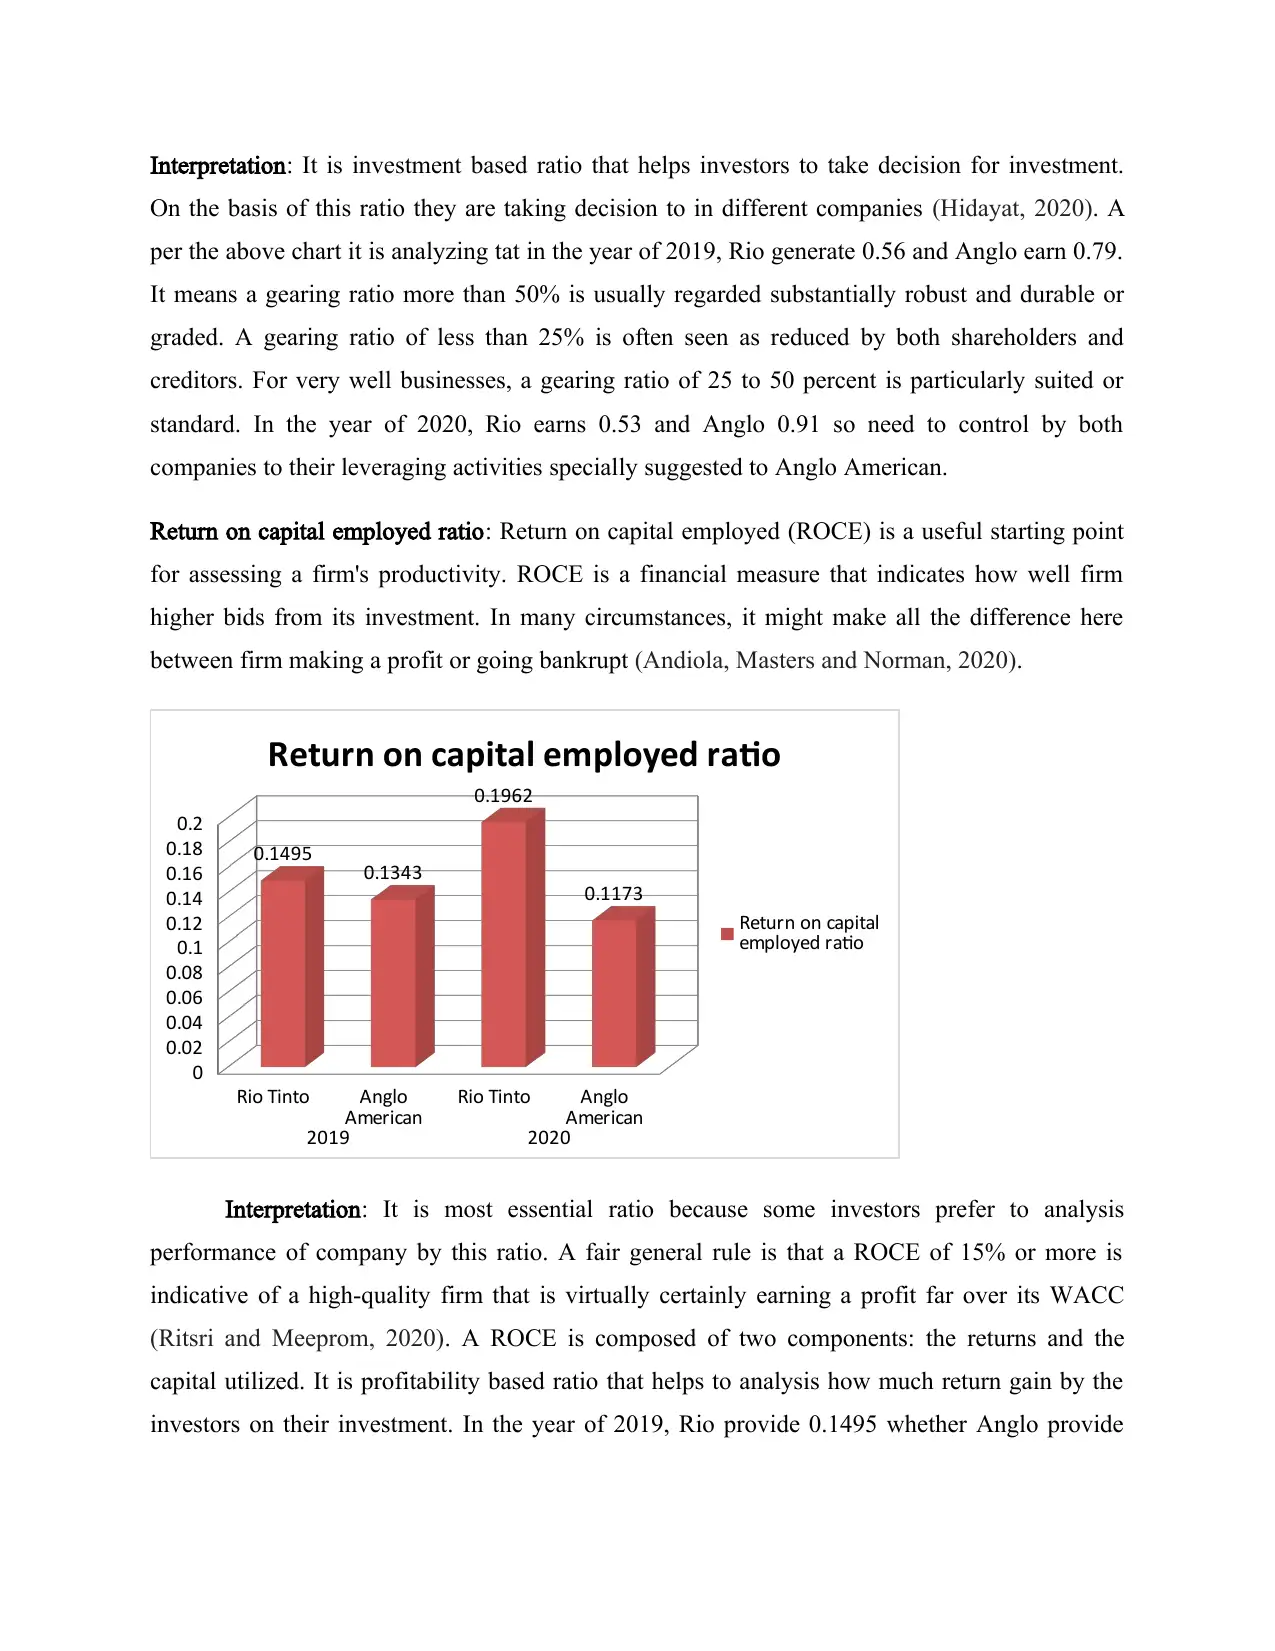
Return on capital employed ratio: Return on capital employed (ROCE) is a useful starting point
for assessing a firm's productivity. ROCE is a financial measure that indicates how well firm
higher bids from its investment. In many circumstances, it might make all the difference here
between firm making a profit or going bankrupt (Andiola, Masters and Norman, 2020).
Rio Tinto Anglo
American Rio Tinto Anglo
American
2019 2020
0
0.02
0.04
0.06
0.08
0.1
0.12
0.14
0.16
0.18
0.2
0.1495 0.1343
0.1962
0.1173
Return on capital employed ratio
Return on capital
employed ratio
Interpretation: It is most essential ratio because some investors prefer to analysis
performance of company by this ratio. A fair general rule is that a ROCE of 15% or more is
indicative of a high-quality firm that is virtually certainly earning a profit far over its WACC
(Ritsri and Meeprom, 2020). A ROCE is composed of two components: the returns and the
capital utilized. It is profitability based ratio that helps to analysis how much return gain by the
investors on their investment. In the year of 2019, Rio provide 0.1495 whether Anglo provide
On the basis of this ratio they are taking decision to in different companies (Hidayat, 2020). A
per the above chart it is analyzing tat in the year of 2019, Rio generate 0.56 and Anglo earn 0.79.
It means a gearing ratio more than 50% is usually regarded substantially robust and durable or
graded. A gearing ratio of less than 25% is often seen as reduced by both shareholders and
creditors. For very well businesses, a gearing ratio of 25 to 50 percent is particularly suited or
standard. In the year of 2020, Rio earns 0.53 and Anglo 0.91 so need to control by both
companies to their leveraging activities specially suggested to Anglo American.
Return on capital employed ratio: Return on capital employed (ROCE) is a useful starting point
for assessing a firm's productivity. ROCE is a financial measure that indicates how well firm
higher bids from its investment. In many circumstances, it might make all the difference here
between firm making a profit or going bankrupt (Andiola, Masters and Norman, 2020).
Rio Tinto Anglo
American Rio Tinto Anglo
American
2019 2020
0
0.02
0.04
0.06
0.08
0.1
0.12
0.14
0.16
0.18
0.2
0.1495 0.1343
0.1962
0.1173
Return on capital employed ratio
Return on capital
employed ratio
Interpretation: It is most essential ratio because some investors prefer to analysis
performance of company by this ratio. A fair general rule is that a ROCE of 15% or more is
indicative of a high-quality firm that is virtually certainly earning a profit far over its WACC
(Ritsri and Meeprom, 2020). A ROCE is composed of two components: the returns and the
capital utilized. It is profitability based ratio that helps to analysis how much return gain by the
investors on their investment. In the year of 2019, Rio provide 0.1495 whether Anglo provide
Secure Best Marks with AI Grader
Need help grading? Try our AI Grader for instant feedback on your assignments.
0.1343 to their investors. In the year of 2020, 0.1962 by Rio and 0.1173 by Anglo. This, it is
analyzing that Rio provide good return to their shareholders.
Price earnings ratio:
Rio Tinto Anglo
American Rio Tinto Anglo
American
2019 2020
0
5
10
15
20
25
24.49
10.85
16.97
4.64
Price earnings ratio
Price earnings ratio
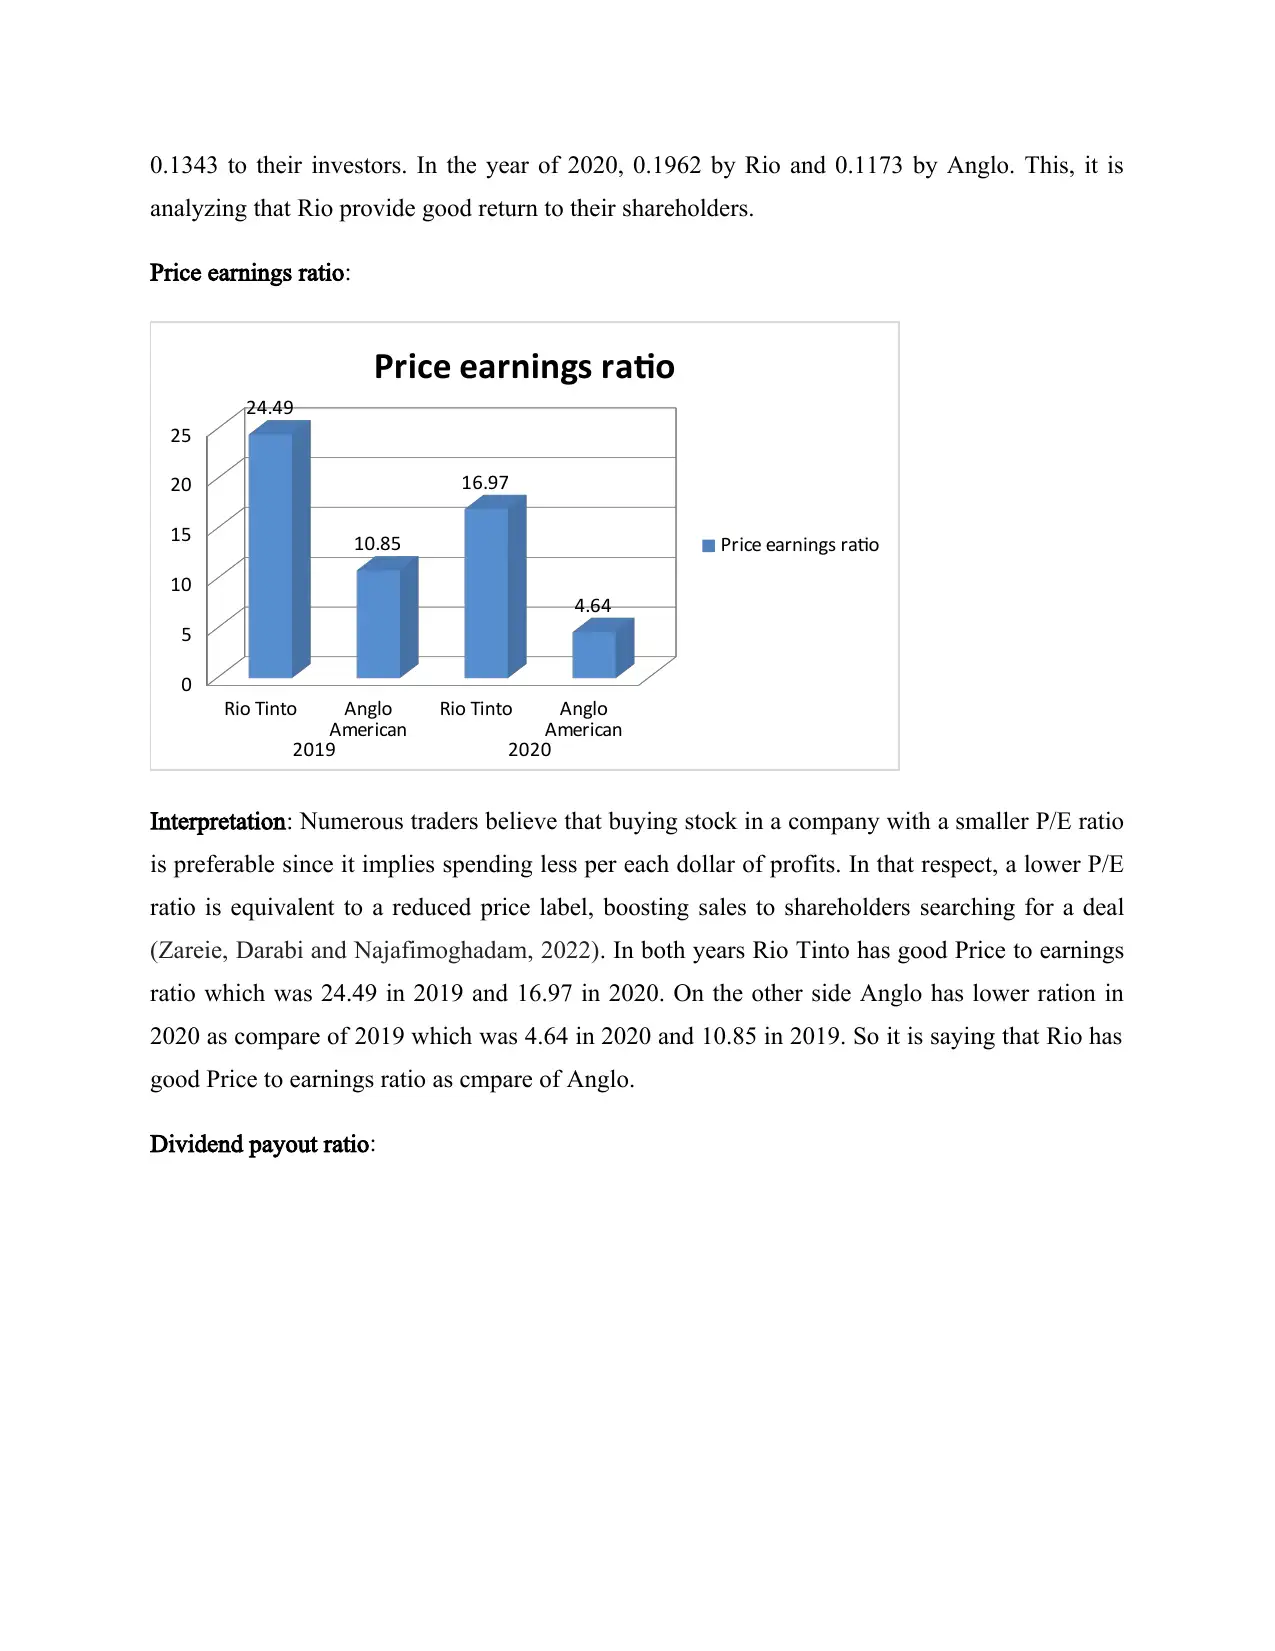
Interpretation: Numerous traders believe that buying stock in a company with a smaller P/E ratio
is preferable since it implies spending less per each dollar of profits. In that respect, a lower P/E
ratio is equivalent to a reduced price label, boosting sales to shareholders searching for a deal
(Zareie, Darabi and Najafimoghadam, 2022). In both years Rio Tinto has good Price to earnings
ratio which was 24.49 in 2019 and 16.97 in 2020. On the other side Anglo has lower ration in
2020 as compare of 2019 which was 4.64 in 2020 and 10.85 in 2019. So it is saying that Rio has
good Price to earnings ratio as cmpare of Anglo.
Dividend payout ratio:
analyzing that Rio provide good return to their shareholders.
Price earnings ratio:
Rio Tinto Anglo
American Rio Tinto Anglo
American
2019 2020
0
5
10
15
20
25
24.49
10.85
16.97
4.64
Price earnings ratio
Price earnings ratio
Interpretation: Numerous traders believe that buying stock in a company with a smaller P/E ratio
is preferable since it implies spending less per each dollar of profits. In that respect, a lower P/E
ratio is equivalent to a reduced price label, boosting sales to shareholders searching for a deal
(Zareie, Darabi and Najafimoghadam, 2022). In both years Rio Tinto has good Price to earnings
ratio which was 24.49 in 2019 and 16.97 in 2020. On the other side Anglo has lower ration in
2020 as compare of 2019 which was 4.64 in 2020 and 10.85 in 2019. So it is saying that Rio has
good Price to earnings ratio as cmpare of Anglo.
Dividend payout ratio:
Rio Tinto Anglo
American Rio Tinto Anglo
American
2019 2020
0
0.05
0.1
0.15
0.2
0.25
0.3
0.35
0.054
0.31
0.066
0.27
Dividend payout ratio
Dividend payout ratio
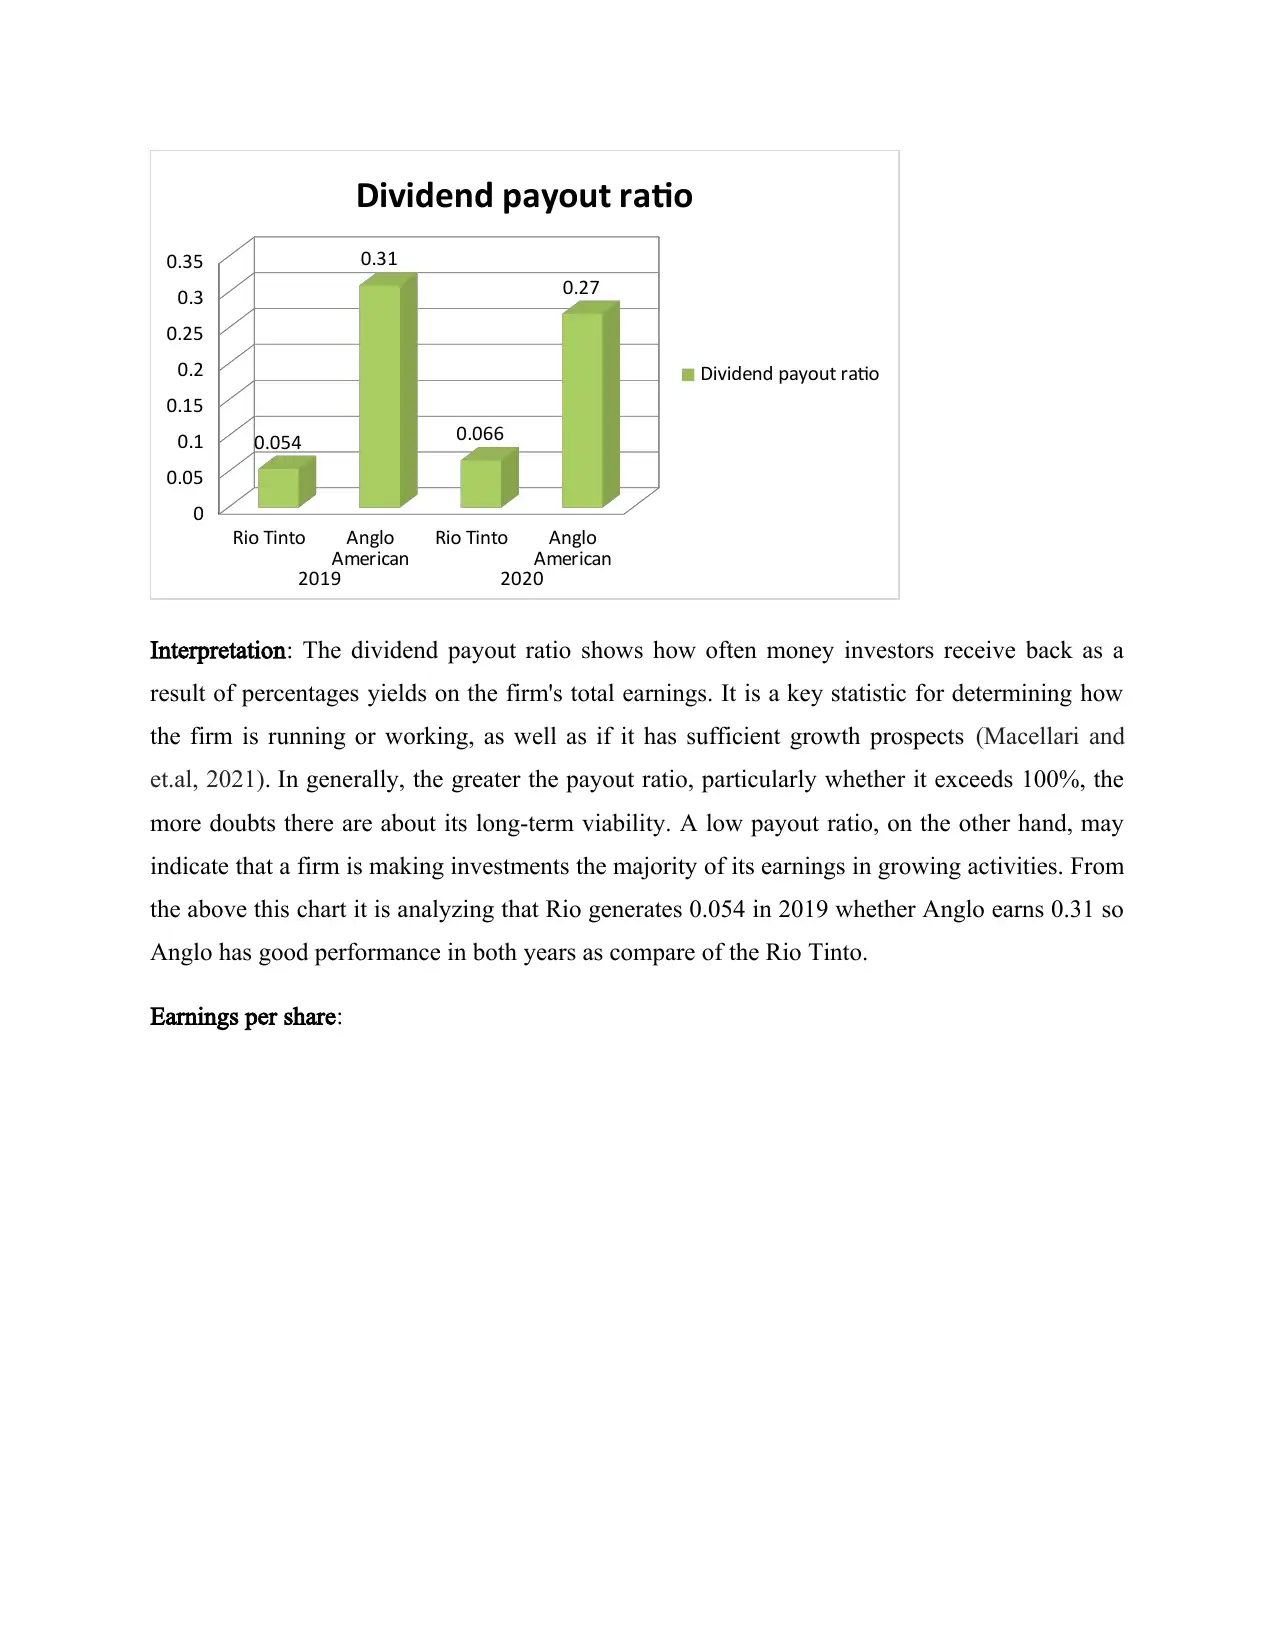
Interpretation: The dividend payout ratio shows how often money investors receive back as a
result of percentages yields on the firm's total earnings. It is a key statistic for determining how
the firm is running or working, as well as if it has sufficient growth prospects (Macellari and
et.al, 2021). In generally, the greater the payout ratio, particularly whether it exceeds 100%, the
more doubts there are about its long-term viability. A low payout ratio, on the other hand, may
indicate that a firm is making investments the majority of its earnings in growing activities. From
the above this chart it is analyzing that Rio generates 0.054 in 2019 whether Anglo earns 0.31 so
Anglo has good performance in both years as compare of the Rio Tinto.
Earnings per share:
American Rio Tinto Anglo
American
2019 2020
0
0.05
0.1
0.15
0.2
0.25
0.3
0.35
0.054
0.31
0.066
0.27
Dividend payout ratio
Dividend payout ratio
Interpretation: The dividend payout ratio shows how often money investors receive back as a
result of percentages yields on the firm's total earnings. It is a key statistic for determining how
the firm is running or working, as well as if it has sufficient growth prospects (Macellari and
et.al, 2021). In generally, the greater the payout ratio, particularly whether it exceeds 100%, the
more doubts there are about its long-term viability. A low payout ratio, on the other hand, may
indicate that a firm is making investments the majority of its earnings in growing activities. From
the above this chart it is analyzing that Rio generates 0.054 in 2019 whether Anglo earns 0.31 so
Anglo has good performance in both years as compare of the Rio Tinto.
Earnings per share:
Rio Tinto Anglo
American Rio Tinto Anglo
American
2019 2020
0
0.5
1
1.5
2
2.5
3
1.91
2.81 2.6
1.69
Earnings per share
Earnings per share
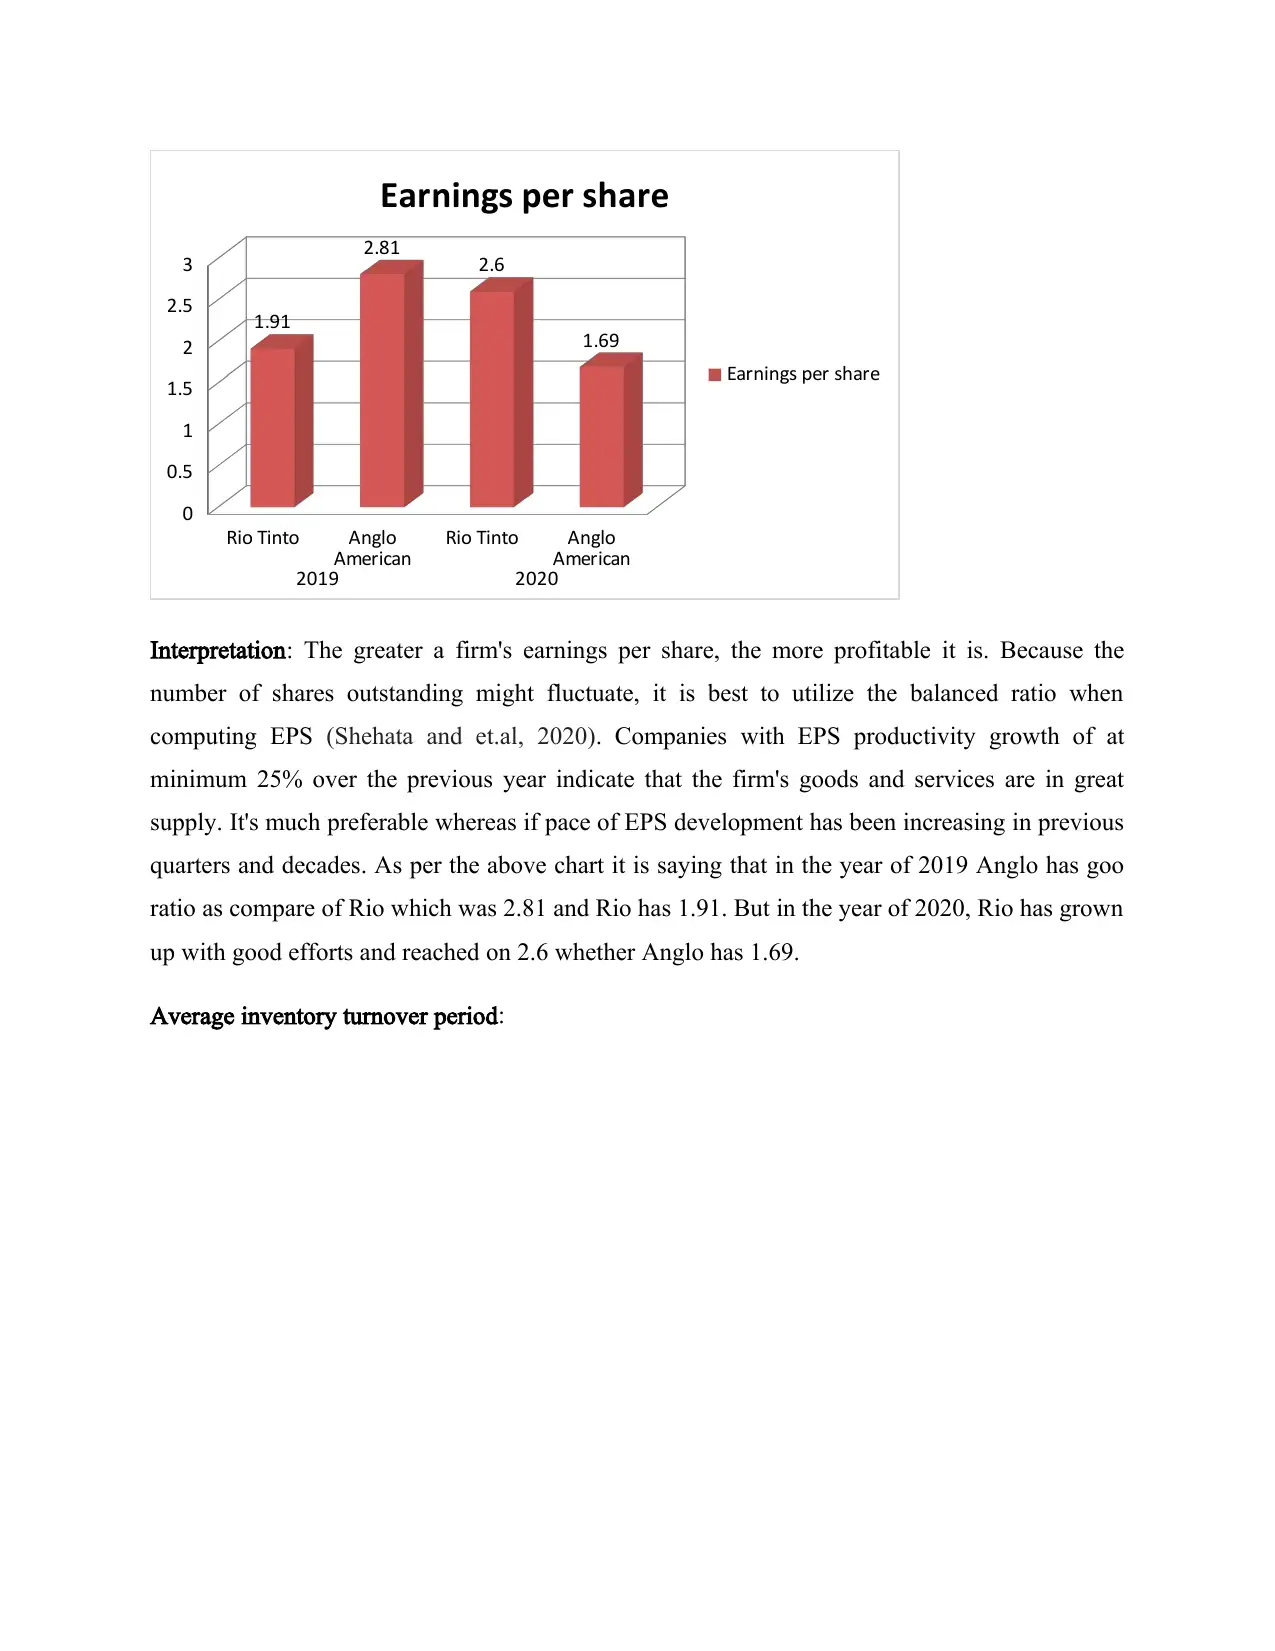
Interpretation: The greater a firm's earnings per share, the more profitable it is. Because the
number of shares outstanding might fluctuate, it is best to utilize the balanced ratio when
computing EPS (Shehata and et.al, 2020). Companies with EPS productivity growth of at
minimum 25% over the previous year indicate that the firm's goods and services are in great
supply. It's much preferable whereas if pace of EPS development has been increasing in previous
quarters and decades. As per the above chart it is saying that in the year of 2019 Anglo has goo
ratio as compare of Rio which was 2.81 and Rio has 1.91. But in the year of 2020, Rio has grown
up with good efforts and reached on 2.6 whether Anglo has 1.69.
Average inventory turnover period:
American Rio Tinto Anglo
American
2019 2020
0
0.5
1
1.5
2
2.5
3
1.91
2.81 2.6
1.69
Earnings per share
Earnings per share
Interpretation: The greater a firm's earnings per share, the more profitable it is. Because the
number of shares outstanding might fluctuate, it is best to utilize the balanced ratio when
computing EPS (Shehata and et.al, 2020). Companies with EPS productivity growth of at
minimum 25% over the previous year indicate that the firm's goods and services are in great
supply. It's much preferable whereas if pace of EPS development has been increasing in previous
quarters and decades. As per the above chart it is saying that in the year of 2019 Anglo has goo
ratio as compare of Rio which was 2.81 and Rio has 1.91. But in the year of 2020, Rio has grown
up with good efforts and reached on 2.6 whether Anglo has 1.69.
Average inventory turnover period:
Paraphrase This Document
Need a fresh take? Get an instant paraphrase of this document with our AI Paraphraser
Rio Tinto Anglo
American Rio Tinto Anglo
American
2019 2020
0
5
10
15
20
25
30
19.43 17.8
26.19
15.52
Average inventory turnover period
Average inventory
turnover period
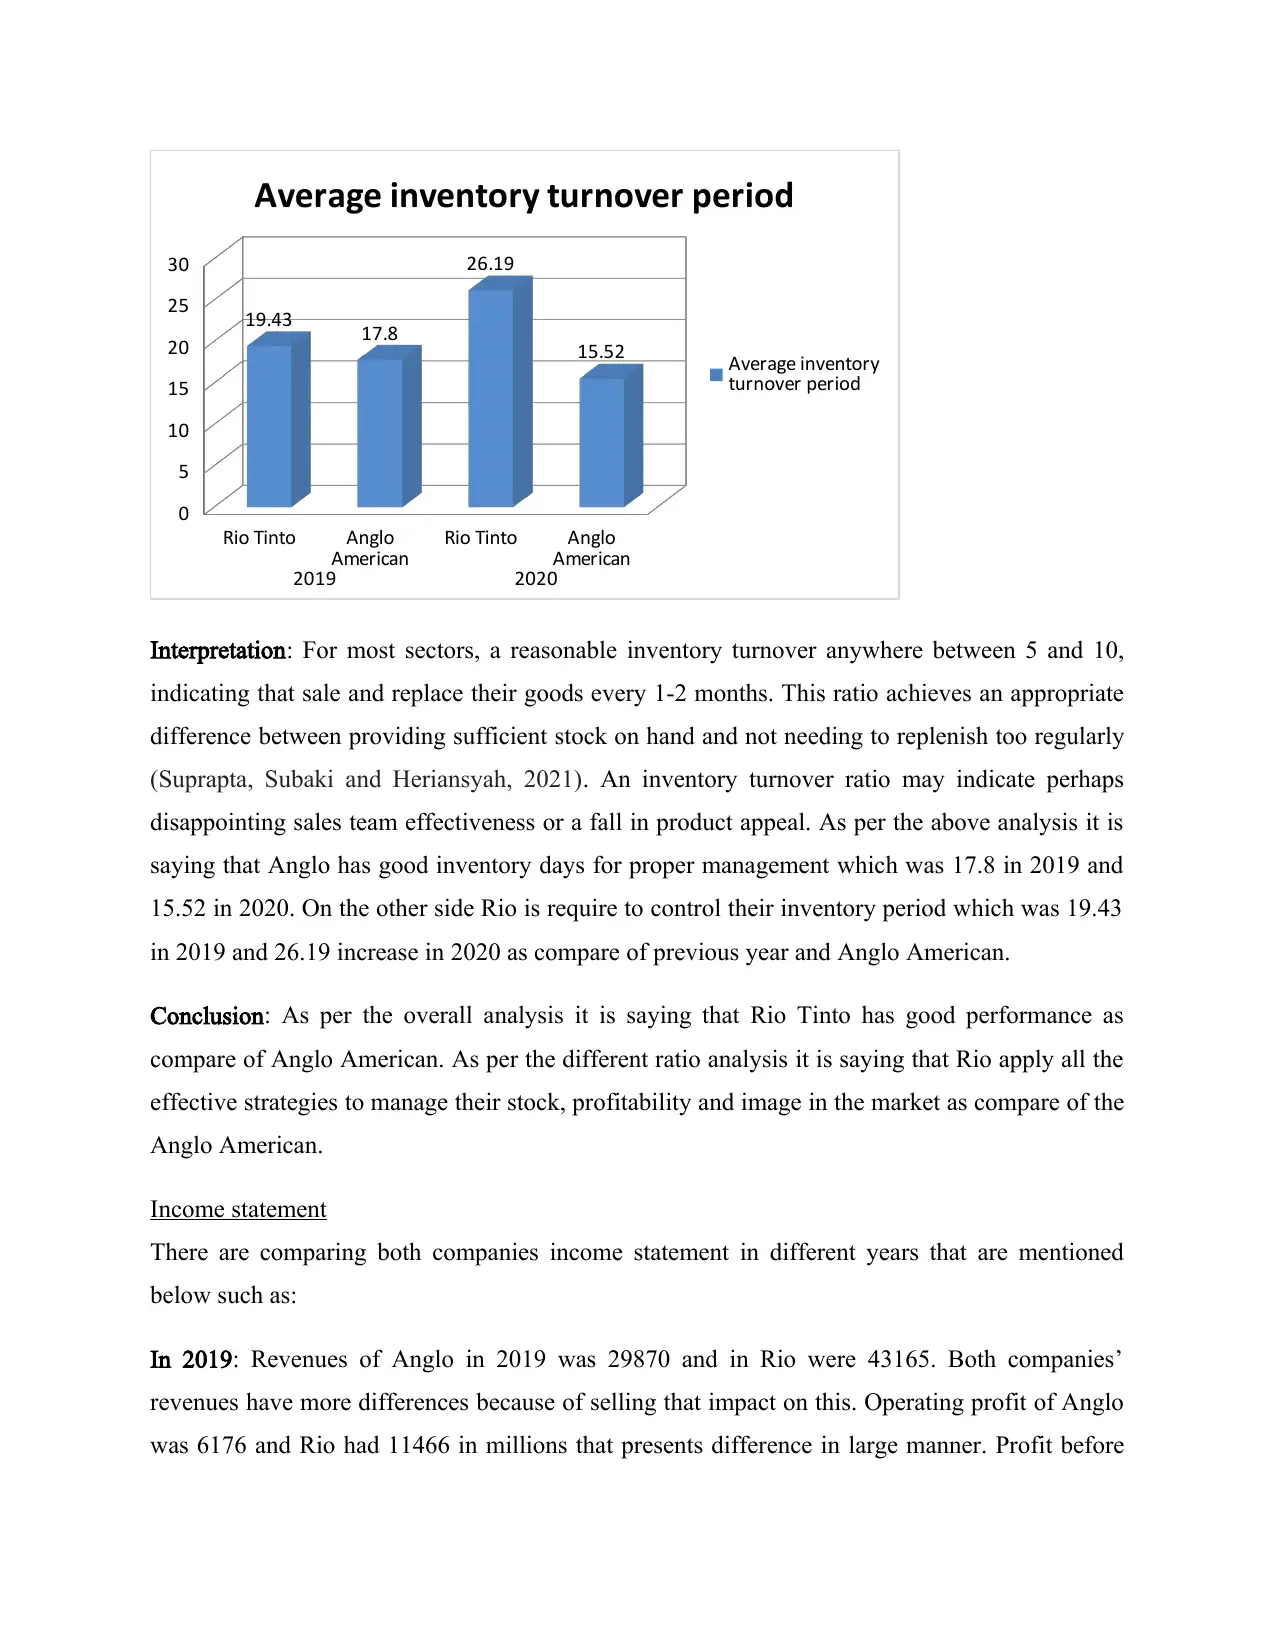
Interpretation: For most sectors, a reasonable inventory turnover anywhere between 5 and 10,
indicating that sale and replace their goods every 1-2 months. This ratio achieves an appropriate
difference between providing sufficient stock on hand and not needing to replenish too regularly
(Suprapta, Subaki and Heriansyah, 2021). An inventory turnover ratio may indicate perhaps
disappointing sales team effectiveness or a fall in product appeal. As per the above analysis it is
saying that Anglo has good inventory days for proper management which was 17.8 in 2019 and
15.52 in 2020. On the other side Rio is require to control their inventory period which was 19.43
in 2019 and 26.19 increase in 2020 as compare of previous year and Anglo American.
Conclusion: As per the overall analysis it is saying that Rio Tinto has good performance as
compare of Anglo American. As per the different ratio analysis it is saying that Rio apply all the
effective strategies to manage their stock, profitability and image in the market as compare of the
Anglo American.
Income statement
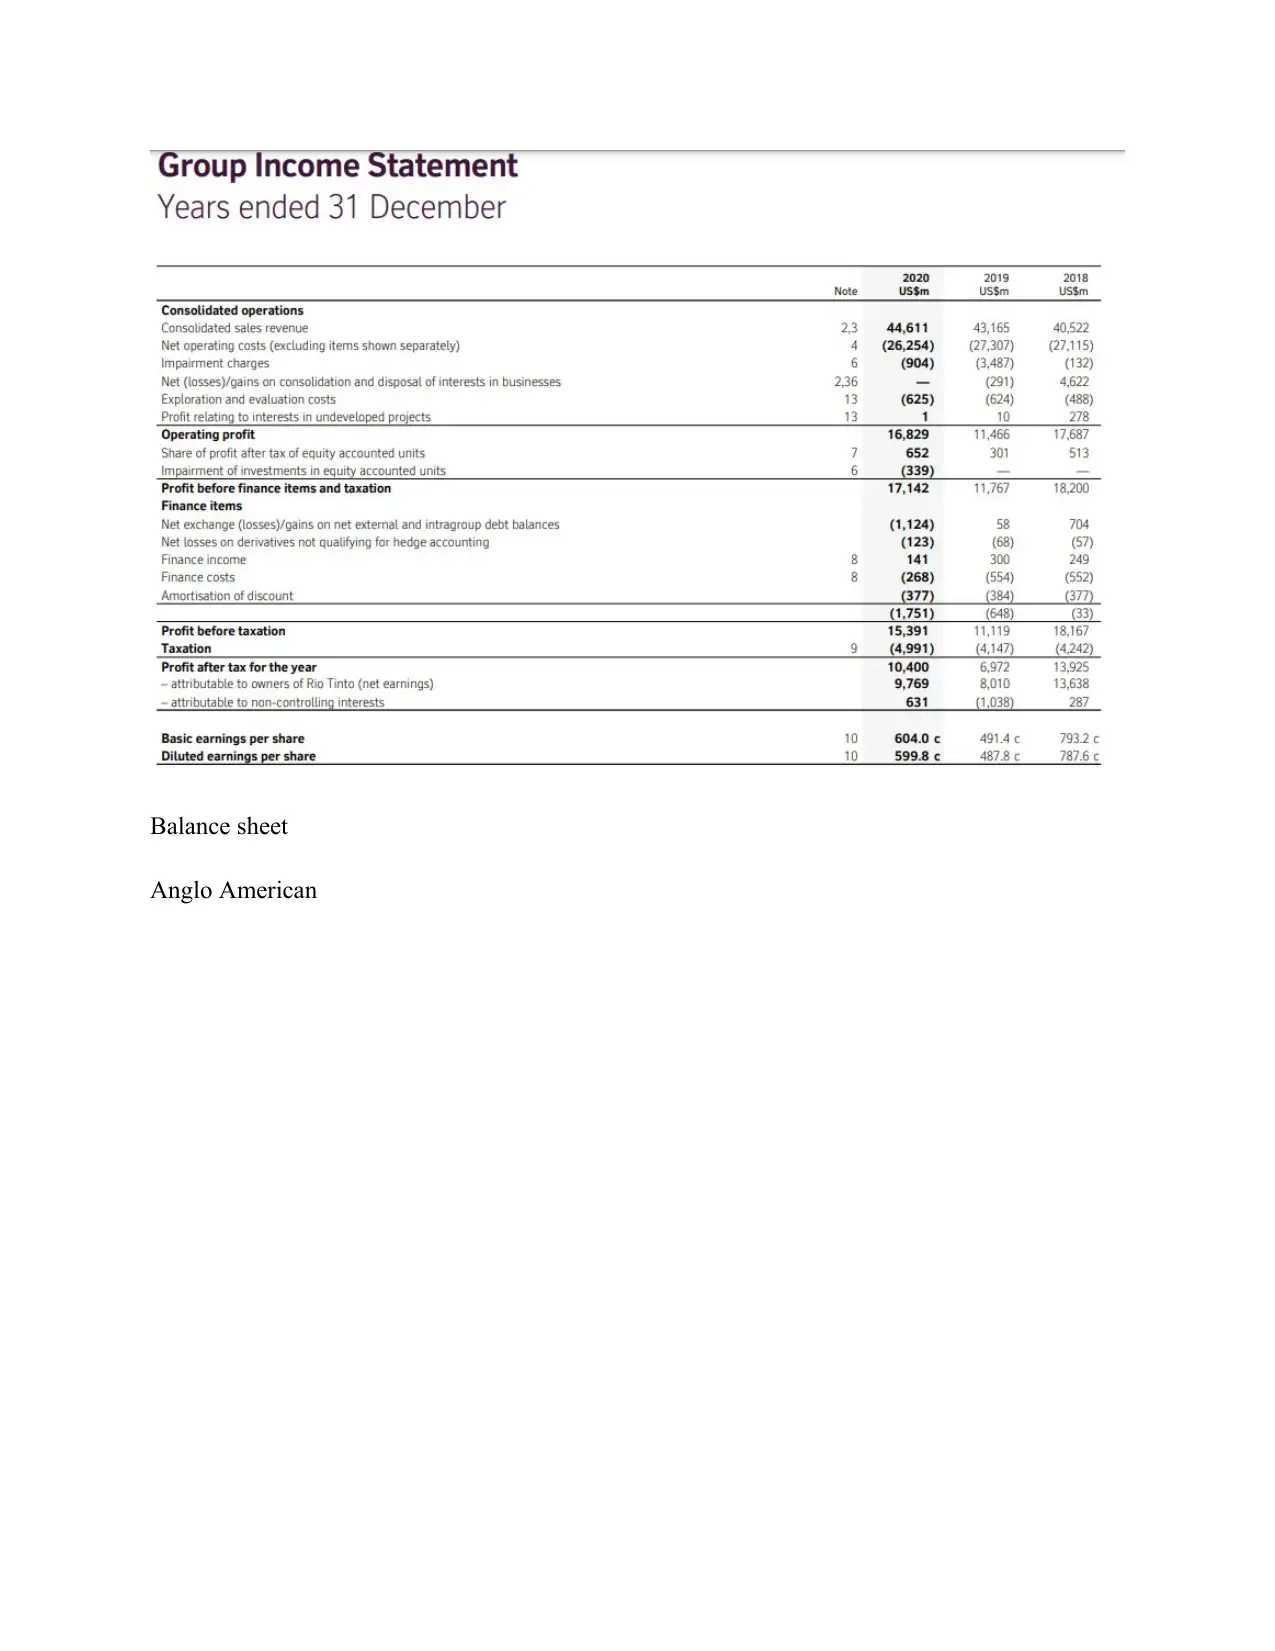
There are comparing both companies income statement in different years that are mentioned
below such as:
In 2019: Revenues of Anglo in 2019 was 29870 and in Rio were 43165. Both companies’
revenues have more differences because of selling that impact on this. Operating profit of Anglo
was 6176 and Rio had 11466 in millions that presents difference in large manner. Profit before
American Rio Tinto Anglo
American
2019 2020
0
5
10
15
20
25
30
19.43 17.8
26.19
15.52
Average inventory turnover period
Average inventory
turnover period
Interpretation: For most sectors, a reasonable inventory turnover anywhere between 5 and 10,
indicating that sale and replace their goods every 1-2 months. This ratio achieves an appropriate
difference between providing sufficient stock on hand and not needing to replenish too regularly
(Suprapta, Subaki and Heriansyah, 2021). An inventory turnover ratio may indicate perhaps
disappointing sales team effectiveness or a fall in product appeal. As per the above analysis it is
saying that Anglo has good inventory days for proper management which was 17.8 in 2019 and
15.52 in 2020. On the other side Rio is require to control their inventory period which was 19.43
in 2019 and 26.19 increase in 2020 as compare of previous year and Anglo American.
Conclusion: As per the overall analysis it is saying that Rio Tinto has good performance as
compare of Anglo American. As per the different ratio analysis it is saying that Rio apply all the
effective strategies to manage their stock, profitability and image in the market as compare of the
Anglo American.
Income statement
There are comparing both companies income statement in different years that are mentioned
below such as:
In 2019: Revenues of Anglo in 2019 was 29870 and in Rio were 43165. Both companies’
revenues have more differences because of selling that impact on this. Operating profit of Anglo
was 6176 and Rio had 11466 in millions that presents difference in large manner. Profit before
income and tax of the company present the performance that was 6572 of Anglo and 11767 of
Rio Tinto. Along with analysis the profit before taxation was 6146 of Anglo and 11119 of Rio in
the year of 2019. Profit after tax of different companies was 4582 of Anglo and 6972 of Rio
Tinto. Thus, from the overall analysis it is saying these amounts are showing differences in huge
manner which is presented that Rio Tinto has good performance in 2019 in compare of Anglo
American. It is saying that Anglo American require to prepare effective strategy to increase their
sales and income for following years.
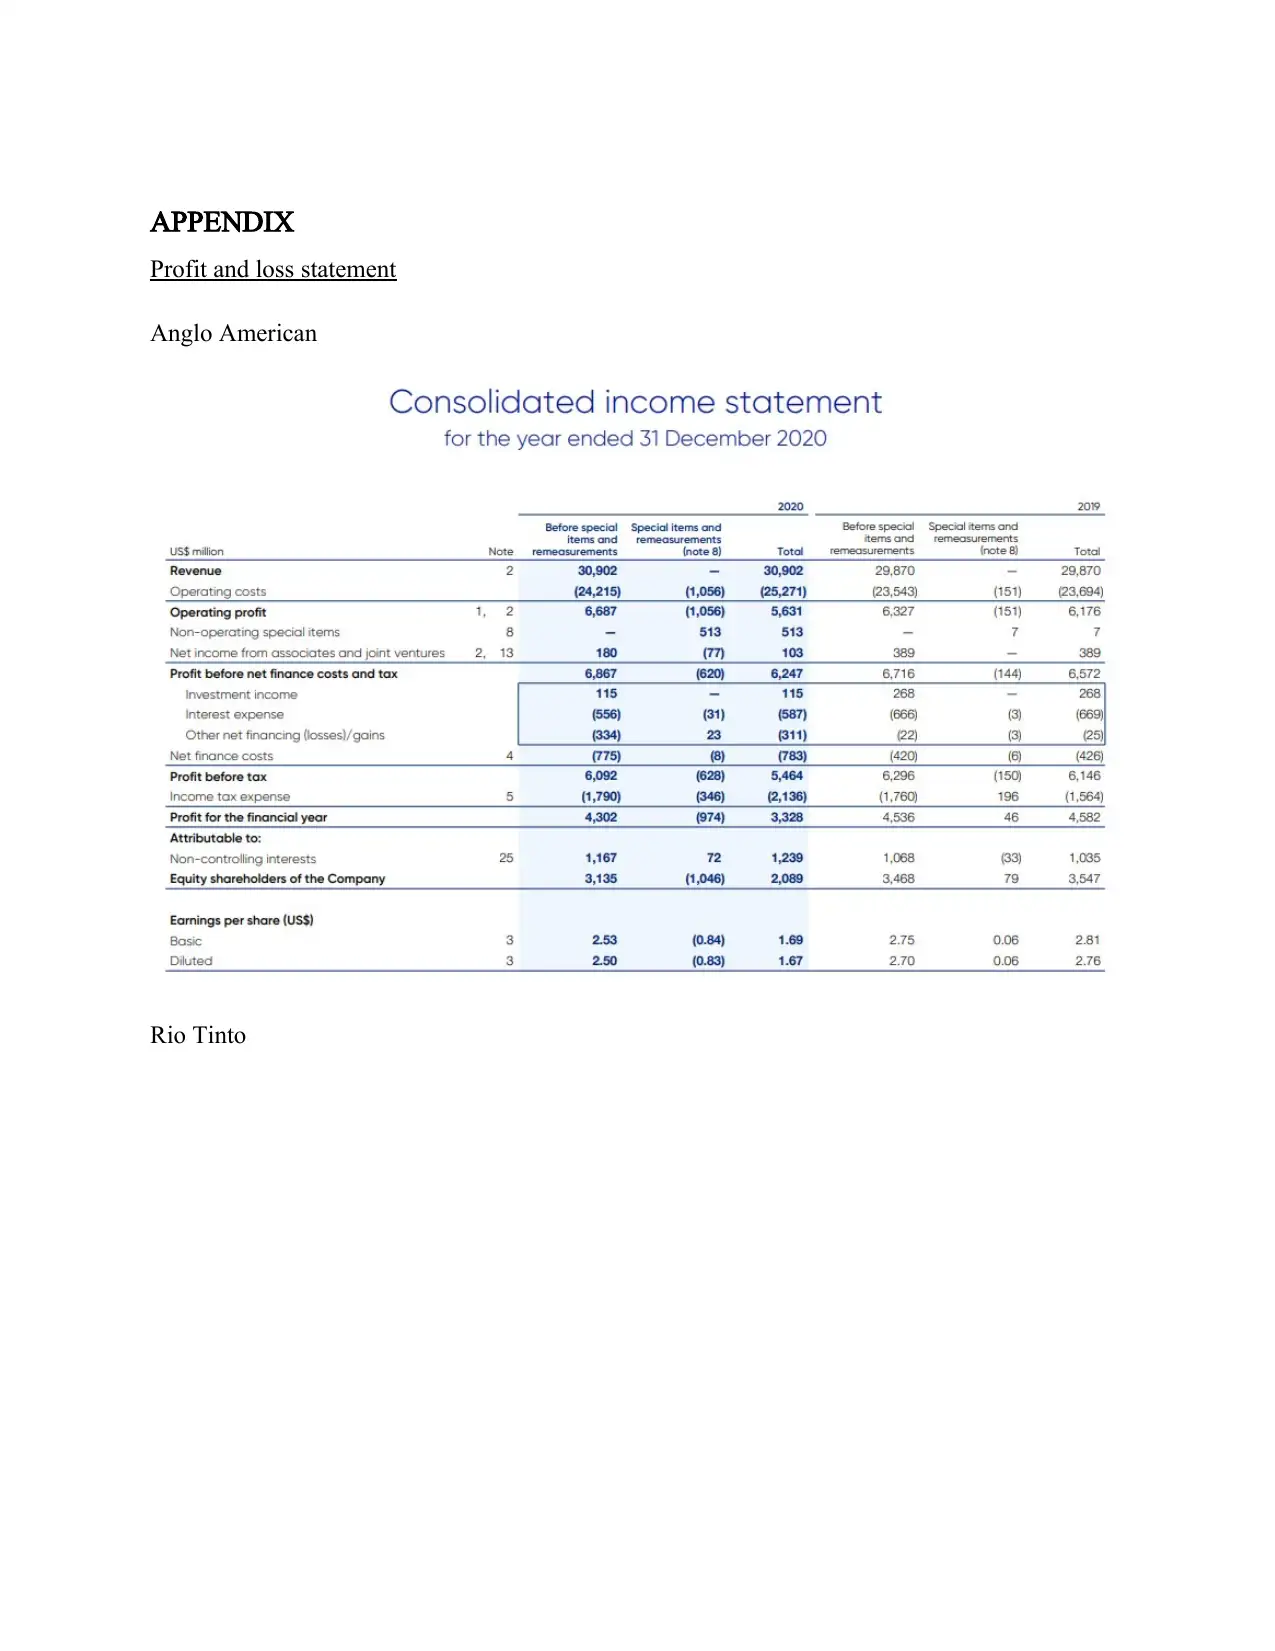
In 2020: In this year analyzing the performance of the both company by income statement.
Revenue of the companies 30902 of Anglo and 44611 of Rio in the year of 2020 in broad
manner. There are identified the differences in operating profit was 5631 of Anglo and 16829 of
Rio Tinto. After the operating profit less the expenses after that get profit before finance and
taxation was 6247 of Anglo and 17142 of Rio. From this profit less the taxation and get profit
before taxation was 5464 of Anglo American on the other side Rio Tinto had 15391. After that
less taxation from profit get net income which was 3328 of Anglo and 10400 of Rio Tinto. From
the overall analysis it understands that Rio Tinto has good performance as compare of Anglo
American.
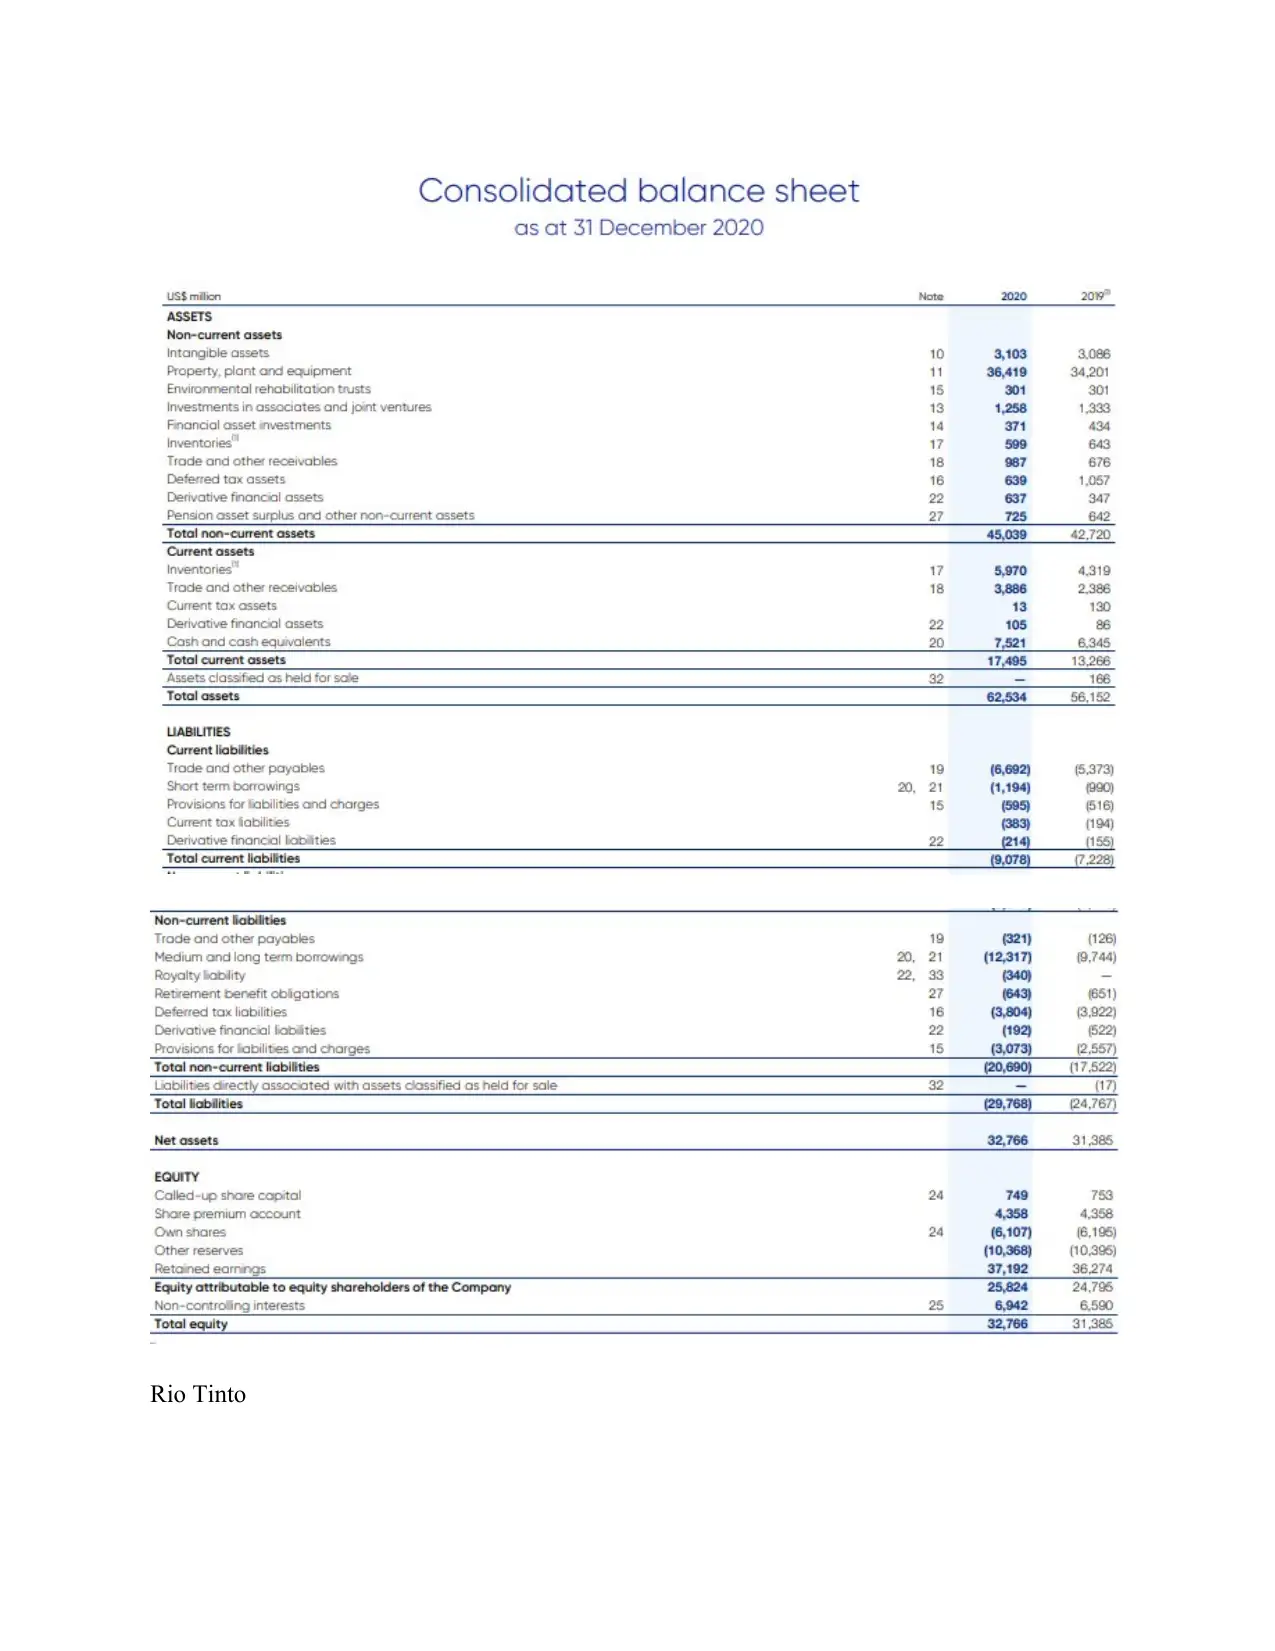
Balance sheet
A balance sheet provides report that provided insight on a firm's profits, revenue, and the
investment made by its shareholders. In basic terms, a balance sheet of a firm is designed to
show just how much group has made, how much it has expended from the revenues, how much
was remaining, and whether or not they have spend greater than they would have generated.
There are comparison of both company of Anglo American and Rio Tinto in the year 2019 and
2020 such as:
In 2019: At the assets side categorized into two parts current and non-current assets. Non-current
assets of company were 42720 of Anglo American and 70499 in the 2019. Current assets of
Anglo were 13266 and 17033 of Rio Tinto. After that sum both the assets and get total assets
was of both company were 56152 of Anglo American and 87802 of Rio. On the other side,
liabilities of the company were current liability 7228 of Anglo and 11125 of Rio. After that
calculate non-current liabilities was 17522 of Anglo and 31435 of Rio. There are total liabilities
of company was 24767 of Anglo and 42560 of Rio. Total equity of Anglo was 31385 and 45242
Rio Tinto. Along with analysis the profit before taxation was 6146 of Anglo and 11119 of Rio in
the year of 2019. Profit after tax of different companies was 4582 of Anglo and 6972 of Rio
Tinto. Thus, from the overall analysis it is saying these amounts are showing differences in huge
manner which is presented that Rio Tinto has good performance in 2019 in compare of Anglo
American. It is saying that Anglo American require to prepare effective strategy to increase their
sales and income for following years.
In 2020: In this year analyzing the performance of the both company by income statement.
Revenue of the companies 30902 of Anglo and 44611 of Rio in the year of 2020 in broad
manner. There are identified the differences in operating profit was 5631 of Anglo and 16829 of
Rio Tinto. After the operating profit less the expenses after that get profit before finance and
taxation was 6247 of Anglo and 17142 of Rio. From this profit less the taxation and get profit
before taxation was 5464 of Anglo American on the other side Rio Tinto had 15391. After that
less taxation from profit get net income which was 3328 of Anglo and 10400 of Rio Tinto. From
the overall analysis it understands that Rio Tinto has good performance as compare of Anglo
American.
Balance sheet
A balance sheet provides report that provided insight on a firm's profits, revenue, and the
investment made by its shareholders. In basic terms, a balance sheet of a firm is designed to
show just how much group has made, how much it has expended from the revenues, how much
was remaining, and whether or not they have spend greater than they would have generated.
There are comparison of both company of Anglo American and Rio Tinto in the year 2019 and
2020 such as:
In 2019: At the assets side categorized into two parts current and non-current assets. Non-current
assets of company were 42720 of Anglo American and 70499 in the 2019. Current assets of
Anglo were 13266 and 17033 of Rio Tinto. After that sum both the assets and get total assets
was of both company were 56152 of Anglo American and 87802 of Rio. On the other side,
liabilities of the company were current liability 7228 of Anglo and 11125 of Rio. After that
calculate non-current liabilities was 17522 of Anglo and 31435 of Rio. There are total liabilities
of company was 24767 of Anglo and 42560 of Rio. Total equity of Anglo was 31385 and 45242
of Rio. As per the overall analysis it is saying that Rio Tinto has effective financial position in
the year of 2019.
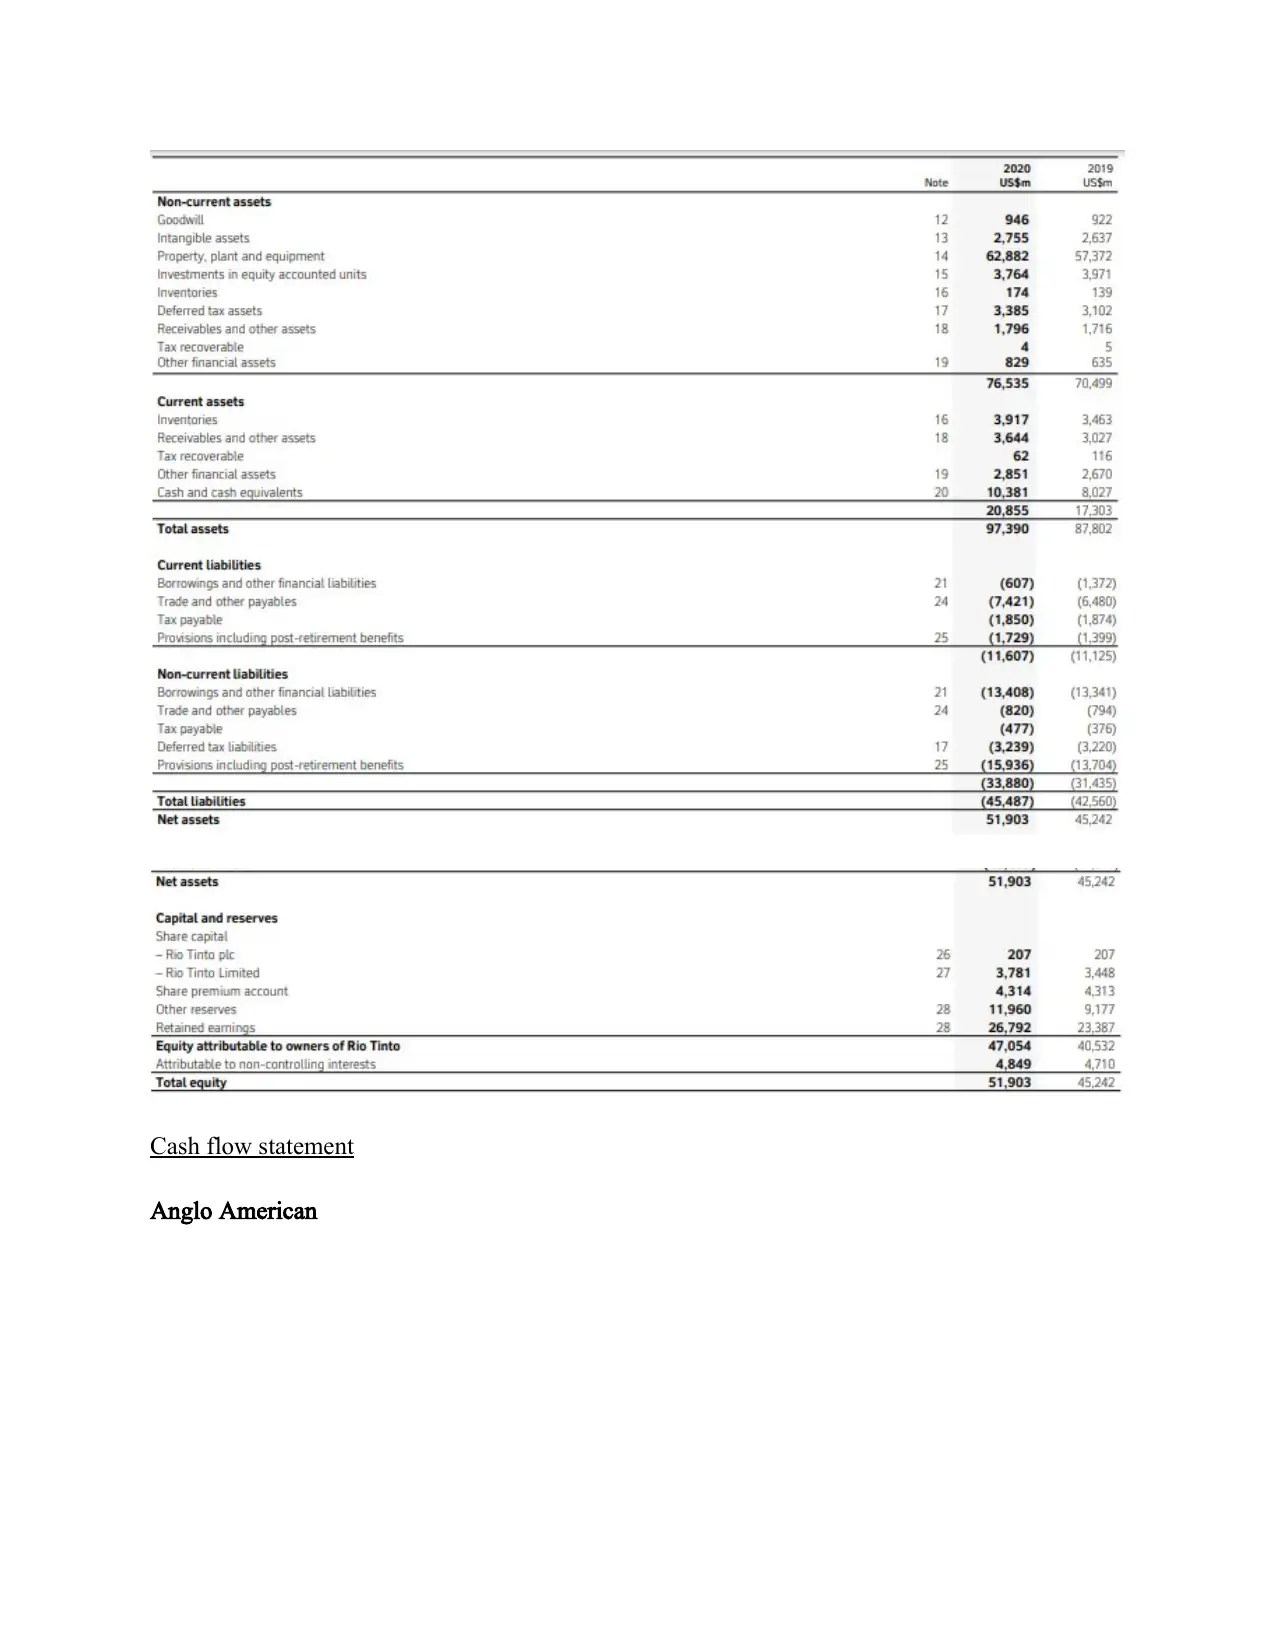
In 2020: In this year analyzing both companies balance sheet to compare the performance of
both companies. Non-current asset of company 45039 of Anglo and 76535 of Rio identified in
year of 2020. There are analyzing the current assets of both companies was 17945 of Anglo and
20855 of Rio after that total assets of company was 17945 of Anglo and 97390 of Rio. At the
other extreme liabilities and equity present the liquidity position of company which was helping
to know accurate position. Non-current liabilities identified of Anglo were 20690 and current
liabilities were 9078 of Anglo. After those total liabilities of 45487 of Rio and 29768 of Anglo
that presents the performance of Rio is good as compare of Anglo.
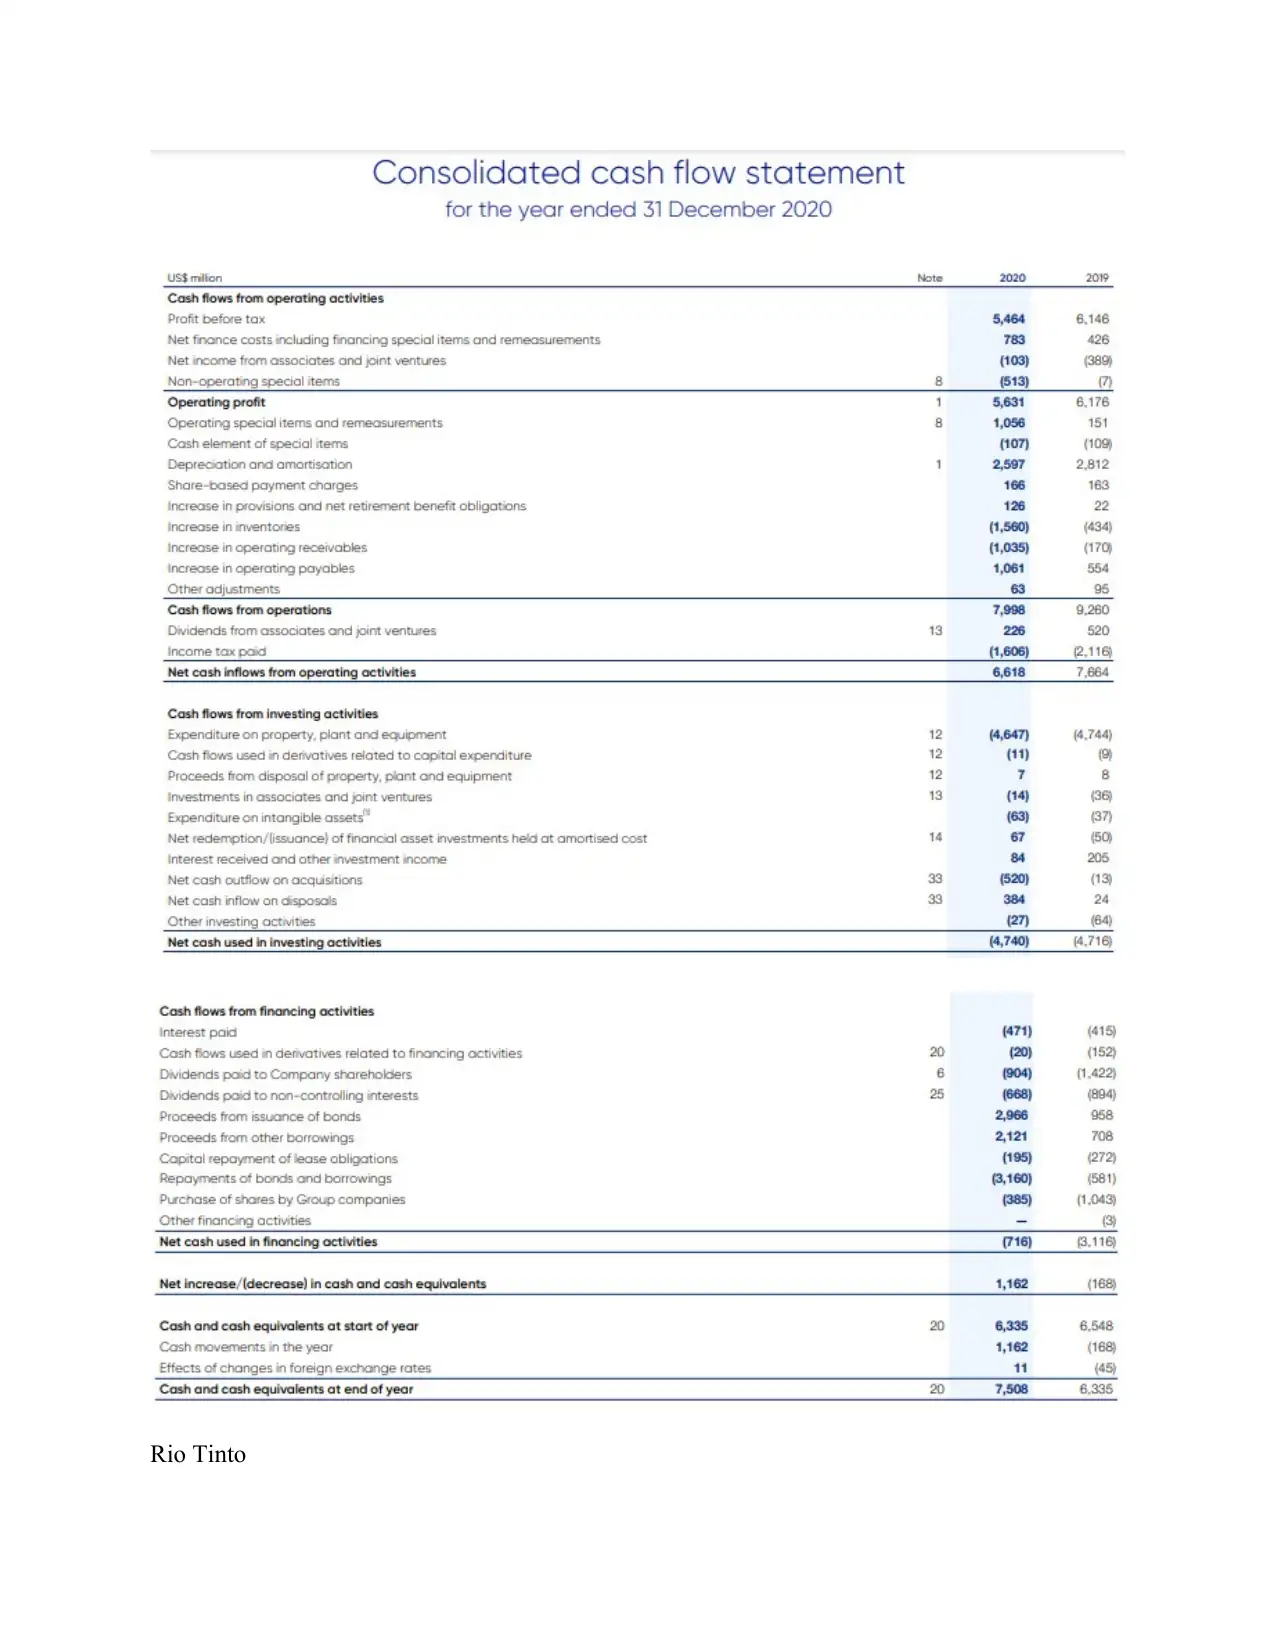
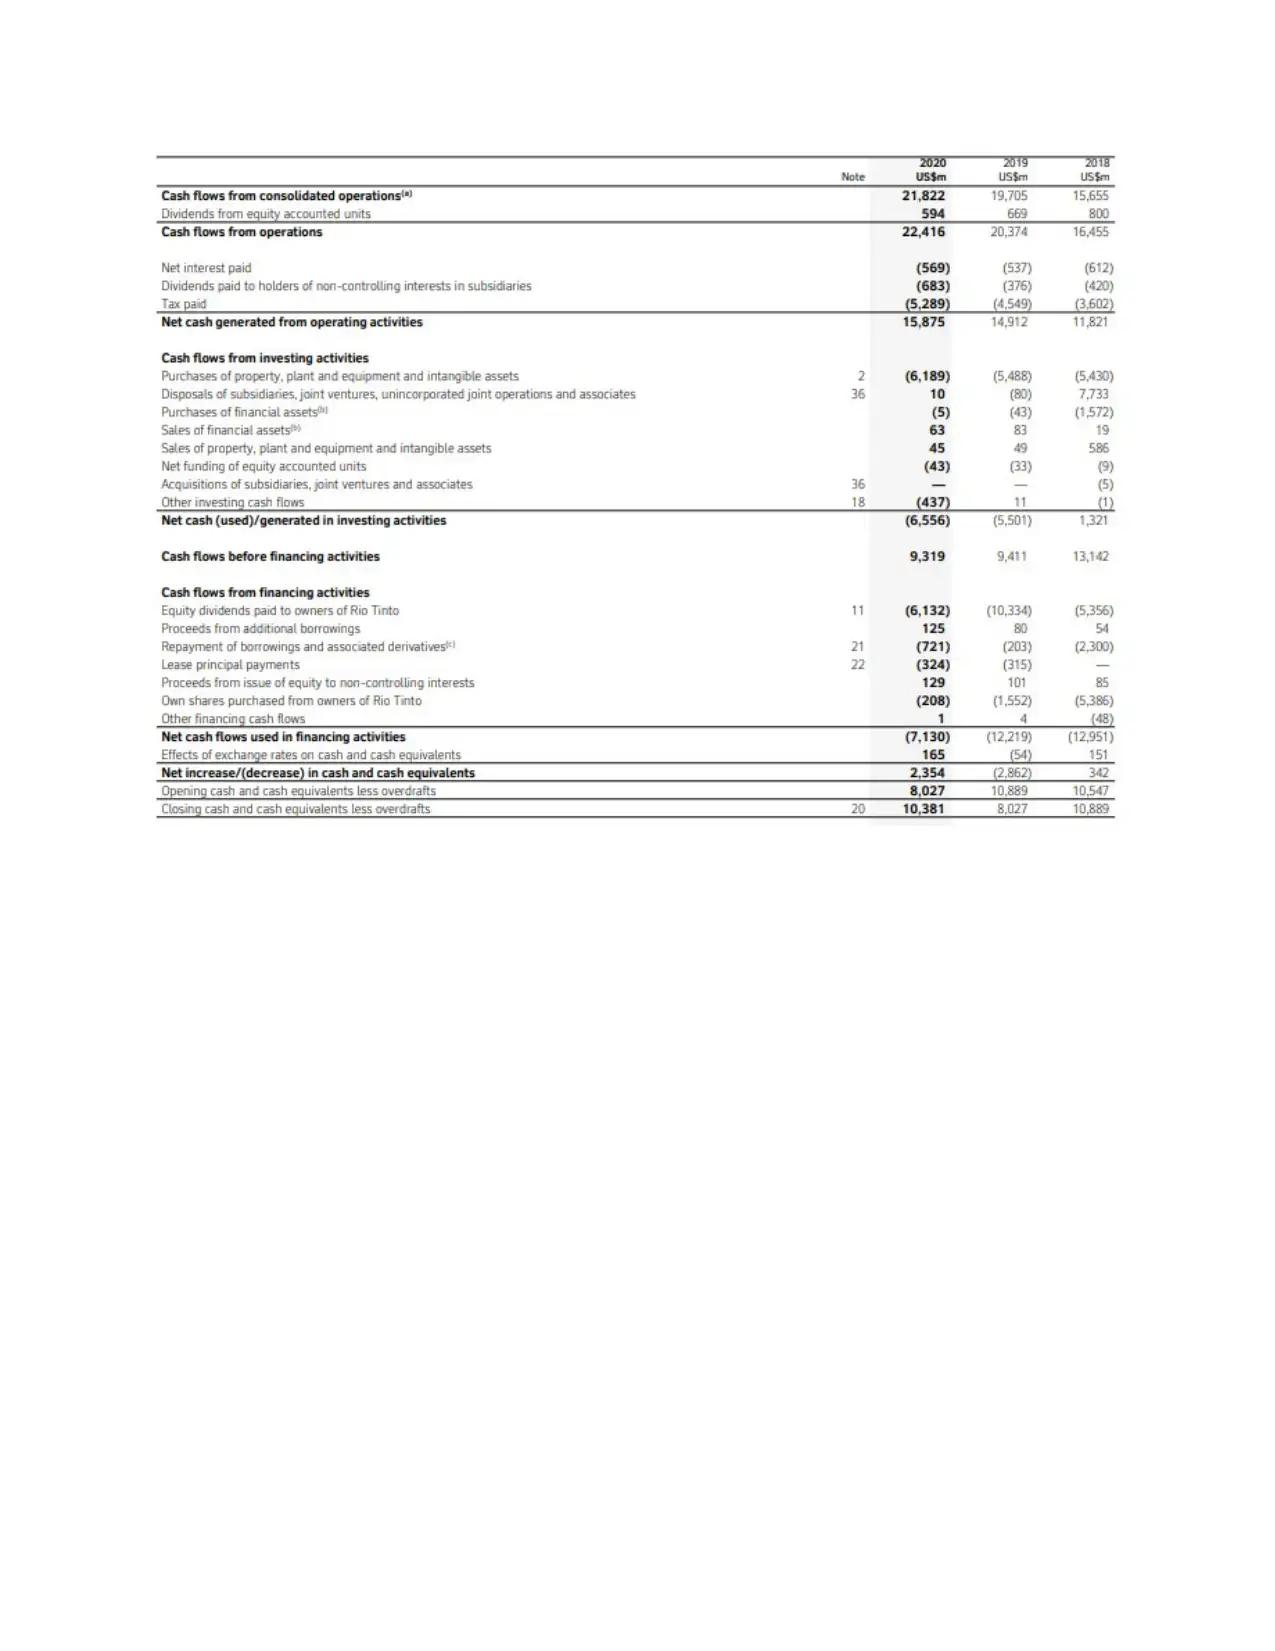
Cash flow statement
There are analyzing both company’s cash flow statement to analysis the cash inflow and outflow
in business in the year of 2019 & 2020. With the help of this statement compare the performance
of both company and take decision which company is best in same sector these companies are
Anglo American and Rio Tinto.
In 2019: The cash flow statement of company categories in three activities, operation, investment
and financing activities. As per the Anglo American statement identify the cash flow from
operations was 9260 after that less amount of tax and get net cash inflow from operating
activities which as 7664. On the other side of Rio Tinto 20374 of cash flow from operation but
after tax deduction remaining amount was 14912. As per investing activities 4716 in Anglo and
5501 in Rio which helps to analysis of investment position of company. At the end analysis of
financing activities was 3116 in Anglo and 12219 in Rio Tinto. Thus, from the analysis it is
saying that Rio Tinto use cash for different activities in compare of the Anglo. It means liquidity
position of Rio is good but require to control in proper manner.
In 2020: In this year analysis the statement of both companies in order to assess the performance
in effective manner. Cash flow from operational activities was 6618 of Anglo American and
15875 of Rio Tinto. Along with analysis the investing activities of Anglo was 4740 that was
compare with Rio which was 6556. At the end assess the cash flow from financing activities of
Anglo was 716 and 7130 of Rio. From the overall assessment it is saying that Rio has good cash
the year of 2019.
In 2020: In this year analyzing both companies balance sheet to compare the performance of
both companies. Non-current asset of company 45039 of Anglo and 76535 of Rio identified in
year of 2020. There are analyzing the current assets of both companies was 17945 of Anglo and
20855 of Rio after that total assets of company was 17945 of Anglo and 97390 of Rio. At the
other extreme liabilities and equity present the liquidity position of company which was helping
to know accurate position. Non-current liabilities identified of Anglo were 20690 and current
liabilities were 9078 of Anglo. After those total liabilities of 45487 of Rio and 29768 of Anglo
that presents the performance of Rio is good as compare of Anglo.
Cash flow statement
There are analyzing both company’s cash flow statement to analysis the cash inflow and outflow
in business in the year of 2019 & 2020. With the help of this statement compare the performance
of both company and take decision which company is best in same sector these companies are
Anglo American and Rio Tinto.
In 2019: The cash flow statement of company categories in three activities, operation, investment
and financing activities. As per the Anglo American statement identify the cash flow from
operations was 9260 after that less amount of tax and get net cash inflow from operating
activities which as 7664. On the other side of Rio Tinto 20374 of cash flow from operation but
after tax deduction remaining amount was 14912. As per investing activities 4716 in Anglo and
5501 in Rio which helps to analysis of investment position of company. At the end analysis of
financing activities was 3116 in Anglo and 12219 in Rio Tinto. Thus, from the analysis it is
saying that Rio Tinto use cash for different activities in compare of the Anglo. It means liquidity
position of Rio is good but require to control in proper manner.
In 2020: In this year analysis the statement of both companies in order to assess the performance
in effective manner. Cash flow from operational activities was 6618 of Anglo American and
15875 of Rio Tinto. Along with analysis the investing activities of Anglo was 4740 that was
compare with Rio which was 6556. At the end assess the cash flow from financing activities of
Anglo was 716 and 7130 of Rio. From the overall assessment it is saying that Rio has good cash
Secure Best Marks with AI Grader
Need help grading? Try our AI Grader for instant feedback on your assignments.
flow to manage different business activities in proper manner but Anglo has not good cash flow
performance. It is saying that company has not effective performance of Anglo in compare of
Rio Tinto.
Comparison on basis of profit
Big mining corporations are likely to post massive profits in 2021 as a result of the
commodity boom fueled by attempt to retrieve from the COVID-19 epidemic and the rebuilding
of markets across the world (Wahyuningsih and et.al, 2021).
Anglo American posted the biggest half-year earnings in the company's 104-year record on July
29 and said it will repay $4.1 billion in dividends.
Rio Tinto announced its greatest interim earnings on July 28 and that it will distribute $9.1
billion to shareholders.
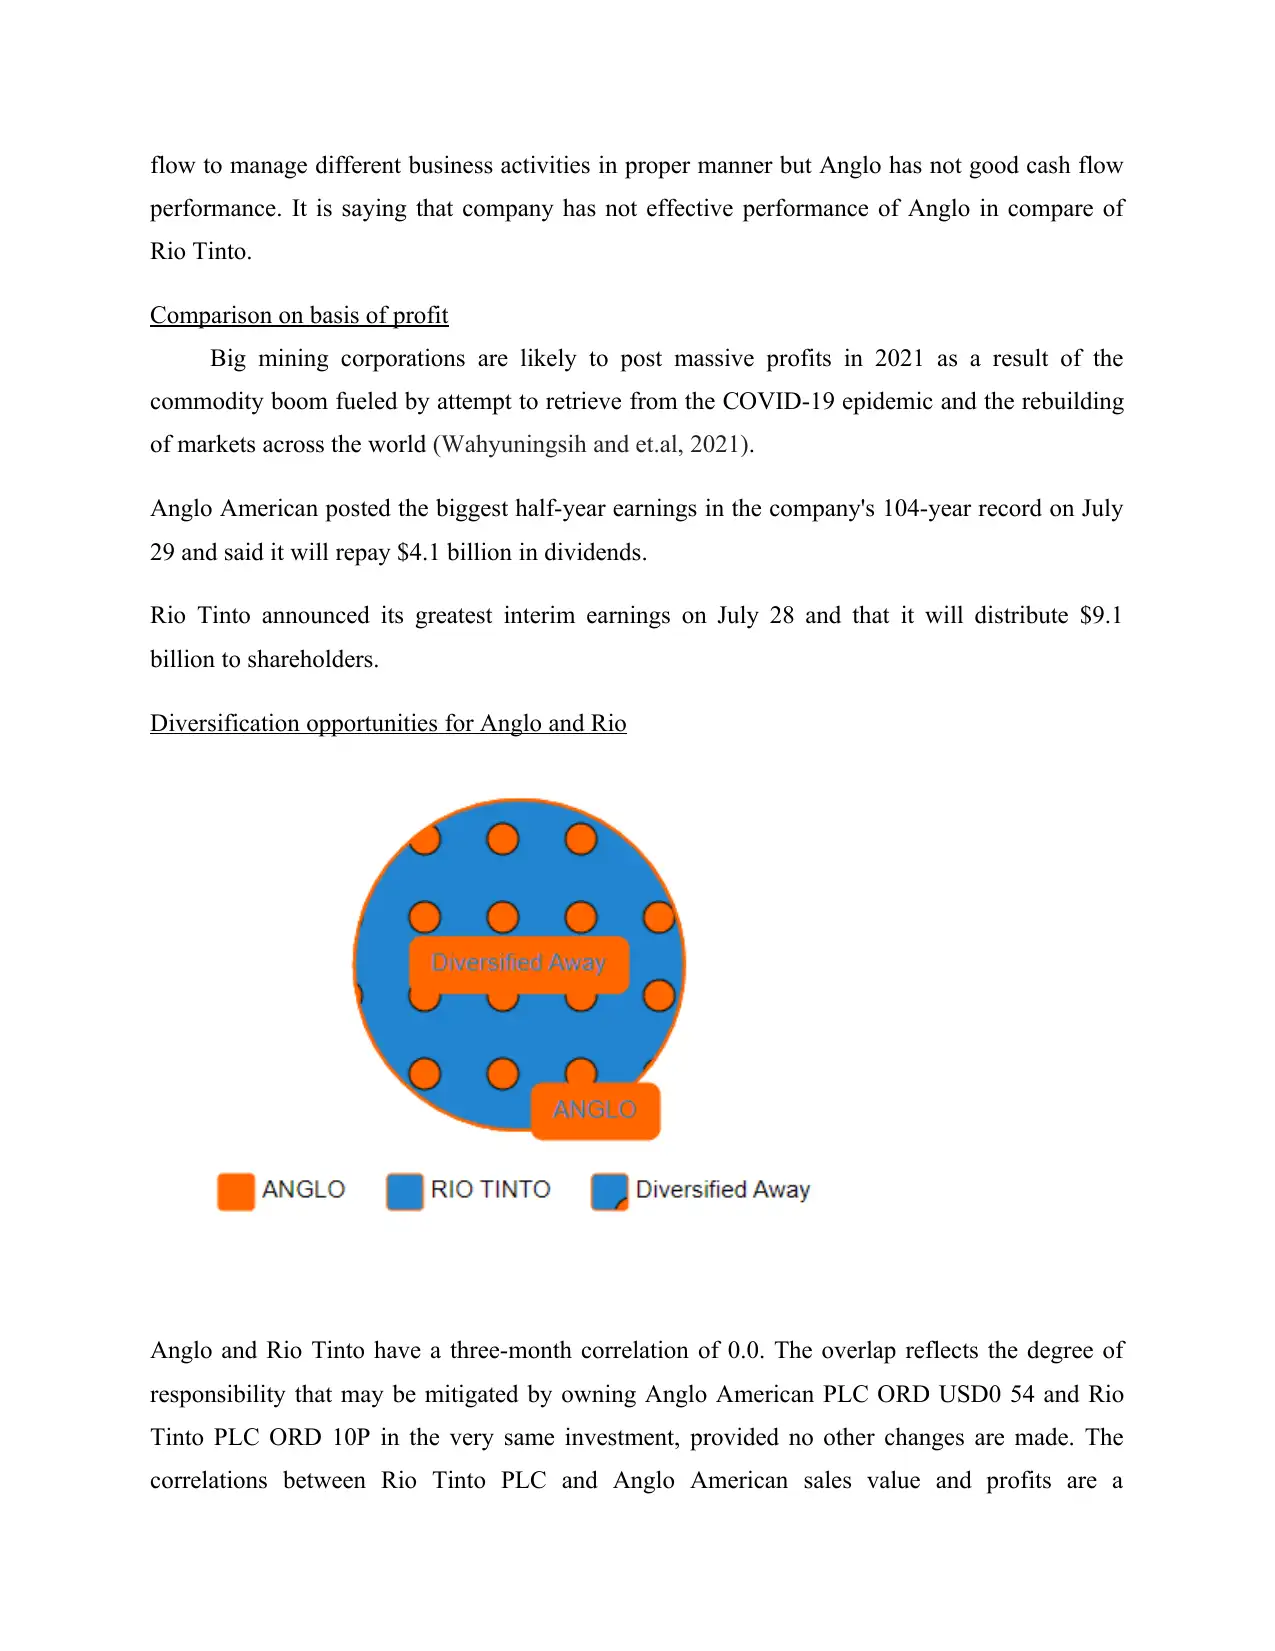
Diversification opportunities for Anglo and Rio
Anglo and Rio Tinto have a three-month correlation of 0.0. The overlap reflects the degree of
responsibility that may be mitigated by owning Anglo American PLC ORD USD0 54 and Rio
Tinto PLC ORD 10P in the very same investment, provided no other changes are made. The
correlations between Rio Tinto PLC and Anglo American sales value and profits are a
performance. It is saying that company has not effective performance of Anglo in compare of
Rio Tinto.
Comparison on basis of profit
Big mining corporations are likely to post massive profits in 2021 as a result of the
commodity boom fueled by attempt to retrieve from the COVID-19 epidemic and the rebuilding
of markets across the world (Wahyuningsih and et.al, 2021).
Anglo American posted the biggest half-year earnings in the company's 104-year record on July
29 and said it will repay $4.1 billion in dividends.
Rio Tinto announced its greatest interim earnings on July 28 and that it will distribute $9.1
billion to shareholders.
Diversification opportunities for Anglo and Rio
Anglo and Rio Tinto have a three-month correlation of 0.0. The overlap reflects the degree of
responsibility that may be mitigated by owning Anglo American PLC ORD USD0 54 and Rio
Tinto PLC ORD 10P in the very same investment, provided no other changes are made. The
correlations between Rio Tinto PLC and Anglo American sales value and profits are a
quantitative measure of the extent to which both ordinary shares typically move concurrently.
The coefficient of correlation quantifies the degree to which Anglo American PLC results are
tied (or linked) with RIO TINTO. The coefficient value has values ranging from -1 to +1. The
connection of zero (0) is achievable when the price action of Rio Tinto PLC has no impact on the
course of Anglo, i.e., Anglo American and Rio Tinto travel vertically and horizontally totally
arbitrarily (Cho and Choi, 2021).
CONCLUSION
As per the above study it has been concluded that Rio Tinto has effective performance in both
year of 2019 & 2020 as compare of Anglo American in mining industry. Both companies make
effort to get leading position but Rio apply effective strategies to make their position in this
industry. To analysis comparison on both companies use financial ratios for two years that
present effective performance of Rio Tinto. Along with interpret cash flow statement, income
statement and balance sheet for 2019 & 2020.
REFERENCES
Books and Journal
Poorhassan, S., 2020. Information technology for project cost management (Case study: Soufian
cement co, iran).
International Journal of Finance & Managerial Accounting. 4(16).
pp.39-49.
Janie, D. N. A. and et.al, 2020. The implementation of Indonesian Accounting Standards for
Micro, Small and Medium Entities.
Humanities & Social Sciences Reviews. 8(1). pp.383-
388.
Korhonen, T. and et.al, 2020. Exploring the programmability of management accounting work
for increasing automation: an interventionist case study.
Accounting, Auditing &
Accountability Journal.
Windisch, D., 2021. Enforcement, managerial discretion, and the informativeness of
accruals.
European Accounting Review. 30(4). pp.705-732.
Salehi, M. and et.al, 2020. The potential impact of managerial entrenchment on firms’ corporate
social responsibility activities and financial performance: evidence from
Iran.
International Journal of Productivity and Performance Management.
Huber, M. M. and et.al, 2020. Improving accounting student writing skills using writing
circles.
Journal of Accounting Education. 53. p.100694.
Taschner, A. and Charifzadeh, M., 2020. Management accounting in supply chains–what we
know and what we teach.
Journal of Accounting & Organizational Change.
Hidayat, H., 2020. The Academic Cheating Behavior Reviewed From Neutralization of Cheating
Behavior and Gender of the Accounting Students at Universities in Batam.
Journal of
Applied Managerial Accounting. 2(2). pp.154-161.
Andiola, L. M., Masters, E. and Norman, C., 2020. Integrating technology and data analytic
skills into the accounting curriculum: Accounting department leaders’ experiences and
insights.
Journal of Accounting Education. 50. p.100655.
Ritsri, U. and Meeprom, S., 2020. Does knowledge management practice produce accounting
employee productivity in the tourism business in Thailand?.
Anatolia. 31(1). pp.99-110.
Zareie, A., Darabi, R. and Najafimoghadam, A., 2022. Proposing a model for assessing Herding
behavior in the Iranian capital market using meta-heuristic algorithms.
International
Journal of Finance & Managerial Accounting. 6(24). pp.13-30.
Macellari, M. and et.al, 2021. Exploring bluewashing practices of alleged sustainability leaders
through a counter-accounting analysis.
Environmental Impact Assessment Review. 86.
p.106489.
Shehata, N. and et.al, 2020. Incorporating Nearpod in undergraduate financial accounting classes
in Egypt.
Accounting Education. 29(2). pp.137-152.
Paraphrase This Document
Need a fresh take? Get an instant paraphrase of this document with our AI Paraphraser
Suprapta, E. G., Subaki, A. and Heriansyah, D., 2021. Pengaruh Return On Asset, Net Profit
Margin, Debt To Equity Ratio, Current Ratio, dan Price To Book Value Terhadap Harga
Saham Perusahaan Manufaktur Sub Sektor Otomotif Dan Komponen Di Bursa Efek
Indonesia.
JOURNAL OF APPLIED MANAGERIAL ACCOUNTING. 5(1). pp.124-
134.
Cho, H. and Choi, G. Y., 2021. Managerial ability and revenue-expense matching: accrual
estimation versus real business decision.
Asia-Pacific Journal of Accounting &
Economics, pp.1-16.
Wahyuningsih, D. and et.al, 2021. Why dynamic capacity influences the quality of management
accounting Information systems in the public sector?.
International Journal of
Psychosocial Rehabilitation. 24(10). p.2020.
APPENDIX
Profit and loss statement
Anglo American
Rio Tinto
Profit and loss statement
Anglo American
Rio Tinto
Balance sheet
Anglo American
Anglo American
Secure Best Marks with AI Grader
Need help grading? Try our AI Grader for instant feedback on your assignments.
Rio Tinto
Cash flow statement
Anglo American
Anglo American
Rio Tinto
Paraphrase This Document
Need a fresh take? Get an instant paraphrase of this document with our AI Paraphraser
1 out of 26
Related Documents


Your All-in-One AI-Powered Toolkit for Academic Success.
+13062052269
info@desklib.com
Available 24*7 on WhatsApp / Email
![[object Object]](/_next/static/media/star-bottom.7253800d.svg)
Unlock your academic potential
© 2024 | Zucol Services PVT LTD | All rights reserved.