Managerial Economics: Demand and Supply Analysis
Added on 2023-06-07
15 Pages3841 Words256 Views
1
MANAGERIAL ECONOMICS
MANAGERIAL ECONOMICS
2
Table of contents
1.0 Section A..............................................................................................................................3
1.1 Question number 1...............................................................................................................3
1.2 Question number 2...............................................................................................................6
1.3 Question number 3...............................................................................................................7
1.4 Question number 4...............................................................................................................8
1.5 Question number 5...............................................................................................................8
2.0 Section B..............................................................................................................................9
2.1 Question number 1...............................................................................................................9
2.2 Question number 2.............................................................................................................10
Reference..................................................................................................................................13
3
1.0 Section A
1.1 Question number 1
a)
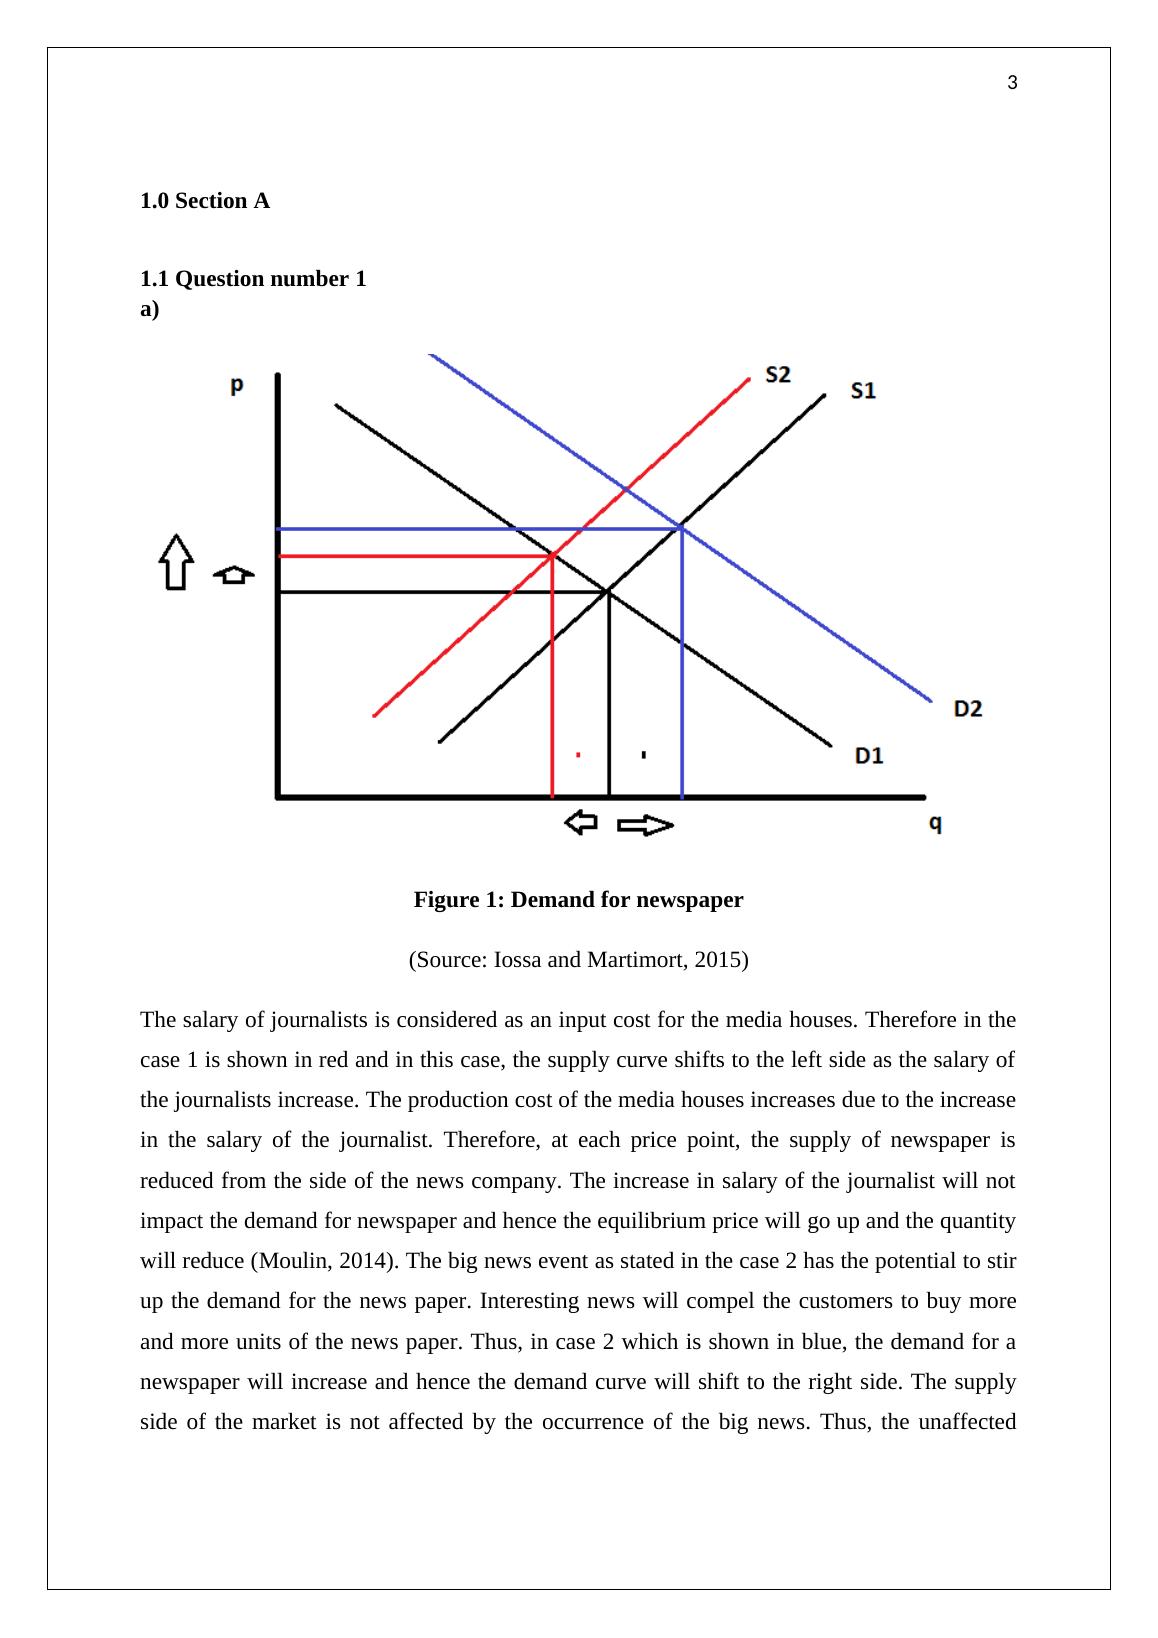
Figure 1: Demand for newspaper
(Source: Iossa and Martimort, 2015)
The salary of journalists is considered as an input cost for the media houses. Therefore in the
case 1 is shown in red and in this case, the supply curve shifts to the left side as the salary of
the journalists increase. The production cost of the media houses increases due to the increase
in the salary of the journalist. Therefore, at each price point, the supply of newspaper is
reduced from the side of the news company. The increase in salary of the journalist will not
impact the demand for newspaper and hence the equilibrium price will go up and the quantity
will reduce (Moulin, 2014). The big news event as stated in the case 2 has the potential to stir
up the demand for the news paper. Interesting news will compel the customers to buy more
and more units of the news paper. Thus, in case 2 which is shown in blue, the demand for a
newspaper will increase and hence the demand curve will shift to the right side. The supply
side of the market is not affected by the occurrence of the big news. Thus, the unaffected
1.0 Section A
1.1 Question number 1
a)
Figure 1: Demand for newspaper
(Source: Iossa and Martimort, 2015)
The salary of journalists is considered as an input cost for the media houses. Therefore in the
case 1 is shown in red and in this case, the supply curve shifts to the left side as the salary of
the journalists increase. The production cost of the media houses increases due to the increase
in the salary of the journalist. Therefore, at each price point, the supply of newspaper is
reduced from the side of the news company. The increase in salary of the journalist will not
impact the demand for newspaper and hence the equilibrium price will go up and the quantity
will reduce (Moulin, 2014). The big news event as stated in the case 2 has the potential to stir
up the demand for the news paper. Interesting news will compel the customers to buy more
and more units of the news paper. Thus, in case 2 which is shown in blue, the demand for a
newspaper will increase and hence the demand curve will shift to the right side. The supply
side of the market is not affected by the occurrence of the big news. Thus, the unaffected
4
supply curve and the rightward movement of the demand curve will provide equilibrium
higher prices and higher quantity sold of the news paper.
b)
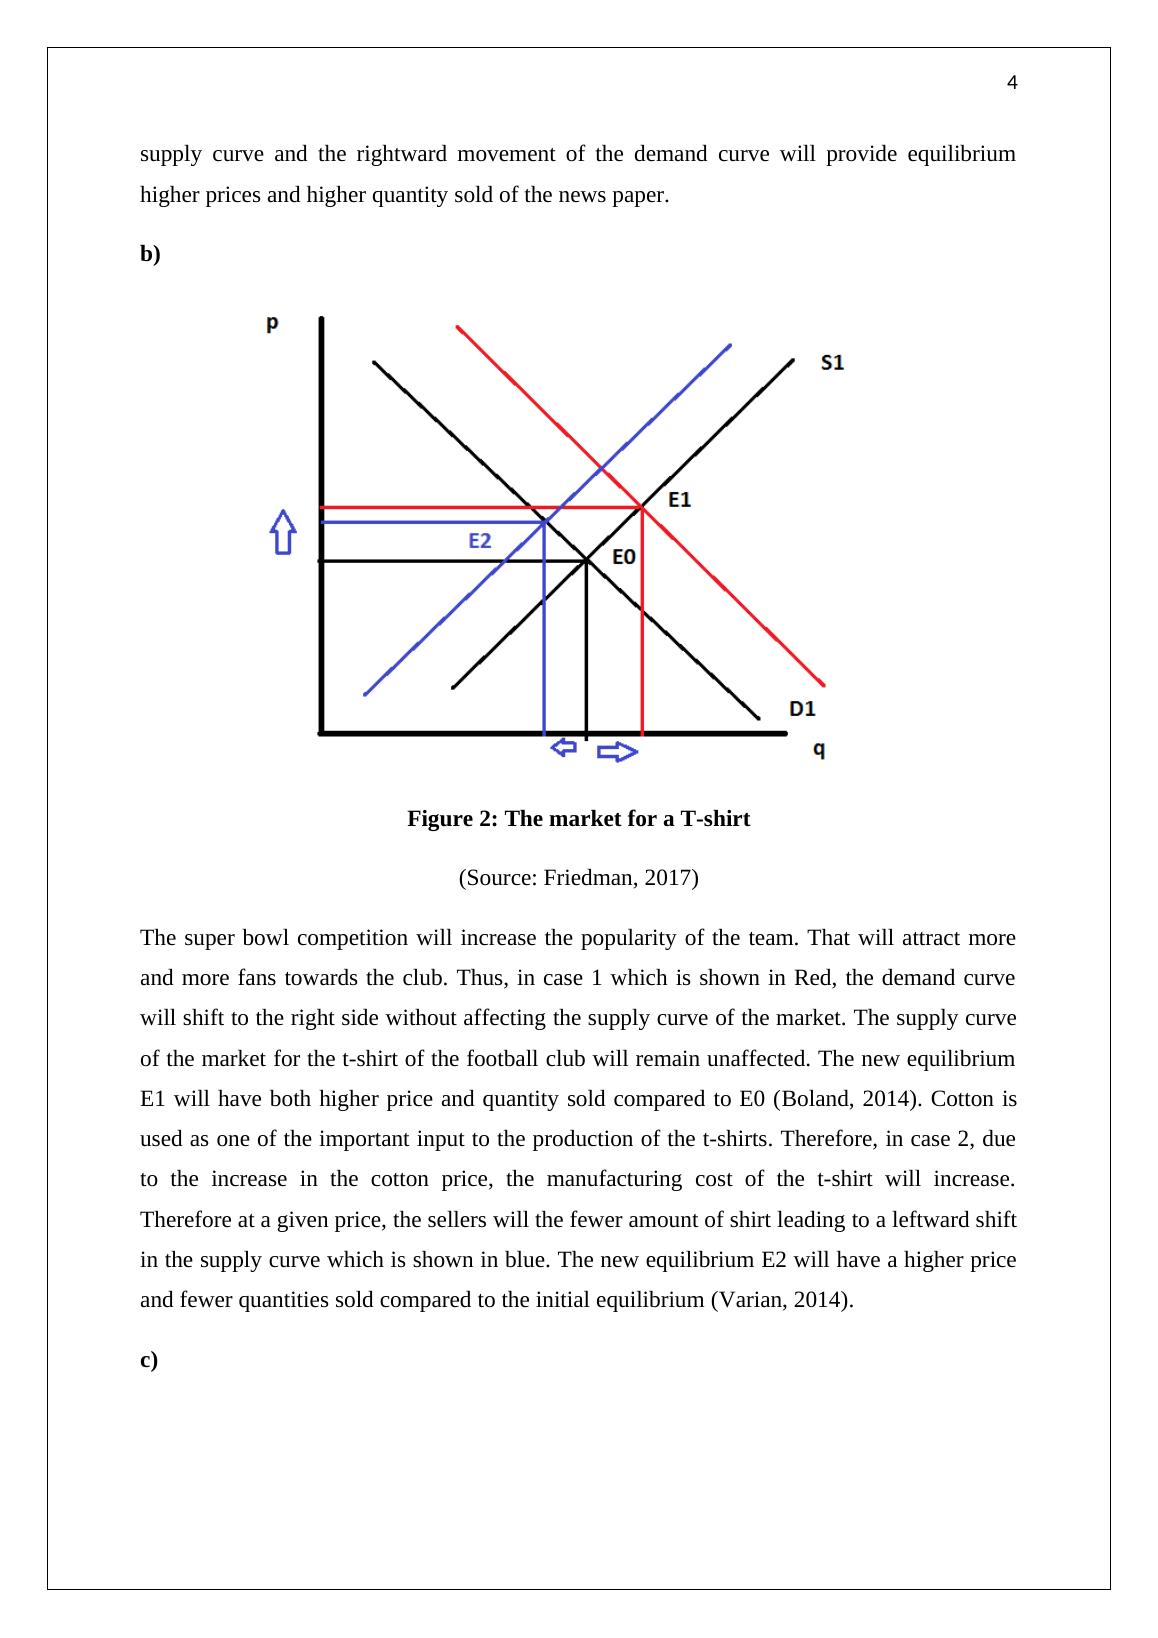
Figure 2: The market for a T-shirt
(Source: Friedman, 2017)
The super bowl competition will increase the popularity of the team. That will attract more
and more fans towards the club. Thus, in case 1 which is shown in Red, the demand curve
will shift to the right side without affecting the supply curve of the market. The supply curve
of the market for the t-shirt of the football club will remain unaffected. The new equilibrium
E1 will have both higher price and quantity sold compared to E0 (Boland, 2014). Cotton is
used as one of the important input to the production of the t-shirts. Therefore, in case 2, due
to the increase in the cotton price, the manufacturing cost of the t-shirt will increase.
Therefore at a given price, the sellers will the fewer amount of shirt leading to a leftward shift
in the supply curve which is shown in blue. The new equilibrium E2 will have a higher price
and fewer quantities sold compared to the initial equilibrium (Varian, 2014).
c)
supply curve and the rightward movement of the demand curve will provide equilibrium
higher prices and higher quantity sold of the news paper.
b)
Figure 2: The market for a T-shirt
(Source: Friedman, 2017)
The super bowl competition will increase the popularity of the team. That will attract more
and more fans towards the club. Thus, in case 1 which is shown in Red, the demand curve
will shift to the right side without affecting the supply curve of the market. The supply curve
of the market for the t-shirt of the football club will remain unaffected. The new equilibrium
E1 will have both higher price and quantity sold compared to E0 (Boland, 2014). Cotton is
used as one of the important input to the production of the t-shirts. Therefore, in case 2, due
to the increase in the cotton price, the manufacturing cost of the t-shirt will increase.
Therefore at a given price, the sellers will the fewer amount of shirt leading to a leftward shift
in the supply curve which is shown in blue. The new equilibrium E2 will have a higher price
and fewer quantities sold compared to the initial equilibrium (Varian, 2014).
c)
End of preview
Want to access all the pages? Upload your documents or become a member.
Related Documents
Economics - Assignment Sample PDFlg...
|27
|5358
|60
Managerial Economicslg...
|27
|4358
|268
Assignment on economics PDFlg...
|27
|5204
|103
Demand, Supply, Shifts, Elasticity and its Applicationlg...
|10
|1793
|101
Managerial Economics: Demand, Supply, and Perfect Competitionlg...
|21
|5844
|84
Managerial Economics - PDFlg...
|20
|4868
|338