Managerial Finance Report: Tesco and Sainsbury's Financial Ratios
VerifiedAdded on 2023/01/04
|20
|3867
|435
Report
AI Summary
This report presents a managerial finance analysis of Tesco and Sainsbury's, two major retail companies. It begins with an introduction to managerial finance and its applications, followed by a detailed comparison of their financial ratios, including current, quick, net profit margin, gross profit margin, gearing, price-earnings, earnings per share, return on capital employed, and average inventory turnover. Charts and interpretations are provided to illustrate the financial performance and position of both companies, highlighting their strengths and weaknesses. The report also examines the use of capital budgeting techniques, such as net present value and payback period, to advise senior management on investment decisions, alongside a discussion of the limitations of these techniques. Finally, the report concludes with a summary of the findings and recommendations based on the financial analysis.

MANAGERIAL
FINANCE
FINANCE
Paraphrase This Document
Need a fresh take? Get an instant paraphrase of this document with our AI Paraphraser
Table of Contents
INTRODUCTION...........................................................................................................................1
TASK 1............................................................................................................................................1
Comparison of the financial ratio of two company.....................................................................1
Analysis of the financial performance and position of the both the companies on the basis of
the charts and interpretation ........................................................................................................3
Recommendation on the poor performance...............................................................................12
Limitation for financial ratios....................................................................................................13
PORFOLIO 2.................................................................................................................................13
Use of the capital budgeting techniques to advice the senior management for the adoption of
the two alternatives....................................................................................................................13
Discussion of the limitations for using the investment appraisal techniques in mking long term
decisions ....................................................................................................................................16
CONCLUSION..............................................................................................................................16
REFERENCES .............................................................................................................................17
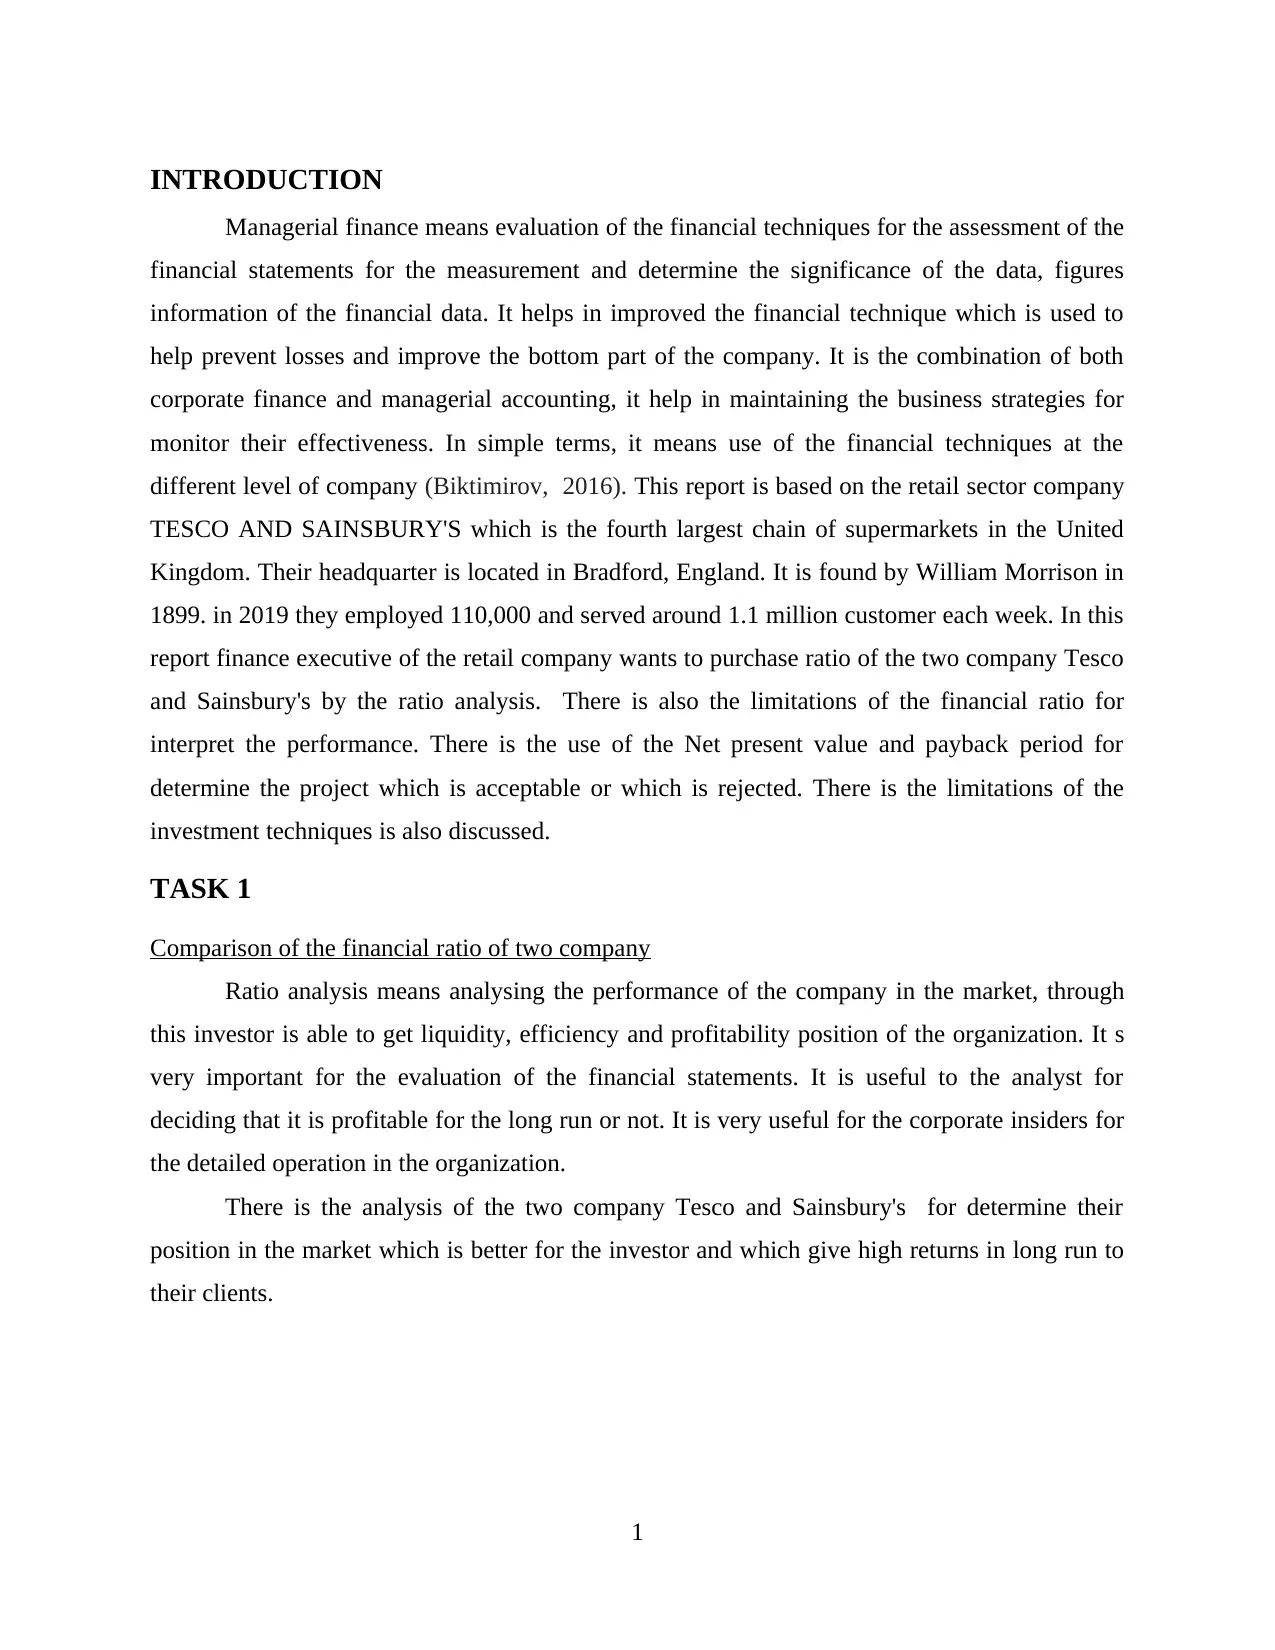
INTRODUCTION
Managerial finance means evaluation of the financial techniques for the assessment of the
financial statements for the measurement and determine the significance of the data, figures
information of the financial data. It helps in improved the financial technique which is used to
help prevent losses and improve the bottom part of the company. It is the combination of both
corporate finance and managerial accounting, it help in maintaining the business strategies for
monitor their effectiveness. In simple terms, it means use of the financial techniques at the
different level of company (Biktimirov, 2016). This report is based on the retail sector company
TESCO AND SAINSBURY'S which is the fourth largest chain of supermarkets in the United
Kingdom. Their headquarter is located in Bradford, England. It is found by William Morrison in
1899. in 2019 they employed 110,000 and served around 1.1 million customer each week. In this
report finance executive of the retail company wants to purchase ratio of the two company Tesco
and Sainsbury's by the ratio analysis. There is also the limitations of the financial ratio for
interpret the performance. There is the use of the Net present value and payback period for
determine the project which is acceptable or which is rejected. There is the limitations of the
investment techniques is also discussed.
TASK 1
Comparison of the financial ratio of two company
Ratio analysis means analysing the performance of the company in the market, through
this investor is able to get liquidity, efficiency and profitability position of the organization. It s
very important for the evaluation of the financial statements. It is useful to the analyst for
deciding that it is profitable for the long run or not. It is very useful for the corporate insiders for
the detailed operation in the organization.
There is the analysis of the two company Tesco and Sainsbury's for determine their
position in the market which is better for the investor and which give high returns in long run to
their clients.
1
⊘ This is a preview!⊘
Do you want full access?
Subscribe today to unlock all pages.
Trusted by 1+ million students worldwide
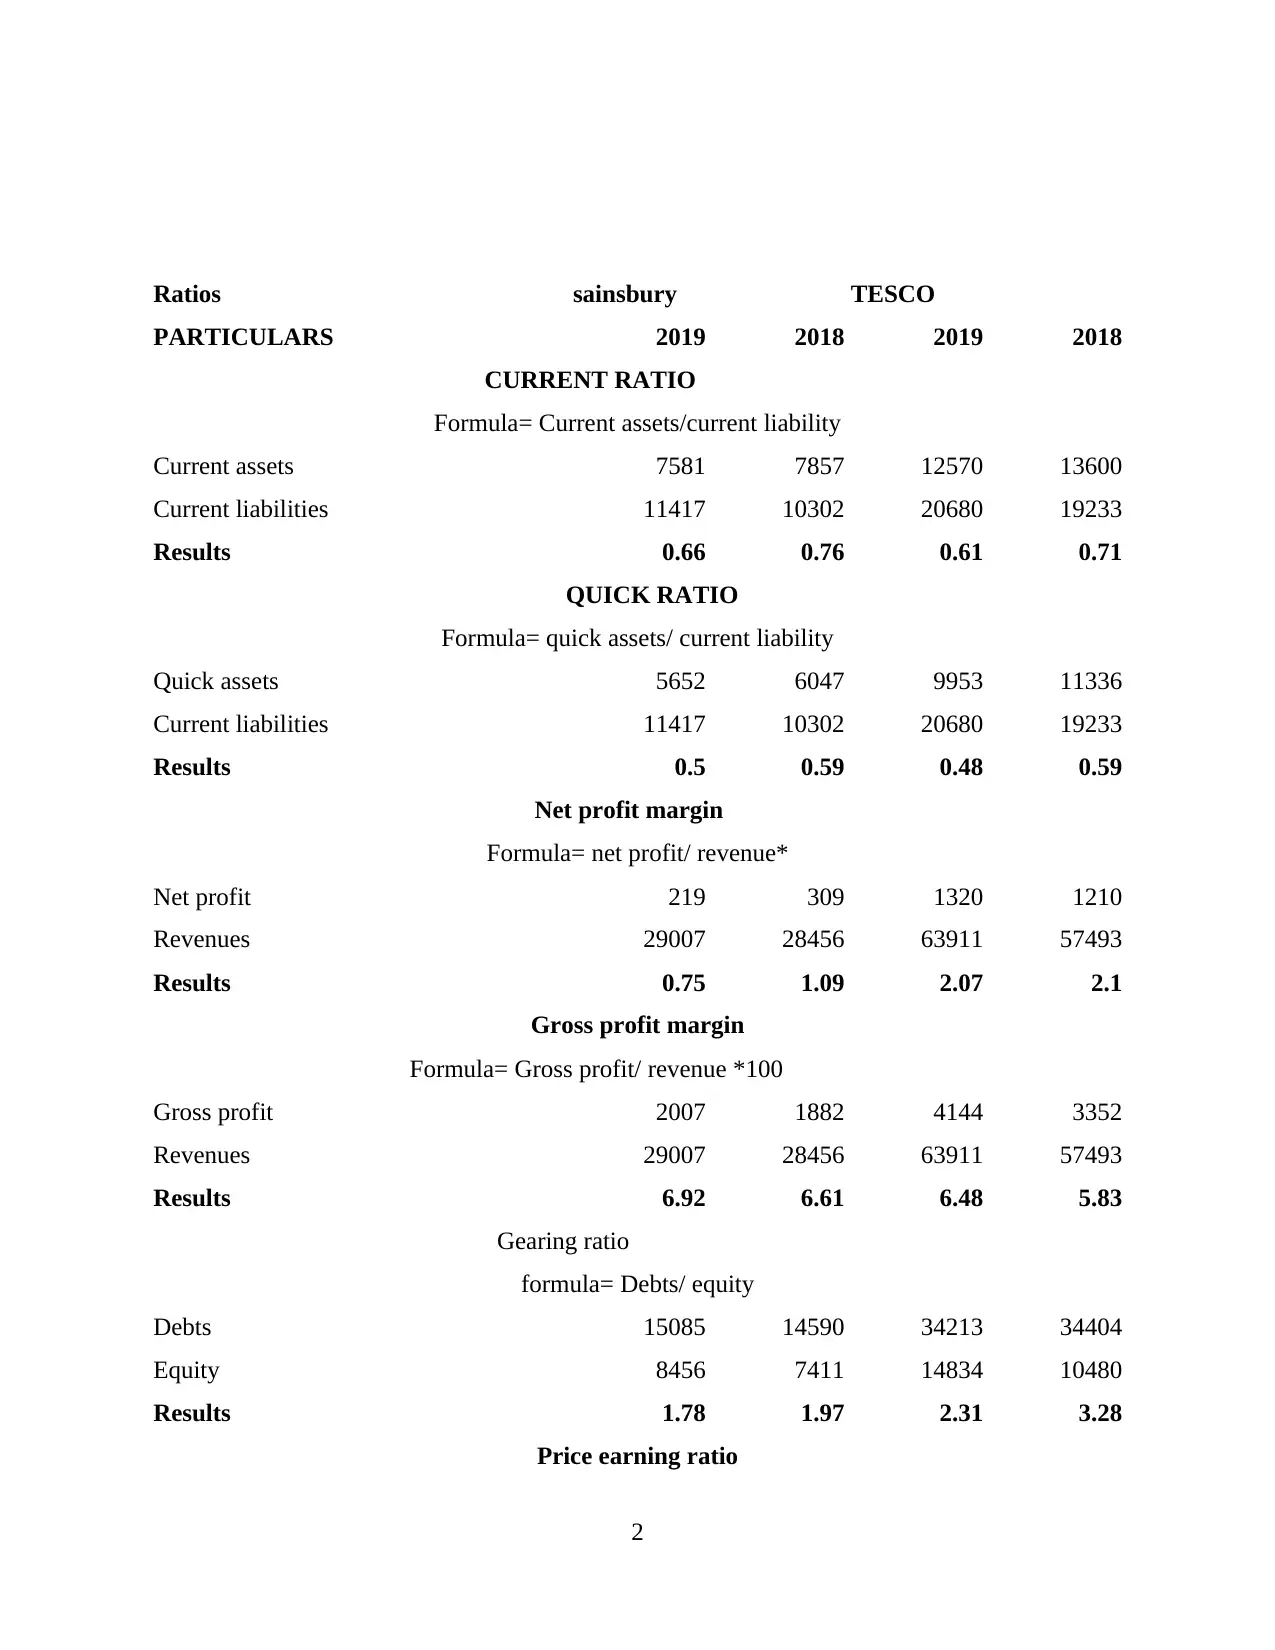
Ratios sainsbury TESCO
PARTICULARS 2019 2018 2019 2018
CURRENT RATIO
Formula= Current assets/current liability
Current assets 7581 7857 12570 13600
Current liabilities 11417 10302 20680 19233
Results 0.66 0.76 0.61 0.71
QUICK RATIO
Formula= quick assets/ current liability
Quick assets 5652 6047 9953 11336
Current liabilities 11417 10302 20680 19233
Results 0.5 0.59 0.48 0.59
Net profit margin
Formula= net profit/ revenue*
Net profit 219 309 1320 1210
Revenues 29007 28456 63911 57493
Results 0.75 1.09 2.07 2.1
Gross profit margin
Formula= Gross profit/ revenue *100
Gross profit 2007 1882 4144 3352
Revenues 29007 28456 63911 57493
Results 6.92 6.61 6.48 5.83
Gearing ratio
formula= Debts/ equity
Debts 15085 14590 34213 34404
Equity 8456 7411 14834 10480
Results 1.78 1.97 2.31 3.28
Price earning ratio
2
Paraphrase This Document
Need a fresh take? Get an instant paraphrase of this document with our AI Paraphraser
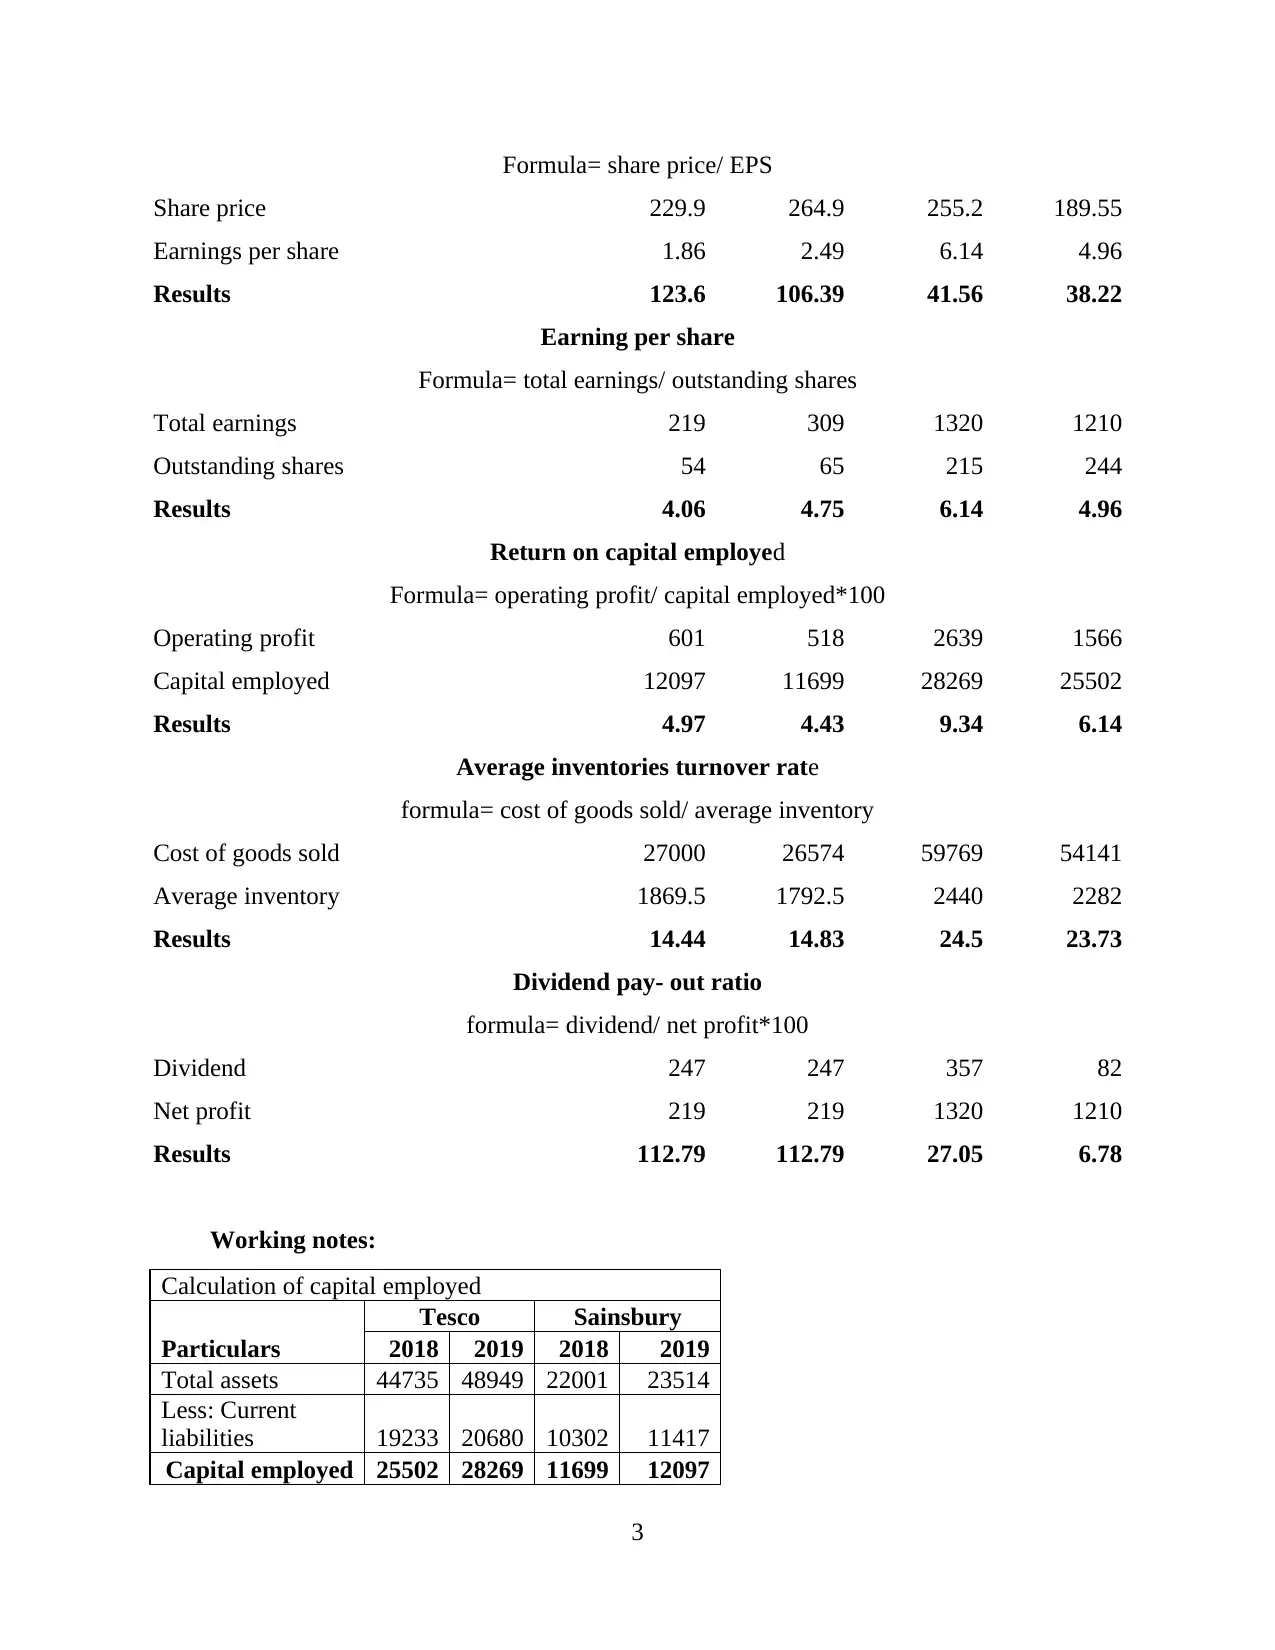
Formula= share price/ EPS
Share price 229.9 264.9 255.2 189.55
Earnings per share 1.86 2.49 6.14 4.96
Results 123.6 106.39 41.56 38.22
Earning per share
Formula= total earnings/ outstanding shares
Total earnings 219 309 1320 1210
Outstanding shares 54 65 215 244
Results 4.06 4.75 6.14 4.96
Return on capital employed
Formula= operating profit/ capital employed*100
Operating profit 601 518 2639 1566
Capital employed 12097 11699 28269 25502
Results 4.97 4.43 9.34 6.14
Average inventories turnover rate
formula= cost of goods sold/ average inventory
Cost of goods sold 27000 26574 59769 54141
Average inventory 1869.5 1792.5 2440 2282
Results 14.44 14.83 24.5 23.73
Dividend pay- out ratio
formula= dividend/ net profit*100
Dividend 247 247 357 82
Net profit 219 219 1320 1210
Results 112.79 112.79 27.05 6.78
Working notes:
Calculation of capital employed
Particulars
Tesco Sainsbury
2018 2019 2018 2019
Total assets 44735 48949 22001 23514
Less: Current
liabilities 19233 20680 10302 11417
Capital employed 25502 28269 11699 12097
3
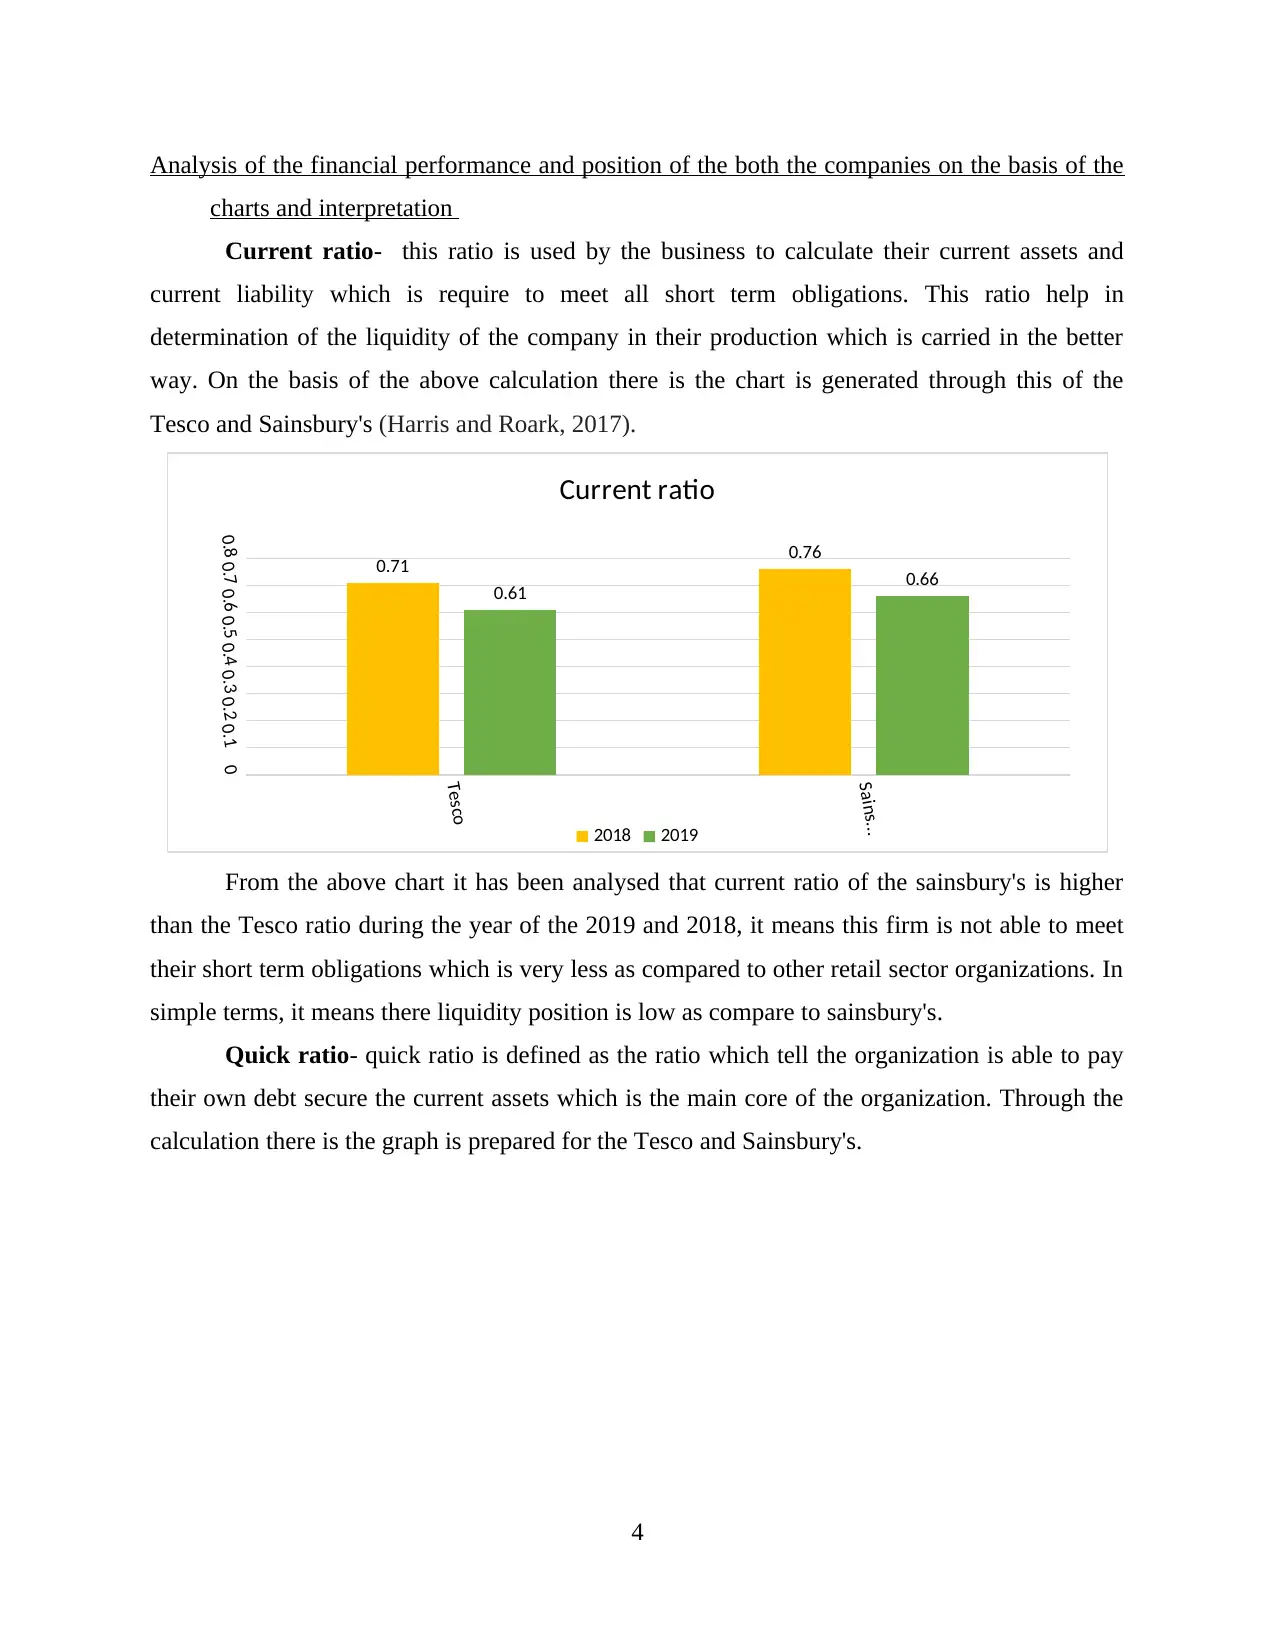
Analysis of the financial performance and position of the both the companies on the basis of the
charts and interpretation
Current ratio- this ratio is used by the business to calculate their current assets and
current liability which is require to meet all short term obligations. This ratio help in
determination of the liquidity of the company in their production which is carried in the better
way. On the basis of the above calculation there is the chart is generated through this of the
Tesco and Sainsbury's (Harris and Roark, 2017).
From the above chart it has been analysed that current ratio of the sainsbury's is higher
than the Tesco ratio during the year of the 2019 and 2018, it means this firm is not able to meet
their short term obligations which is very less as compared to other retail sector organizations. In
simple terms, it means there liquidity position is low as compare to sainsbury's.
Quick ratio- quick ratio is defined as the ratio which tell the organization is able to pay
their own debt secure the current assets which is the main core of the organization. Through the
calculation there is the graph is prepared for the Tesco and Sainsbury's.
4
Tesco
Sains...
00.10.20.30.40.50.60.70.8 0.71 0.76
0.61 0.66
Current ratio
2018 2019
⊘ This is a preview!⊘
Do you want full access?
Subscribe today to unlock all pages.
Trusted by 1+ million students worldwide
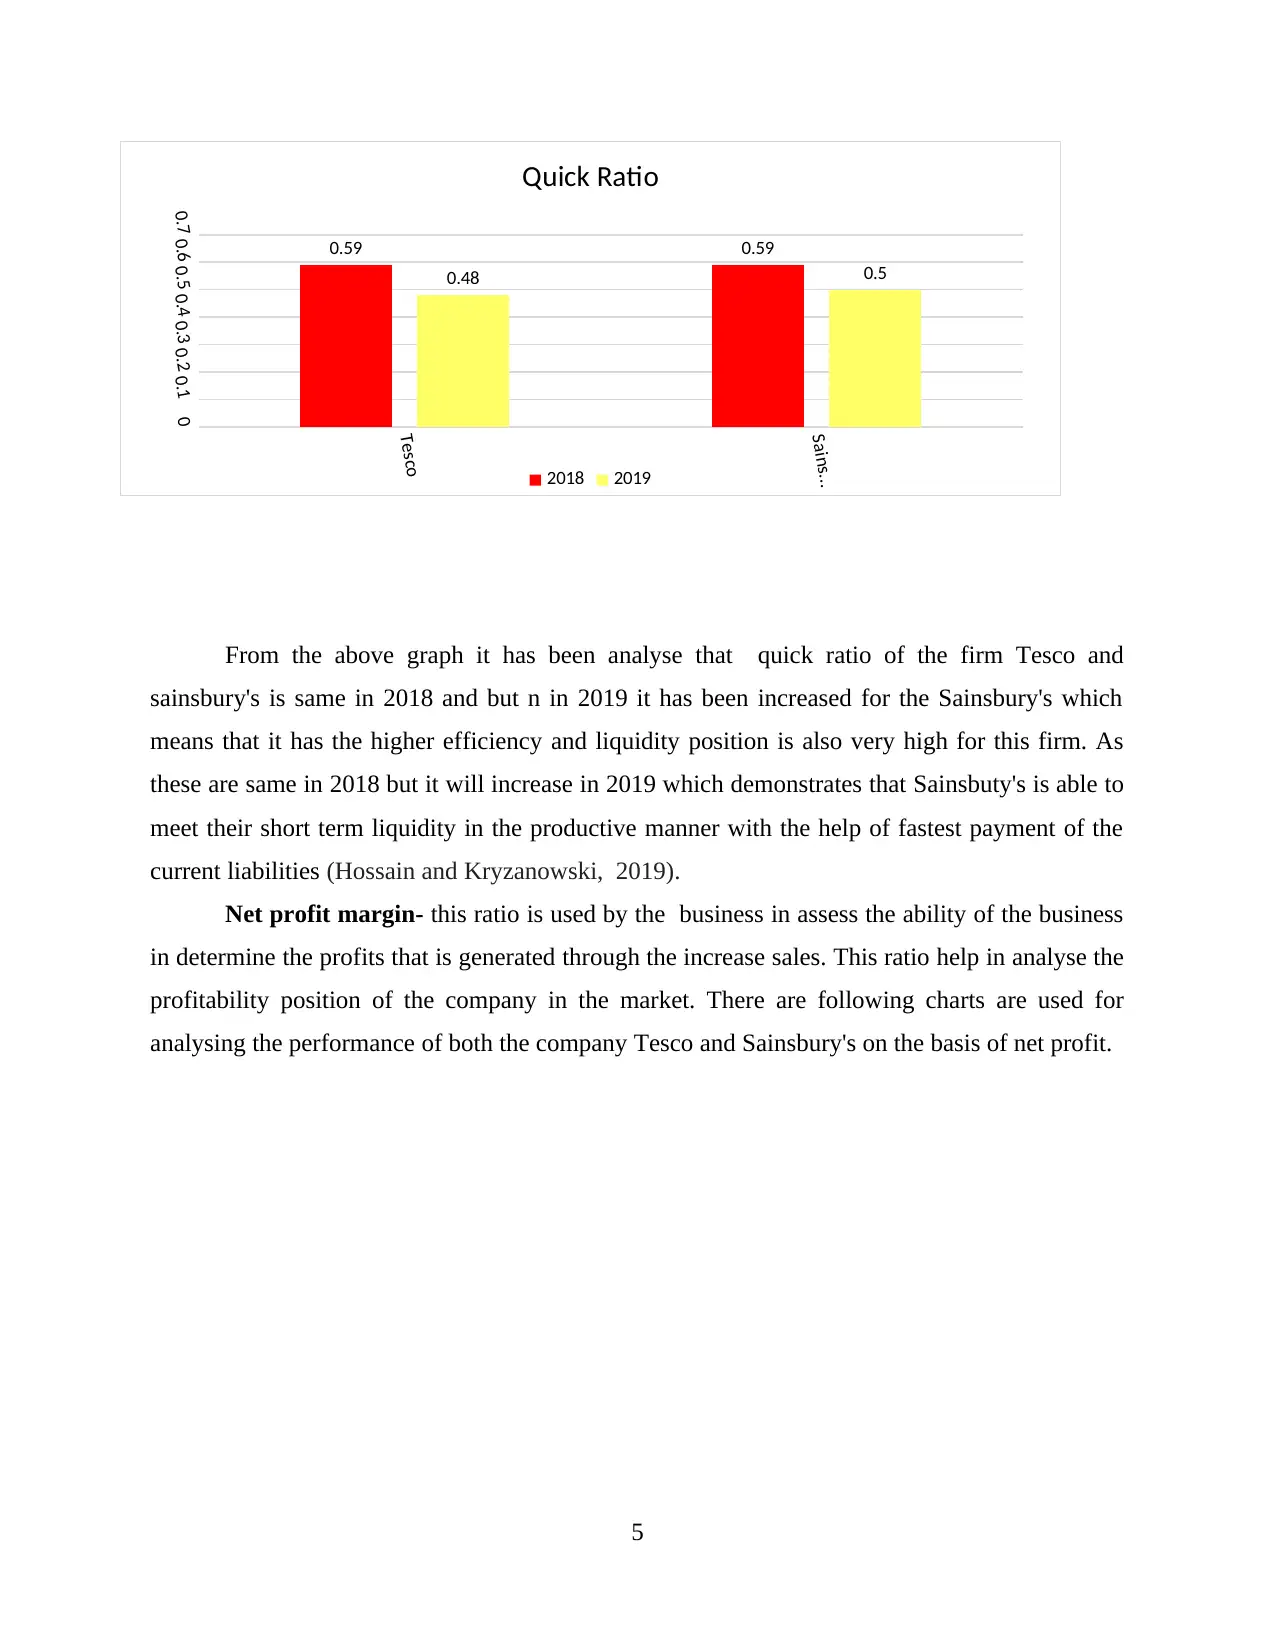
From the above graph it has been analyse that quick ratio of the firm Tesco and
sainsbury's is same in 2018 and but n in 2019 it has been increased for the Sainsbury's which
means that it has the higher efficiency and liquidity position is also very high for this firm. As
these are same in 2018 but it will increase in 2019 which demonstrates that Sainsbuty's is able to
meet their short term liquidity in the productive manner with the help of fastest payment of the
current liabilities (Hossain and Kryzanowski, 2019).
Net profit margin- this ratio is used by the business in assess the ability of the business
in determine the profits that is generated through the increase sales. This ratio help in analyse the
profitability position of the company in the market. There are following charts are used for
analysing the performance of both the company Tesco and Sainsbury's on the basis of net profit.
5
Tesco
Sains...
00.10.20.30.40.50.60.7
0.59 0.59
0.48 0.5
Quick Ratio
2018 2019
Paraphrase This Document
Need a fresh take? Get an instant paraphrase of this document with our AI Paraphraser
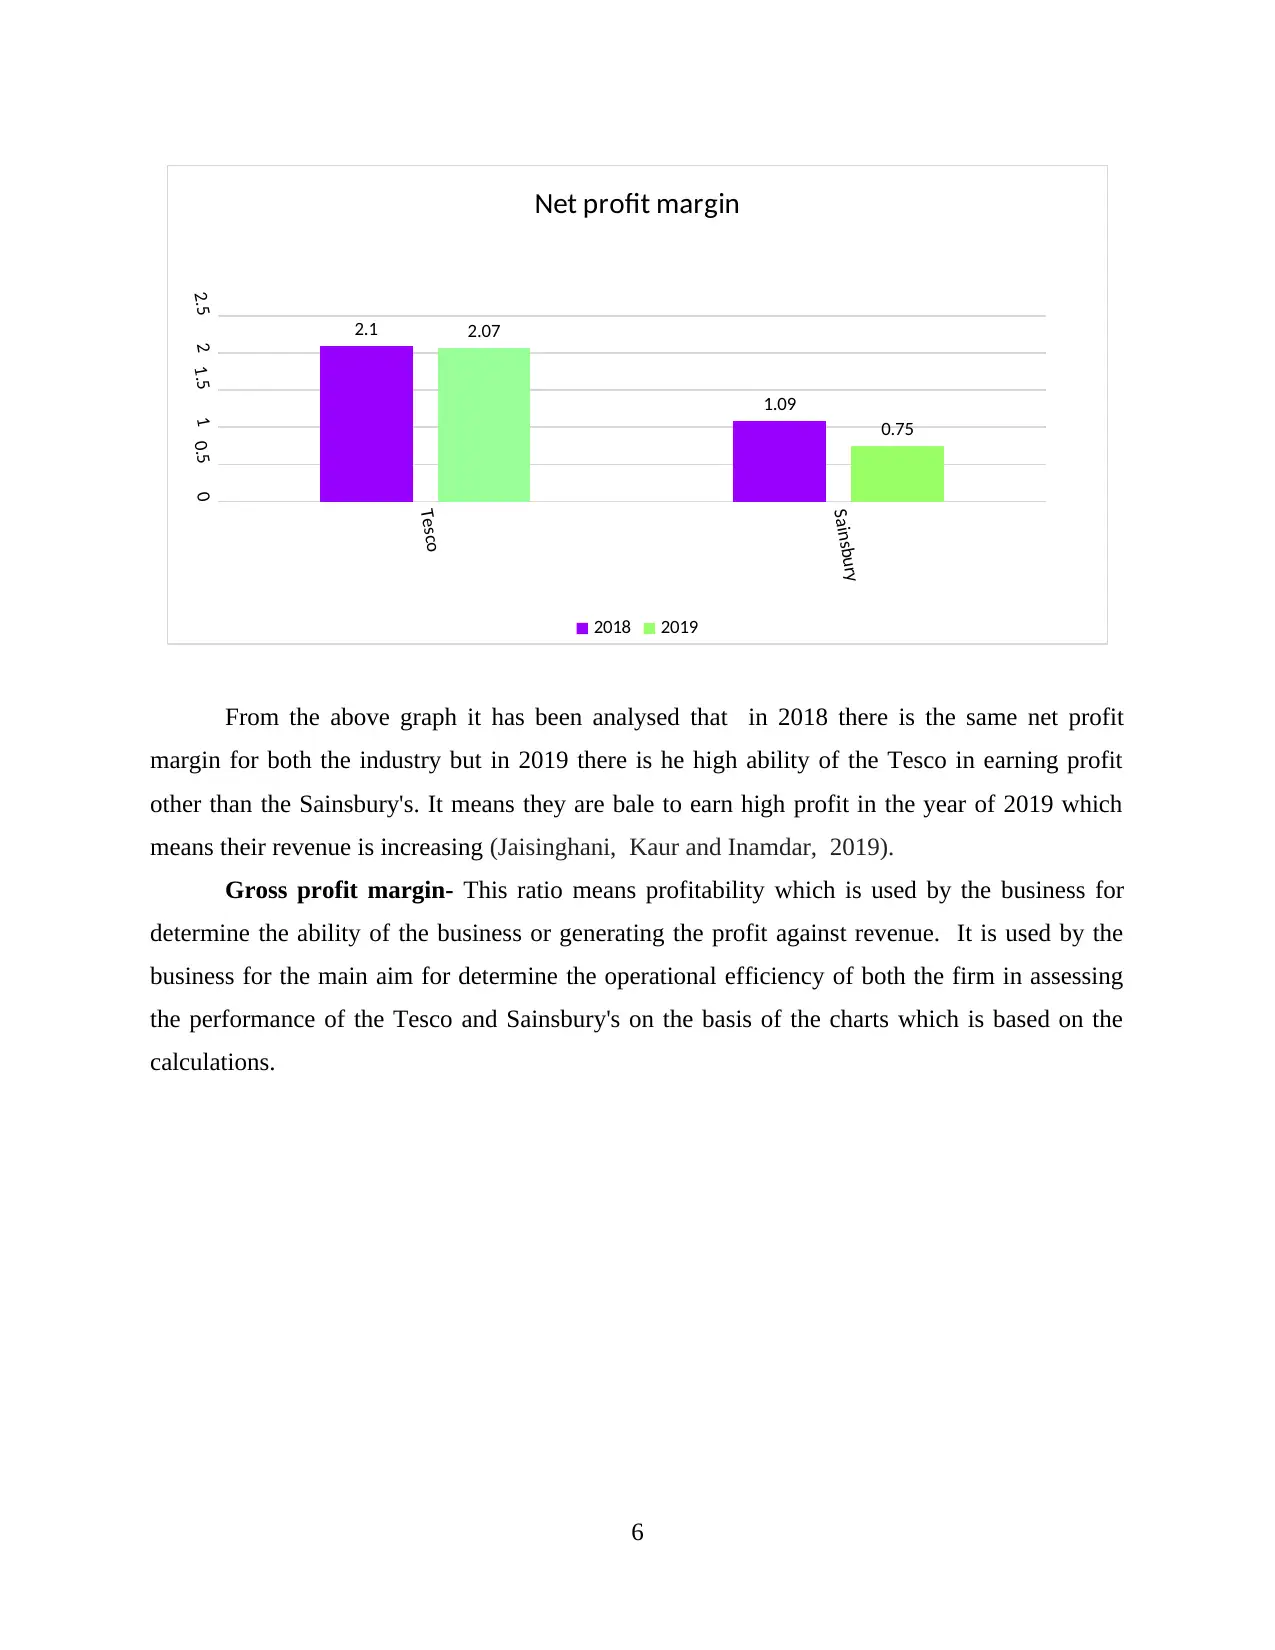
From the above graph it has been analysed that in 2018 there is the same net profit
margin for both the industry but in 2019 there is he high ability of the Tesco in earning profit
other than the Sainsbury's. It means they are bale to earn high profit in the year of 2019 which
means their revenue is increasing (Jaisinghani, Kaur and Inamdar, 2019).
Gross profit margin- This ratio means profitability which is used by the business for
determine the ability of the business or generating the profit against revenue. It is used by the
business for the main aim for determine the operational efficiency of both the firm in assessing
the performance of the Tesco and Sainsbury's on the basis of the charts which is based on the
calculations.
6
Tesco
Sainsbury
00.511.522.5 2.1
1.09
2.07
0.75
Net profit margin
2018 2019
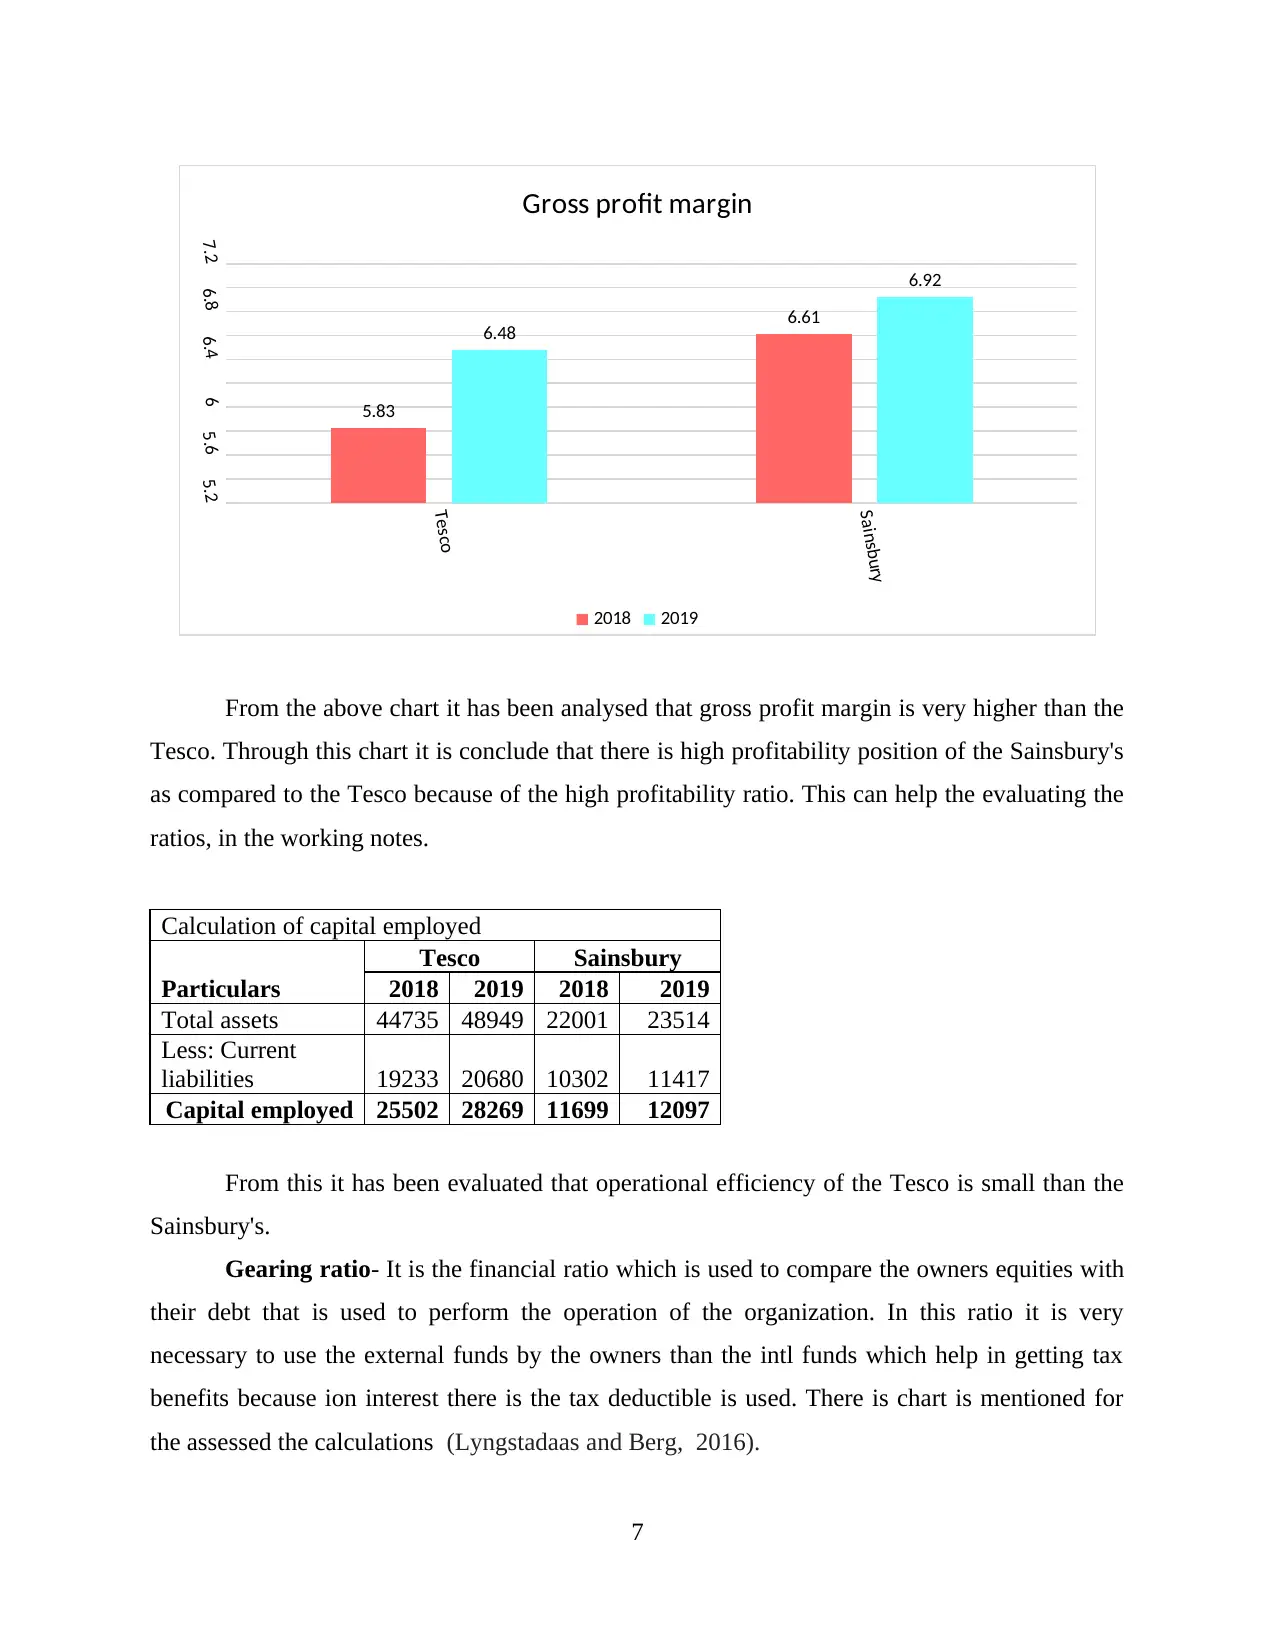
From the above chart it has been analysed that gross profit margin is very higher than the
Tesco. Through this chart it is conclude that there is high profitability position of the Sainsbury's
as compared to the Tesco because of the high profitability ratio. This can help the evaluating the
ratios, in the working notes.
Calculation of capital employed
Particulars
Tesco Sainsbury
2018 2019 2018 2019
Total assets 44735 48949 22001 23514
Less: Current
liabilities 19233 20680 10302 11417
Capital employed 25502 28269 11699 12097
From this it has been evaluated that operational efficiency of the Tesco is small than the
Sainsbury's.
Gearing ratio- It is the financial ratio which is used to compare the owners equities with
their debt that is used to perform the operation of the organization. In this ratio it is very
necessary to use the external funds by the owners than the intl funds which help in getting tax
benefits because ion interest there is the tax deductible is used. There is chart is mentioned for
the assessed the calculations (Lyngstadaas and Berg, 2016).
7
Tesco
Sainsbury
5.25.666.46.87.2
5.83
6.61
6.48
6.92
Gross profit margin
2018 2019
⊘ This is a preview!⊘
Do you want full access?
Subscribe today to unlock all pages.
Trusted by 1+ million students worldwide
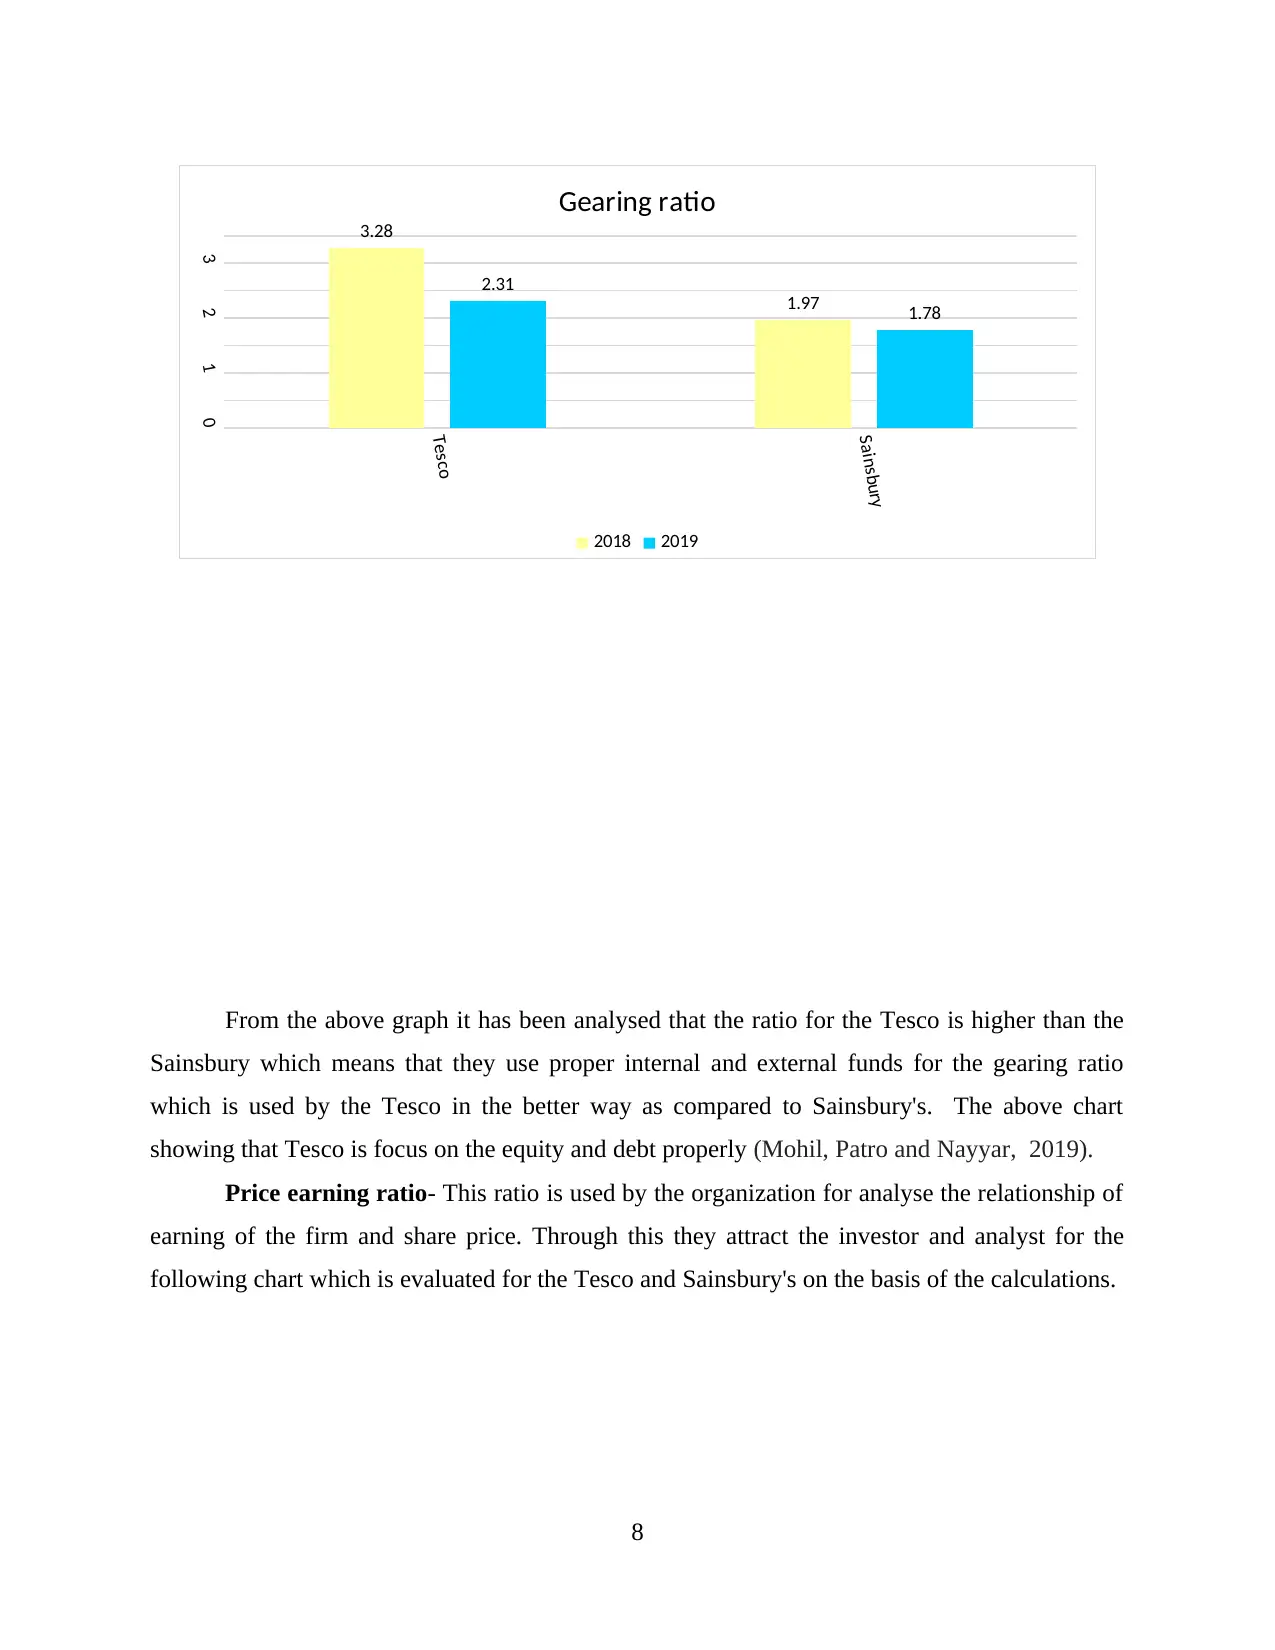
From the above graph it has been analysed that the ratio for the Tesco is higher than the
Sainsbury which means that they use proper internal and external funds for the gearing ratio
which is used by the Tesco in the better way as compared to Sainsbury's. The above chart
showing that Tesco is focus on the equity and debt properly (Mohil, Patro and Nayyar, 2019).
Price earning ratio- This ratio is used by the organization for analyse the relationship of
earning of the firm and share price. Through this they attract the investor and analyst for the
following chart which is evaluated for the Tesco and Sainsbury's on the basis of the calculations.
8
Tesco
Sainsbury
0
1
2
3
3.28
1.97
2.31
1.78
Gearing ratio
2018 2019
Paraphrase This Document
Need a fresh take? Get an instant paraphrase of this document with our AI Paraphraser
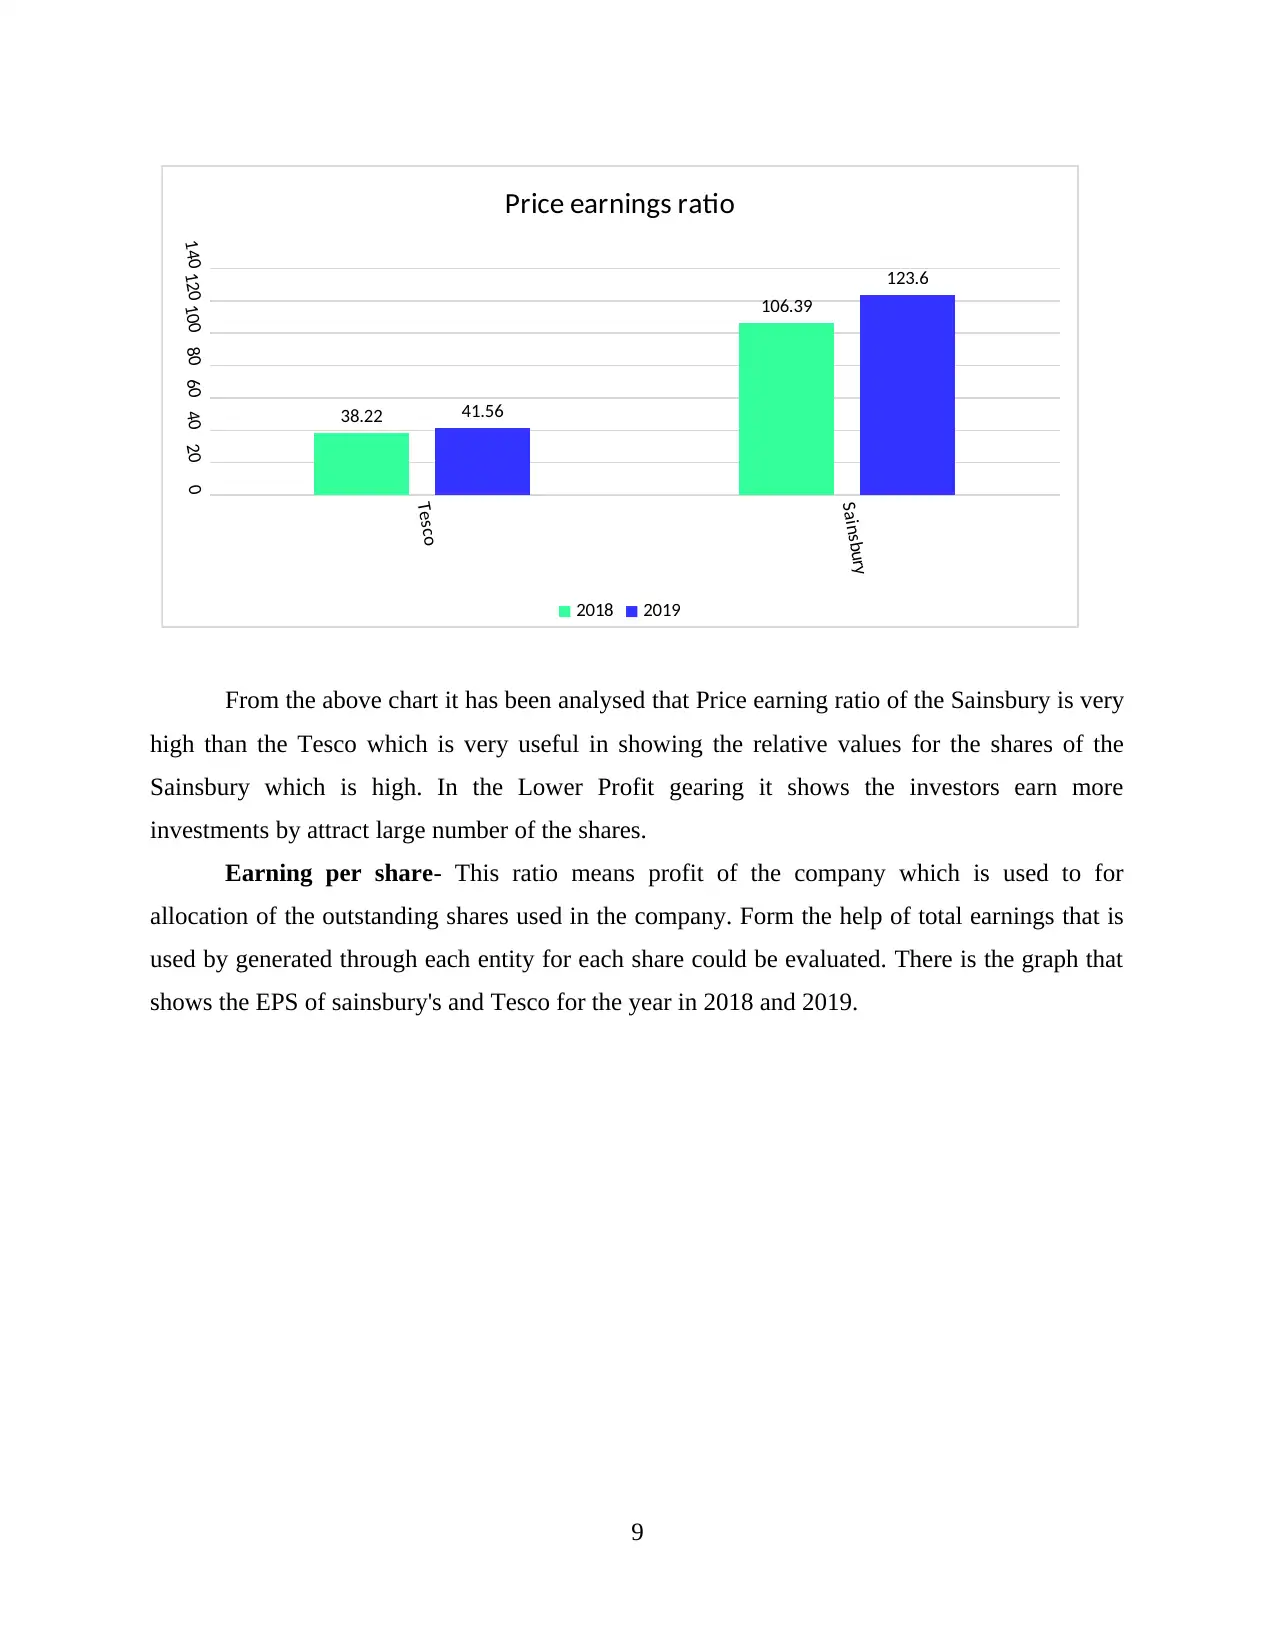
From the above chart it has been analysed that Price earning ratio of the Sainsbury is very
high than the Tesco which is very useful in showing the relative values for the shares of the
Sainsbury which is high. In the Lower Profit gearing it shows the investors earn more
investments by attract large number of the shares.
Earning per share- This ratio means profit of the company which is used to for
allocation of the outstanding shares used in the company. Form the help of total earnings that is
used by generated through each entity for each share could be evaluated. There is the graph that
shows the EPS of sainsbury's and Tesco for the year in 2018 and 2019.
9
Tesco
Sainsbury
020406080100120140
38.22
106.39
41.56
123.6
Price earnings ratio
2018 2019
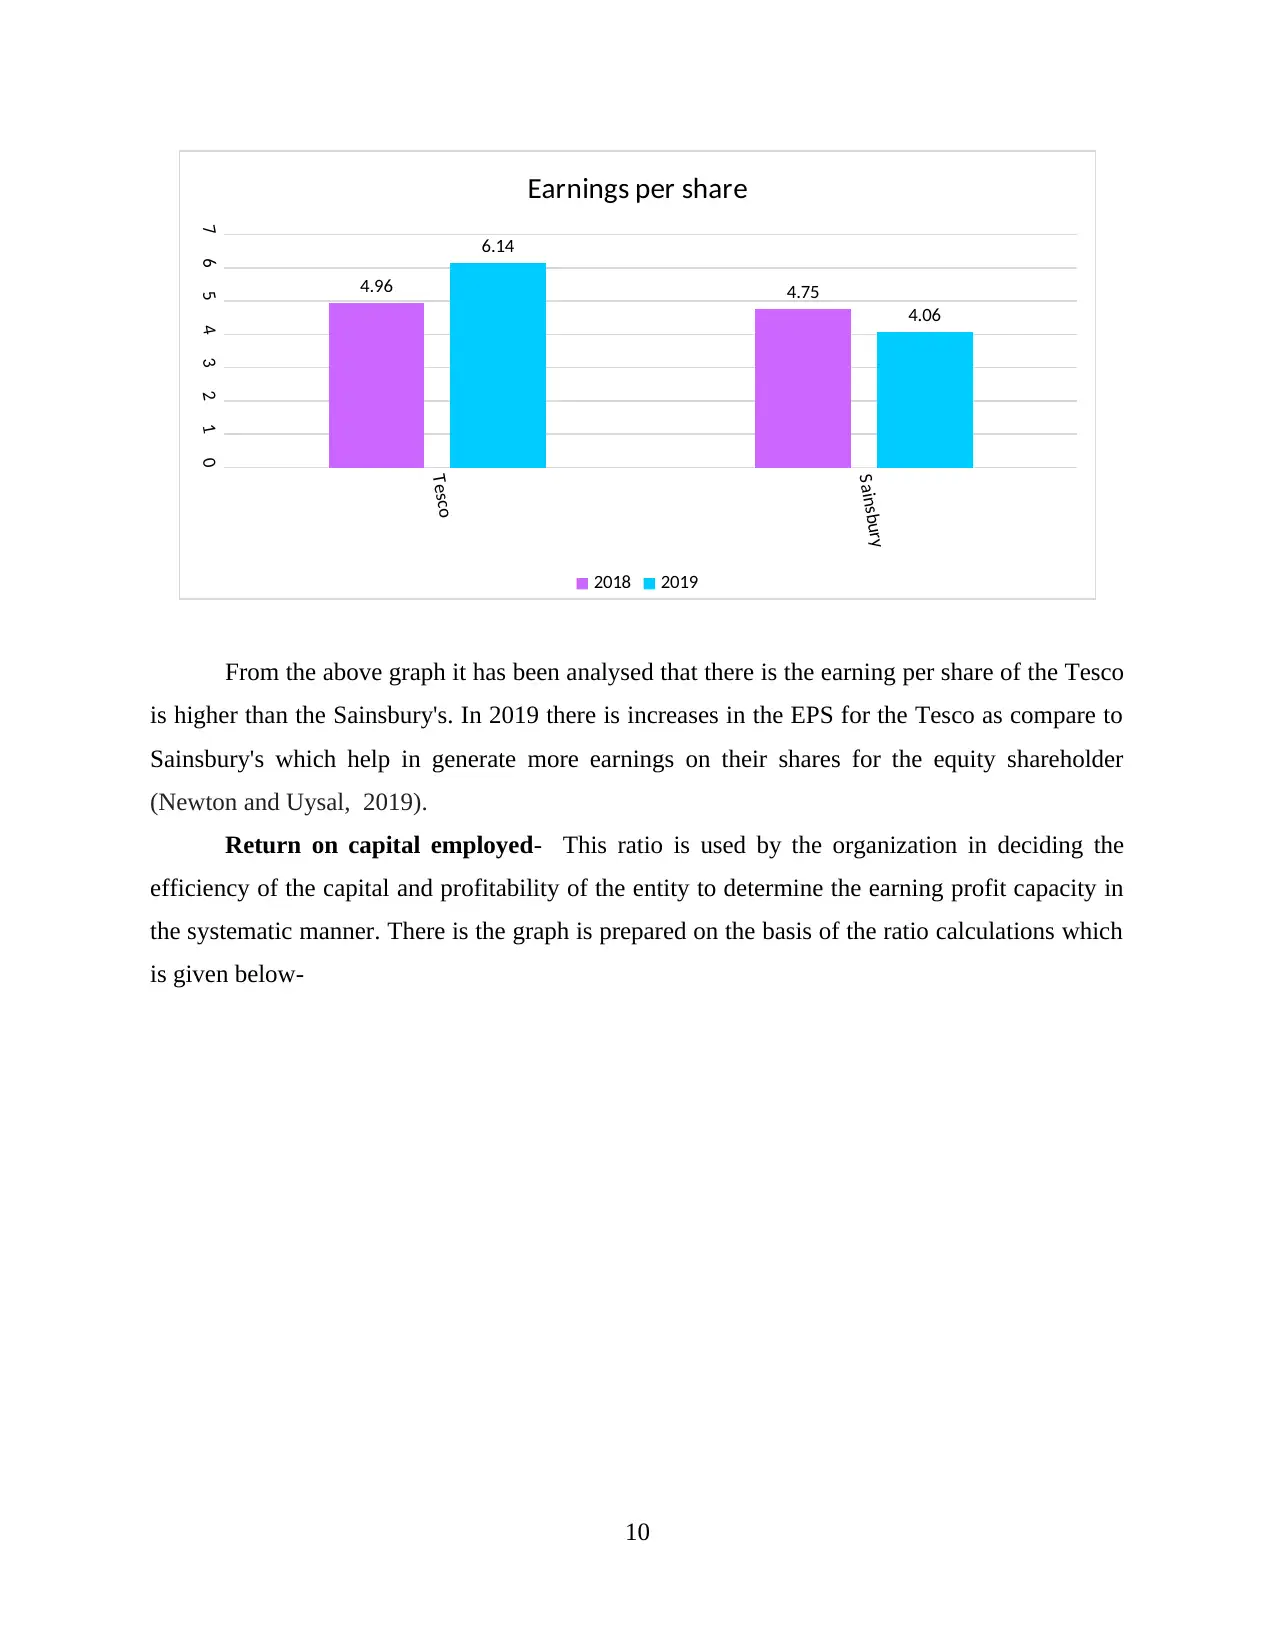
From the above graph it has been analysed that there is the earning per share of the Tesco
is higher than the Sainsbury's. In 2019 there is increases in the EPS for the Tesco as compare to
Sainsbury's which help in generate more earnings on their shares for the equity shareholder
(Newton and Uysal, 2019).
Return on capital employed- This ratio is used by the organization in deciding the
efficiency of the capital and profitability of the entity to determine the earning profit capacity in
the systematic manner. There is the graph is prepared on the basis of the ratio calculations which
is given below-
10
Tesco
Sainsbury
01234567
4.96 4.75
6.14
4.06
Earnings per share
2018 2019
⊘ This is a preview!⊘
Do you want full access?
Subscribe today to unlock all pages.
Trusted by 1+ million students worldwide
1 out of 20
Related Documents


Your All-in-One AI-Powered Toolkit for Academic Success.
+13062052269
info@desklib.com
Available 24*7 on WhatsApp / Email
![[object Object]](/_next/static/media/star-bottom.7253800d.svg)
Unlock your academic potential
Copyright © 2020–2026 A2Z Services. All Rights Reserved. Developed and managed by ZUCOL.