Managerial Finance Report: Financial Performance of Two Companies
VerifiedAdded on 2022/12/30
|17
|3984
|58
Report
AI Summary
This report provides a detailed analysis of managerial finance, focusing on the financial performance of Tesco and Sainsbury's. The report begins with an introduction to managerial finance and its application in evaluating organizational performance. It then proceeds to compare the two companies through ratio analysis, including current ratio, quick ratio, net profit margin, gross profit margin, gearing ratio, price-earnings ratio, earnings per share, return on capital employed, average inventory turnover rate, and dividend payout ratio. The analysis covers the years 2018 and 2019, with charts and interpretations of the ratios. The report also examines investment appraisal techniques and their limitations in decision-making. Finally, it concludes by summarizing the key findings and discussing the limitations of both ratio analysis and investment appraisal techniques. The report offers valuable insights into the financial health and operational efficiency of the two companies.
Managerial
Finance
Finance
Paraphrase This Document
Need a fresh take? Get an instant paraphrase of this document with our AI Paraphraser
Table of Contents
INTRODUCTION...........................................................................................................................3
PORTFOLIO 1.................................................................................................................................3
Comparison of performance of Tesco and Sainsbury’s through ratio analysis:..........................3
Interpretation of ratio analysis and chart for the purpose of evaluating financial performance of
business:.......................................................................................................................................5
Recommendations for improvement of financial performance:................................................12
Limitations of reliance on financial ratios for interpretation of performance of company:......13
PORTFOLIO 2...............................................................................................................................14
Usage of appropriate investment appraisal techniques for opting appropriate project:.............14
Limitations of utilizing investment appraisal techniques for decision making of long term:. . .16
CONCLUSION..............................................................................................................................16
REFERENCES..............................................................................................................................17
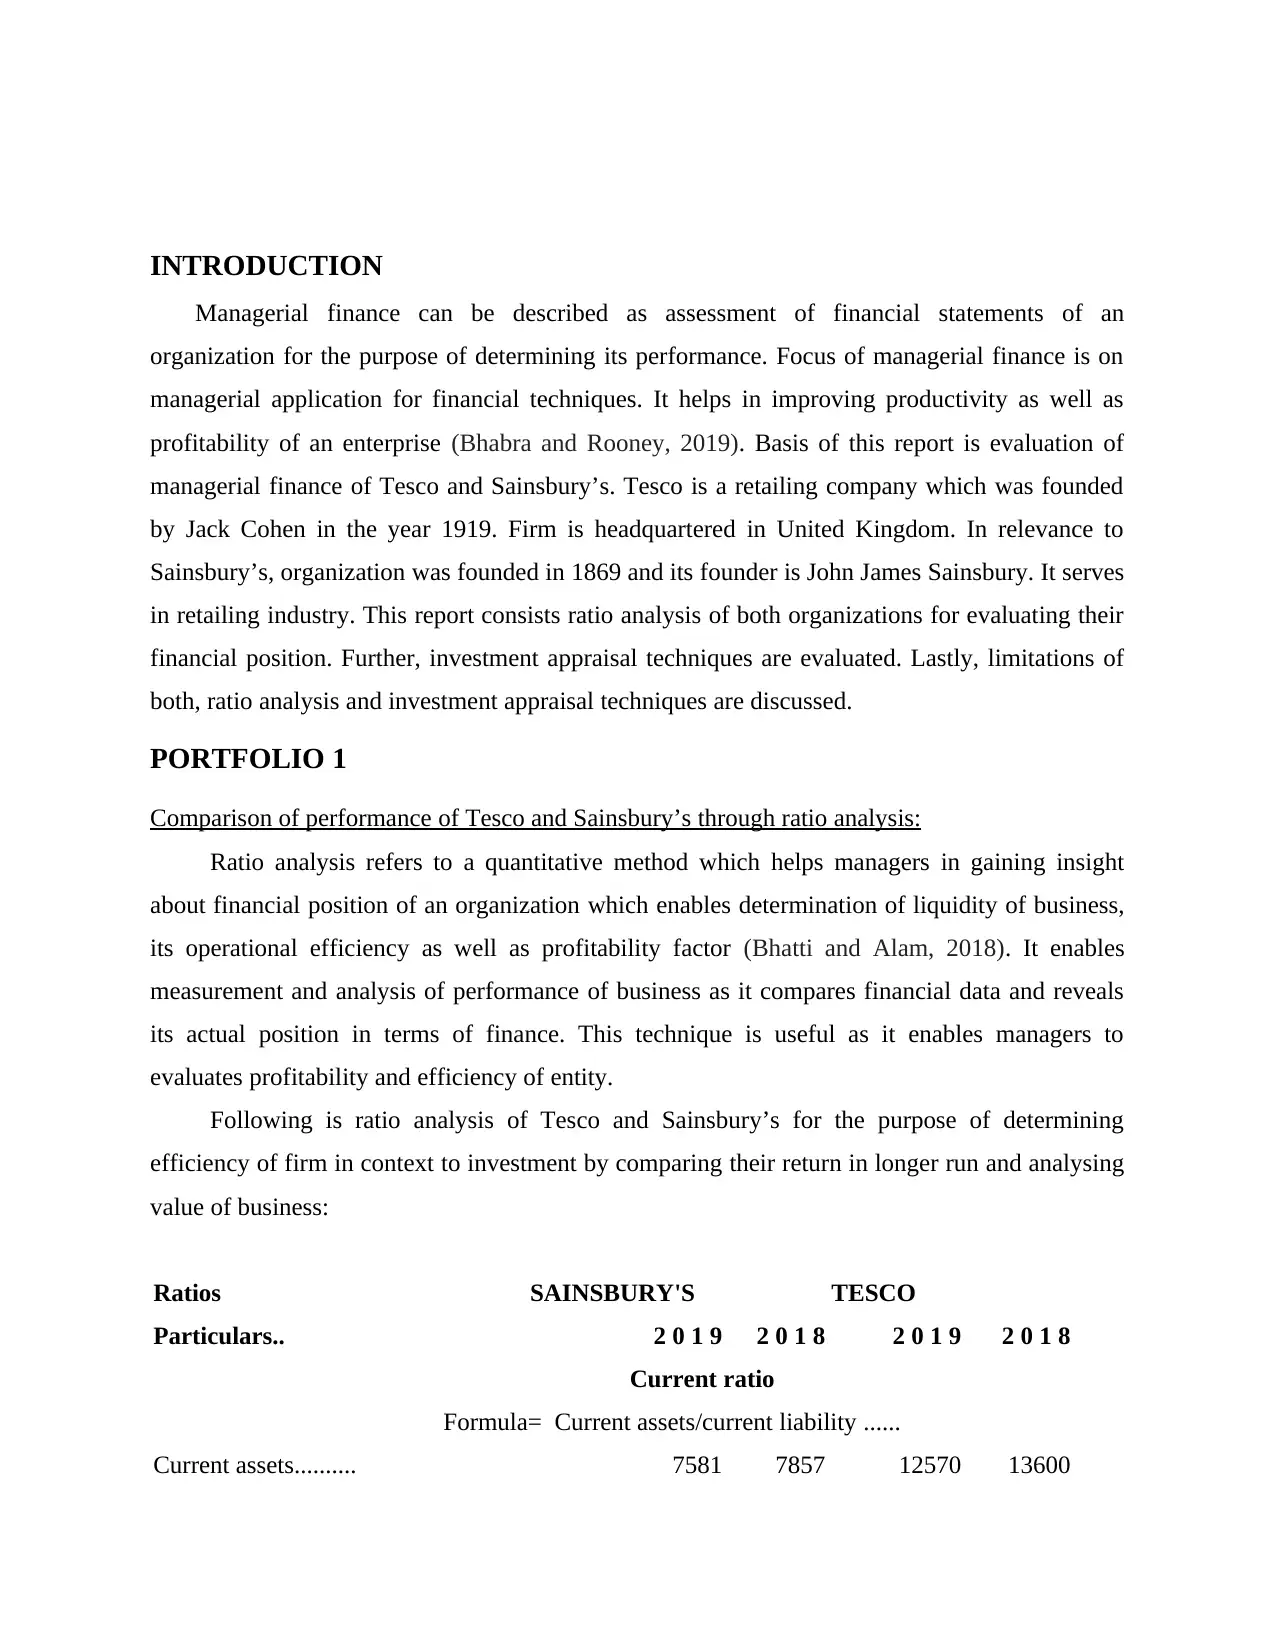
INTRODUCTION
Managerial finance can be described as assessment of financial statements of an
organization for the purpose of determining its performance. Focus of managerial finance is on
managerial application for financial techniques. It helps in improving productivity as well as
profitability of an enterprise (Bhabra and Rooney, 2019). Basis of this report is evaluation of
managerial finance of Tesco and Sainsbury’s. Tesco is a retailing company which was founded
by Jack Cohen in the year 1919. Firm is headquartered in United Kingdom. In relevance to
Sainsbury’s, organization was founded in 1869 and its founder is John James Sainsbury. It serves
in retailing industry. This report consists ratio analysis of both organizations for evaluating their
financial position. Further, investment appraisal techniques are evaluated. Lastly, limitations of
both, ratio analysis and investment appraisal techniques are discussed.
PORTFOLIO 1
Comparison of performance of Tesco and Sainsbury’s through ratio analysis:
Ratio analysis refers to a quantitative method which helps managers in gaining insight
about financial position of an organization which enables determination of liquidity of business,
its operational efficiency as well as profitability factor (Bhatti and Alam, 2018). It enables
measurement and analysis of performance of business as it compares financial data and reveals
its actual position in terms of finance. This technique is useful as it enables managers to
evaluates profitability and efficiency of entity.
Following is ratio analysis of Tesco and Sainsbury’s for the purpose of determining
efficiency of firm in context to investment by comparing their return in longer run and analysing
value of business:
Ratios SAINSBURY'S TESCO
Particulars.. 2 0 1 9 2 0 1 8 2 0 1 9 2 0 1 8
Current ratio
Formula= Current assets/current liability ......
Current assets.......... 7581 7857 12570 13600
⊘ This is a preview!⊘
Do you want full access?
Subscribe today to unlock all pages.
Trusted by 1+ million students worldwide
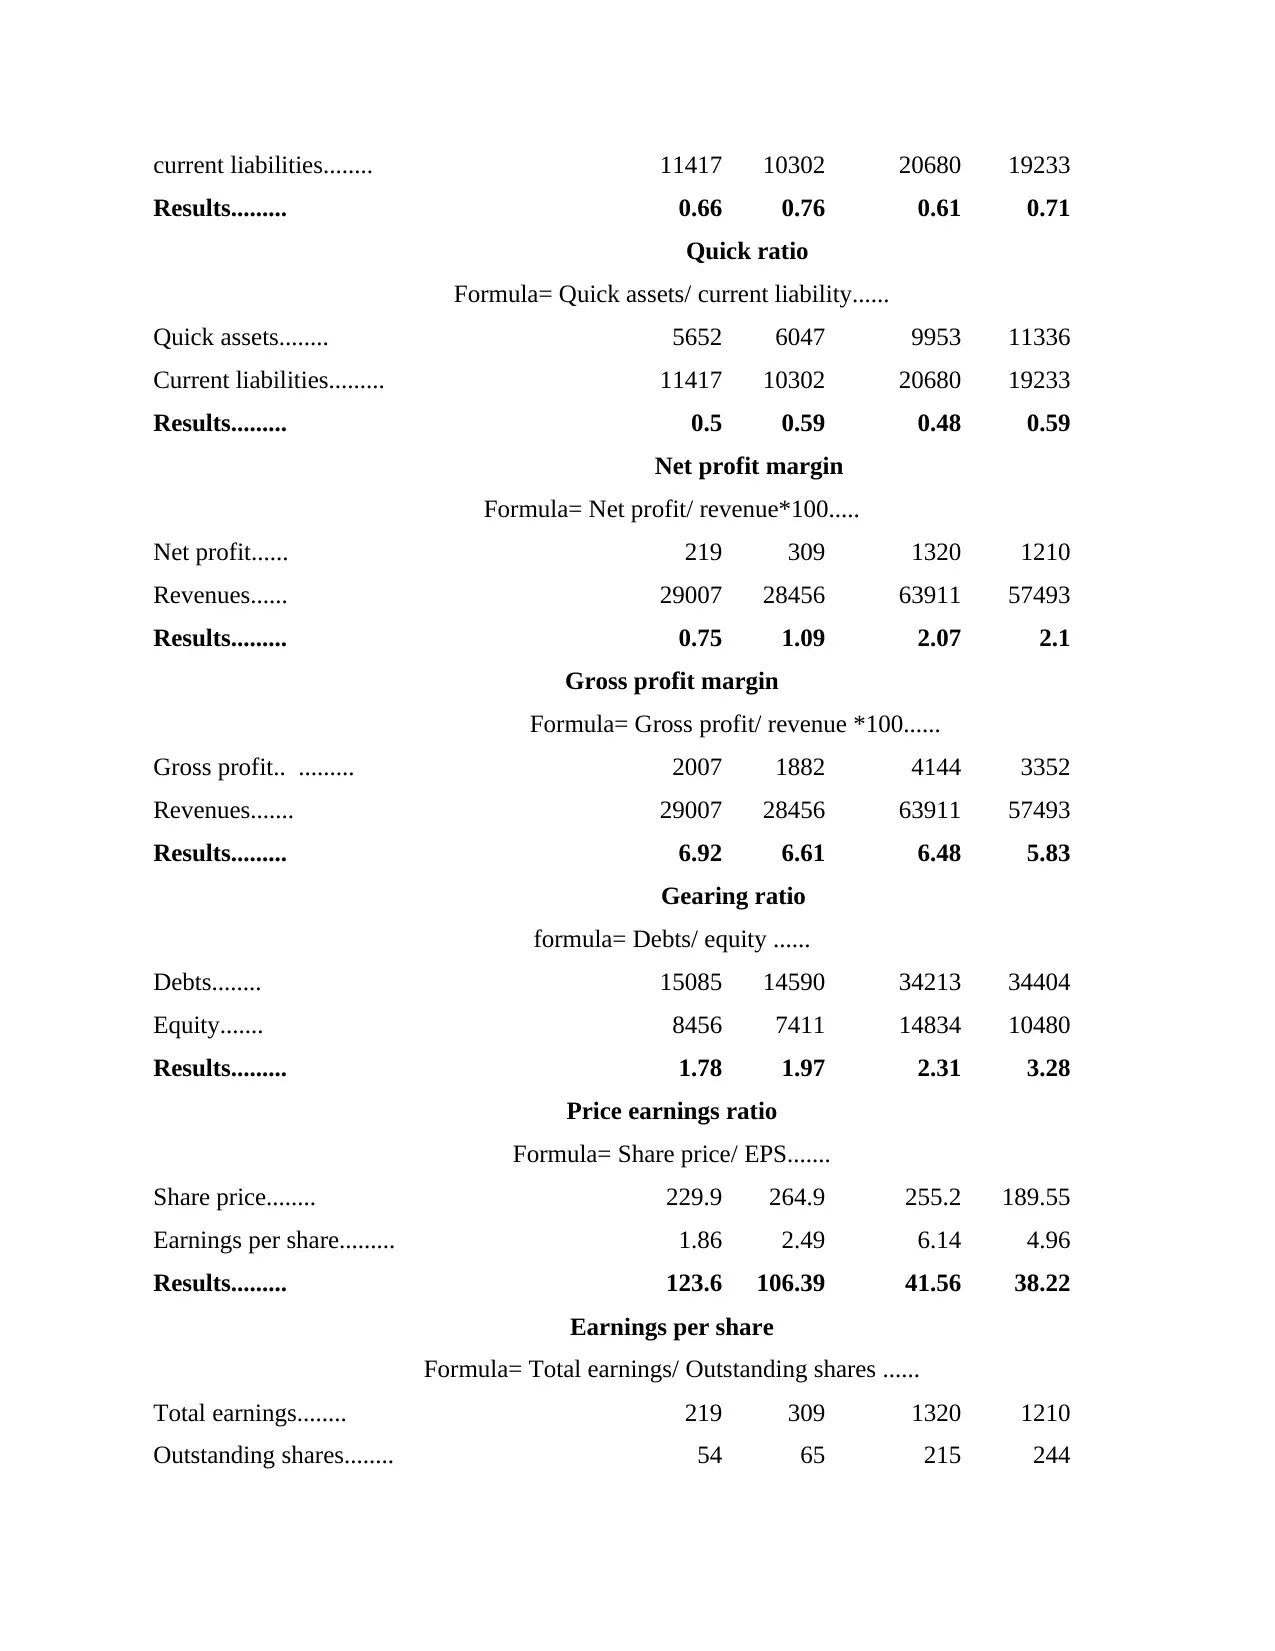
current liabilities........ 11417 10302 20680 19233
Results......... 0.66 0.76 0.61 0.71
Quick ratio
Formula= Quick assets/ current liability......
Quick assets........ 5652 6047 9953 11336
Current liabilities......... 11417 10302 20680 19233
Results......... 0.5 0.59 0.48 0.59
Net profit margin
Formula= Net profit/ revenue*100.....
Net profit...... 219 309 1320 1210
Revenues...... 29007 28456 63911 57493
Results......... 0.75 1.09 2.07 2.1
Gross profit margin
Formula= Gross profit/ revenue *100......
Gross profit.. ......... 2007 1882 4144 3352
Revenues....... 29007 28456 63911 57493
Results......... 6.92 6.61 6.48 5.83
Gearing ratio
formula= Debts/ equity ......
Debts........ 15085 14590 34213 34404
Equity....... 8456 7411 14834 10480
Results......... 1.78 1.97 2.31 3.28
Price earnings ratio
Formula= Share price/ EPS.......
Share price........ 229.9 264.9 255.2 189.55
Earnings per share......... 1.86 2.49 6.14 4.96
Results......... 123.6 106.39 41.56 38.22
Earnings per share
Formula= Total earnings/ Outstanding shares ......
Total earnings........ 219 309 1320 1210
Outstanding shares........ 54 65 215 244
Paraphrase This Document
Need a fresh take? Get an instant paraphrase of this document with our AI Paraphraser
Results......... 4.06 4.75 6.14 4.96
Return on capital employed
Formula= Operating profit/ Capital employed*100......
Operating profit........ 601 518 2639 1566
Capital employed......... 12097 11699 28269 25502
Results......... 4.97 4.43 9.34 6.14
Average inventories turnover rate
Formula= Cost of goods sold/ Average inventory......
Cost of goods sold........ 27000 26574 59769 54141
Cost of goods sold........ 1869.5 1792.5 2440 2282
Results....... 14.44 14.83 24.5 23.73
Dividend pay- out ratio
Formula= Dividend/ Net profit* 100......
Dividend …. .... 247 247 357 82
Net profit........ 219 219 1320 1210
Results....... 112.79 112.79 27.05 6.78
Working Notes:
Calculation of capital employed......
Particulars.. Tesco.. Sainsbury..
2018.. 2019.. 2018.. 2019..
Total assets...... 44,735.. 48,949.. 22,001.. 23,514..
Less: Current liabilities....... 19,233.. 20,680.. 10,302.. 11,417..
Capital employed......... 25,502.. 28,269 11,699.. 12,097..
Interpretation of ratio analysis and chart for the purpose of evaluating financial performance of
business:
Current ratio: It is calculated for determining efficiency of an organization in meeting
short term requirements of business. In other words, it is liquidity ratio which helps in
Return on capital employed
Formula= Operating profit/ Capital employed*100......
Operating profit........ 601 518 2639 1566
Capital employed......... 12097 11699 28269 25502
Results......... 4.97 4.43 9.34 6.14
Average inventories turnover rate
Formula= Cost of goods sold/ Average inventory......
Cost of goods sold........ 27000 26574 59769 54141
Cost of goods sold........ 1869.5 1792.5 2440 2282
Results....... 14.44 14.83 24.5 23.73
Dividend pay- out ratio
Formula= Dividend/ Net profit* 100......
Dividend …. .... 247 247 357 82
Net profit........ 219 219 1320 1210
Results....... 112.79 112.79 27.05 6.78
Working Notes:
Calculation of capital employed......
Particulars.. Tesco.. Sainsbury..
2018.. 2019.. 2018.. 2019..
Total assets...... 44,735.. 48,949.. 22,001.. 23,514..
Less: Current liabilities....... 19,233.. 20,680.. 10,302.. 11,417..
Capital employed......... 25,502.. 28,269 11,699.. 12,097..
Interpretation of ratio analysis and chart for the purpose of evaluating financial performance of
business:
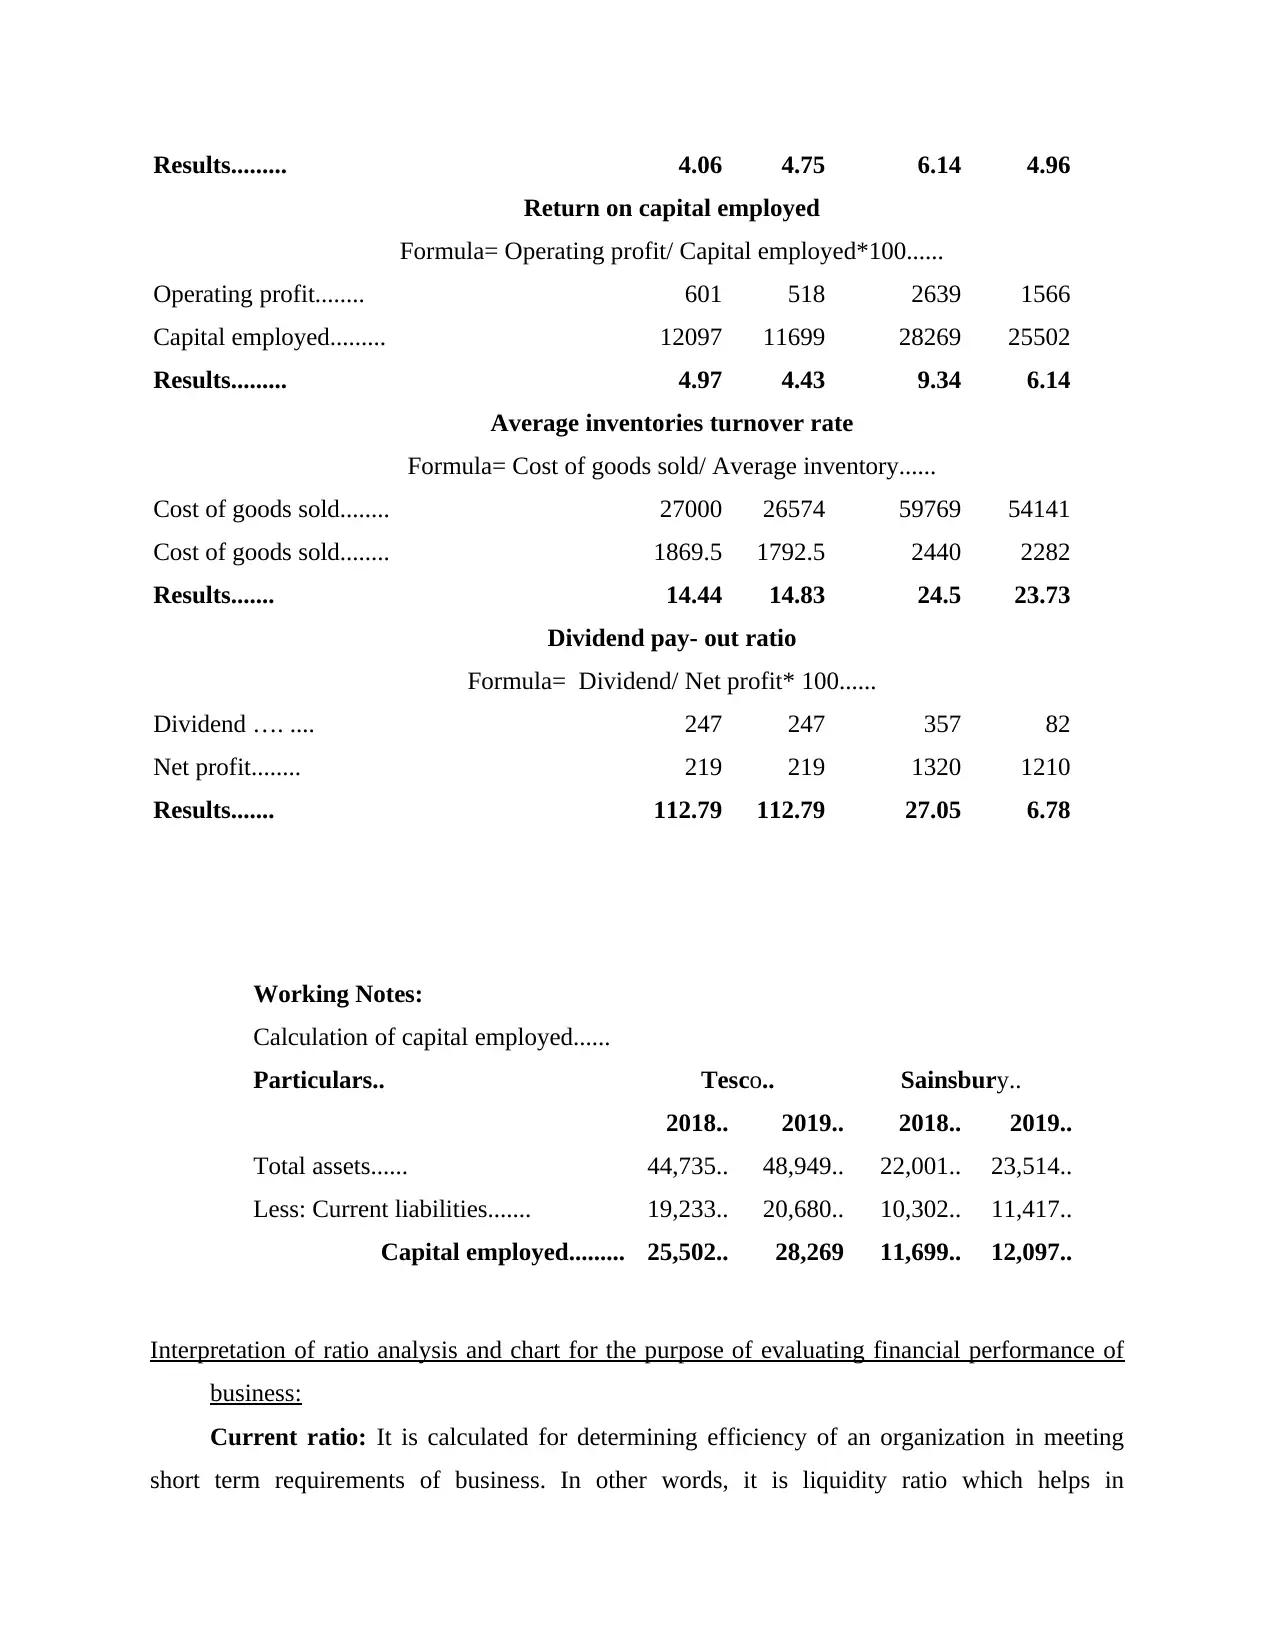
Current ratio: It is calculated for determining efficiency of an organization in meeting
short term requirements of business. In other words, it is liquidity ratio which helps in
measurement of ability of entity in paying off its short term obligations, that is, obligations
which are due within a year. It is helpful is informing managers regarding maximization of
current assets for satisfying current liabilities (Cleary and Wang, 2017).
Tes c o
S ain s b u ry
0
0 .2
0 .4
0 .6
0 .8 0 .7 1 0 .7 6
0 .6 1 0 .6 6
C u rre n t ra tio
2 0 1 8 2 0 1 9
From the above ratio it can be interpreted that Sainsbury’s has high current ratio as
compared to Tesco in both years, 2018 and 2019. It indicates that ability of Sainsbury’s
regarding paying off short term loans or obligations is higher as compared to Tesco.
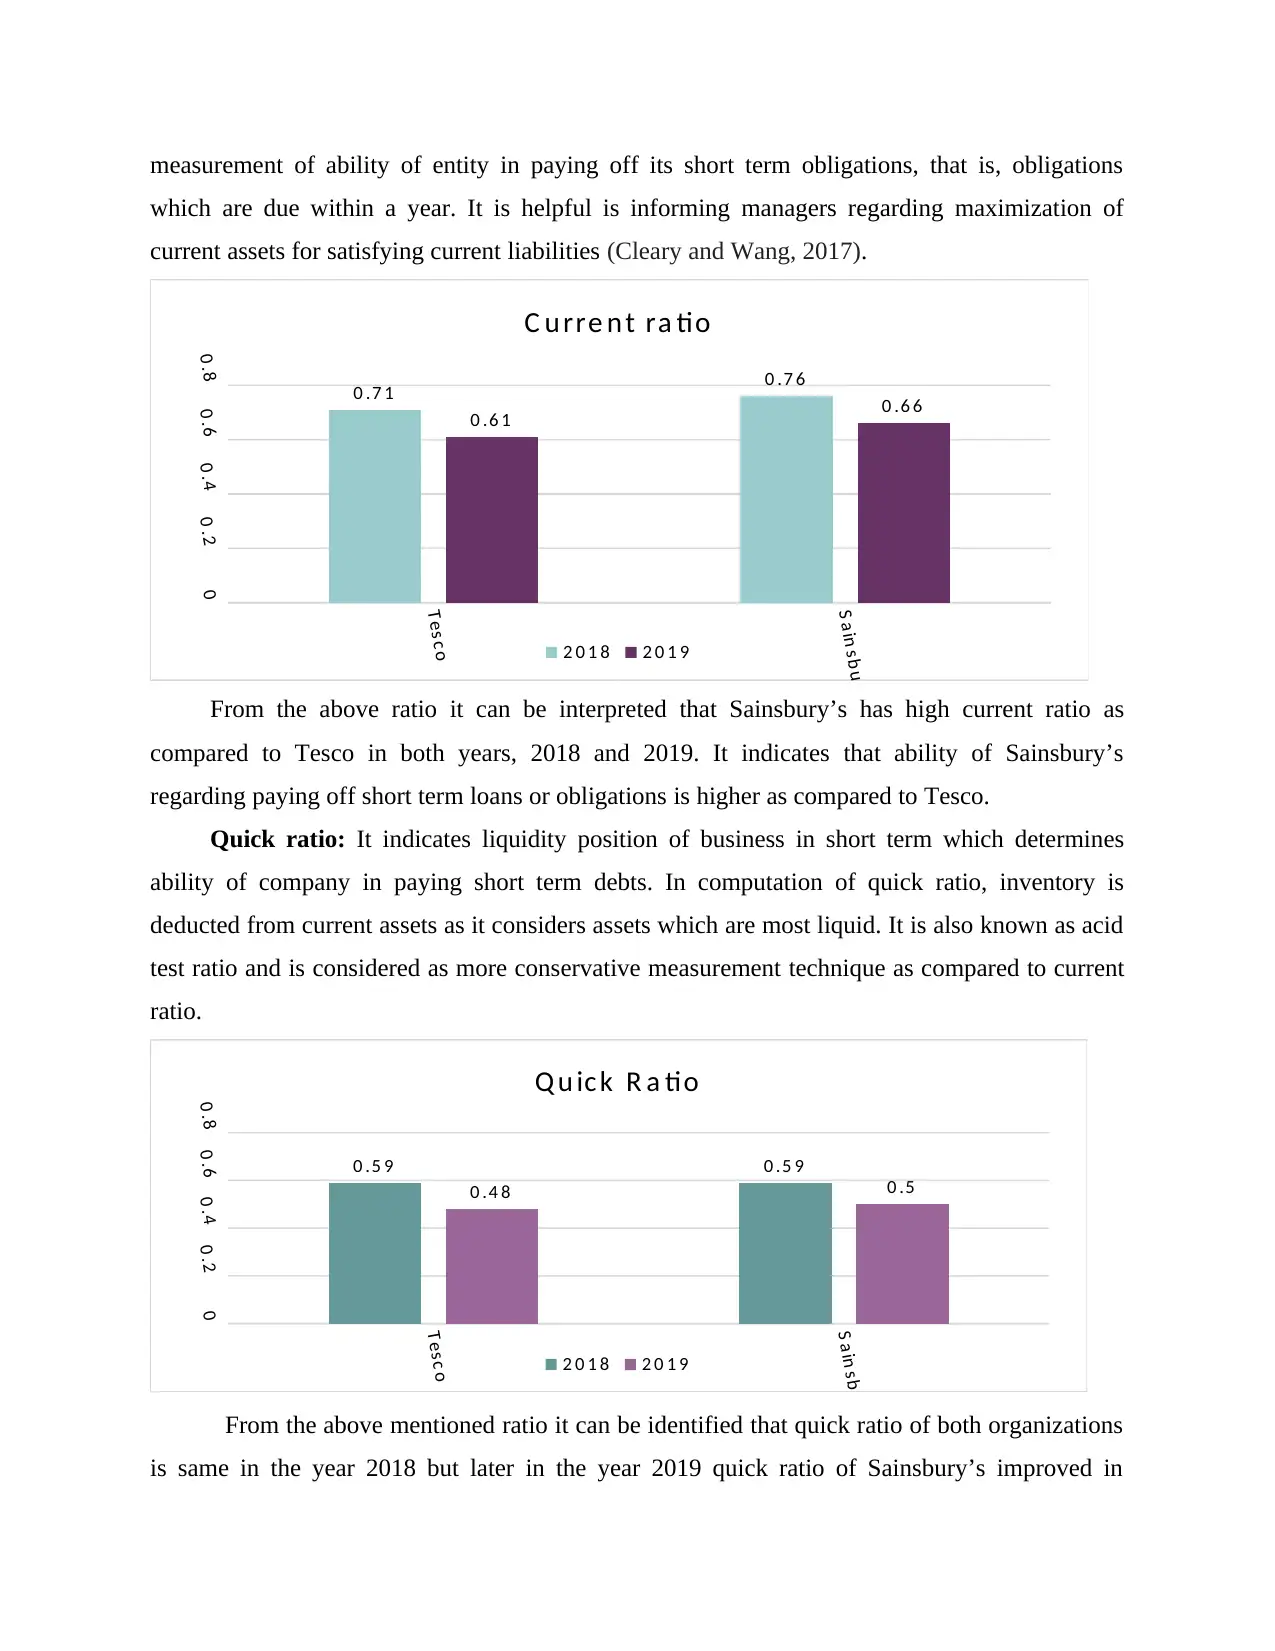
Quick ratio: It indicates liquidity position of business in short term which determines
ability of company in paying short term debts. In computation of quick ratio, inventory is
deducted from current assets as it considers assets which are most liquid. It is also known as acid
test ratio and is considered as more conservative measurement technique as compared to current
ratio.
Tes c o
S a in s b u ry
00 .20 .40 .60 .8
0 .5 9 0 .5 9
0 .4 8 0 .5
Q u ic k R a tio
2 0 1 8 2 0 1 9
From the above mentioned ratio it can be identified that quick ratio of both organizations
is same in the year 2018 but later in the year 2019 quick ratio of Sainsbury’s improved in
which are due within a year. It is helpful is informing managers regarding maximization of
current assets for satisfying current liabilities (Cleary and Wang, 2017).
Tes c o
S ain s b u ry
0
0 .2
0 .4
0 .6
0 .8 0 .7 1 0 .7 6
0 .6 1 0 .6 6
C u rre n t ra tio
2 0 1 8 2 0 1 9
From the above ratio it can be interpreted that Sainsbury’s has high current ratio as
compared to Tesco in both years, 2018 and 2019. It indicates that ability of Sainsbury’s
regarding paying off short term loans or obligations is higher as compared to Tesco.
Quick ratio: It indicates liquidity position of business in short term which determines
ability of company in paying short term debts. In computation of quick ratio, inventory is
deducted from current assets as it considers assets which are most liquid. It is also known as acid
test ratio and is considered as more conservative measurement technique as compared to current
ratio.
Tes c o
S a in s b u ry
00 .20 .40 .60 .8
0 .5 9 0 .5 9
0 .4 8 0 .5
Q u ic k R a tio
2 0 1 8 2 0 1 9
From the above mentioned ratio it can be identified that quick ratio of both organizations
is same in the year 2018 but later in the year 2019 quick ratio of Sainsbury’s improved in
⊘ This is a preview!⊘
Do you want full access?
Subscribe today to unlock all pages.
Trusted by 1+ million students worldwide
comparison to Tesco. It showcases that liquidity position of former is better than later and
Sainsbury’s is highly efficient regarding debt payment in short run and maintains high liquidity
or cash flow for smooth functioning of business activities.
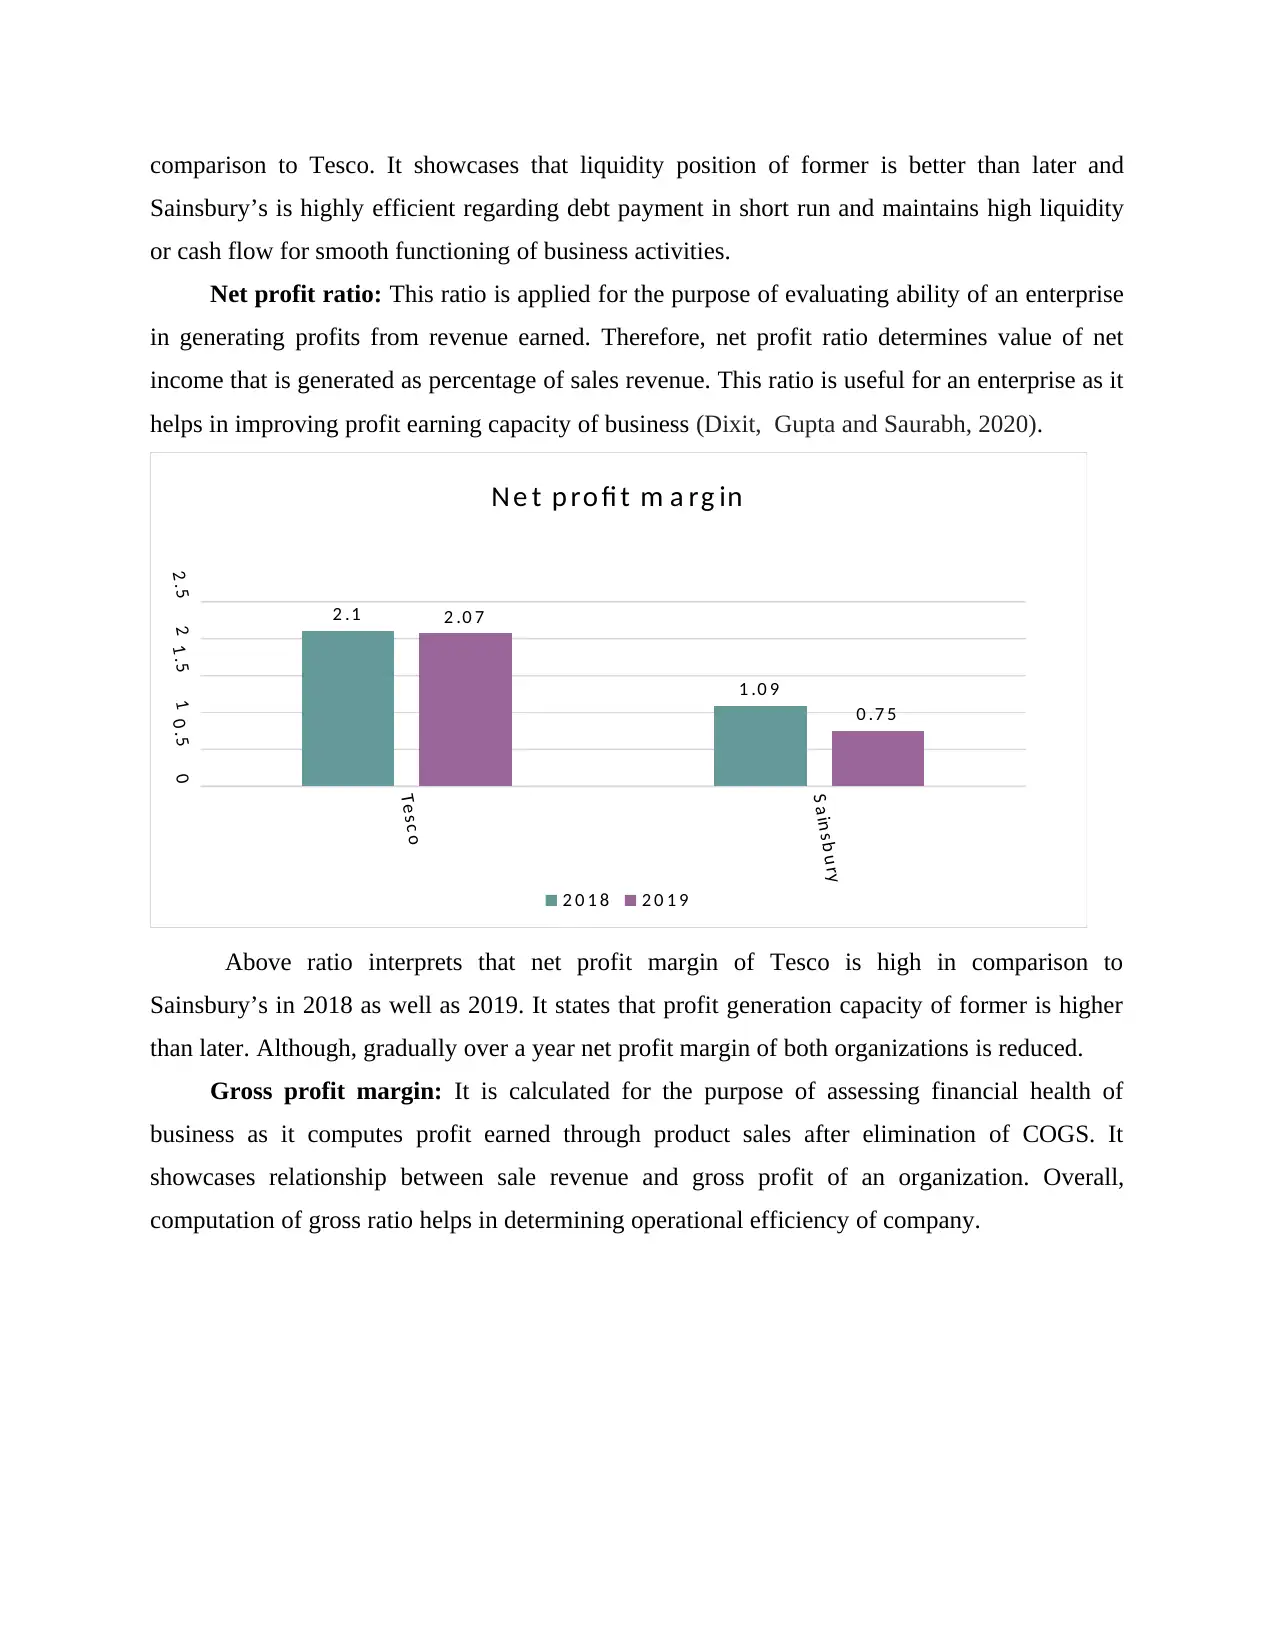
Net profit ratio: This ratio is applied for the purpose of evaluating ability of an enterprise
in generating profits from revenue earned. Therefore, net profit ratio determines value of net
income that is generated as percentage of sales revenue. This ratio is useful for an enterprise as it
helps in improving profit earning capacity of business (Dixit, Gupta and Saurabh, 2020).
Tes c o
S a in s b u ry
00 .511 .522 .5
2 .1
1 .0 9
2 .0 7
0 .7 5
N e t p ro fi t m a rg in
2 0 1 8 2 0 1 9
Above ratio interprets that net profit margin of Tesco is high in comparison to
Sainsbury’s in 2018 as well as 2019. It states that profit generation capacity of former is higher
than later. Although, gradually over a year net profit margin of both organizations is reduced.
Gross profit margin: It is calculated for the purpose of assessing financial health of
business as it computes profit earned through product sales after elimination of COGS. It
showcases relationship between sale revenue and gross profit of an organization. Overall,
computation of gross ratio helps in determining operational efficiency of company.
Sainsbury’s is highly efficient regarding debt payment in short run and maintains high liquidity
or cash flow for smooth functioning of business activities.
Net profit ratio: This ratio is applied for the purpose of evaluating ability of an enterprise
in generating profits from revenue earned. Therefore, net profit ratio determines value of net
income that is generated as percentage of sales revenue. This ratio is useful for an enterprise as it
helps in improving profit earning capacity of business (Dixit, Gupta and Saurabh, 2020).
Tes c o
S a in s b u ry
00 .511 .522 .5
2 .1
1 .0 9
2 .0 7
0 .7 5
N e t p ro fi t m a rg in
2 0 1 8 2 0 1 9
Above ratio interprets that net profit margin of Tesco is high in comparison to
Sainsbury’s in 2018 as well as 2019. It states that profit generation capacity of former is higher
than later. Although, gradually over a year net profit margin of both organizations is reduced.
Gross profit margin: It is calculated for the purpose of assessing financial health of
business as it computes profit earned through product sales after elimination of COGS. It
showcases relationship between sale revenue and gross profit of an organization. Overall,
computation of gross ratio helps in determining operational efficiency of company.
Paraphrase This Document
Need a fresh take? Get an instant paraphrase of this document with our AI Paraphraser
Tes c o
S a in s b u ry
5
6
7
8
5 .8 3
6 .6 16 .4 8
6 .9 2
G ro s s p ro fi t m a rg in
2 0 1 8 2 0 1 9
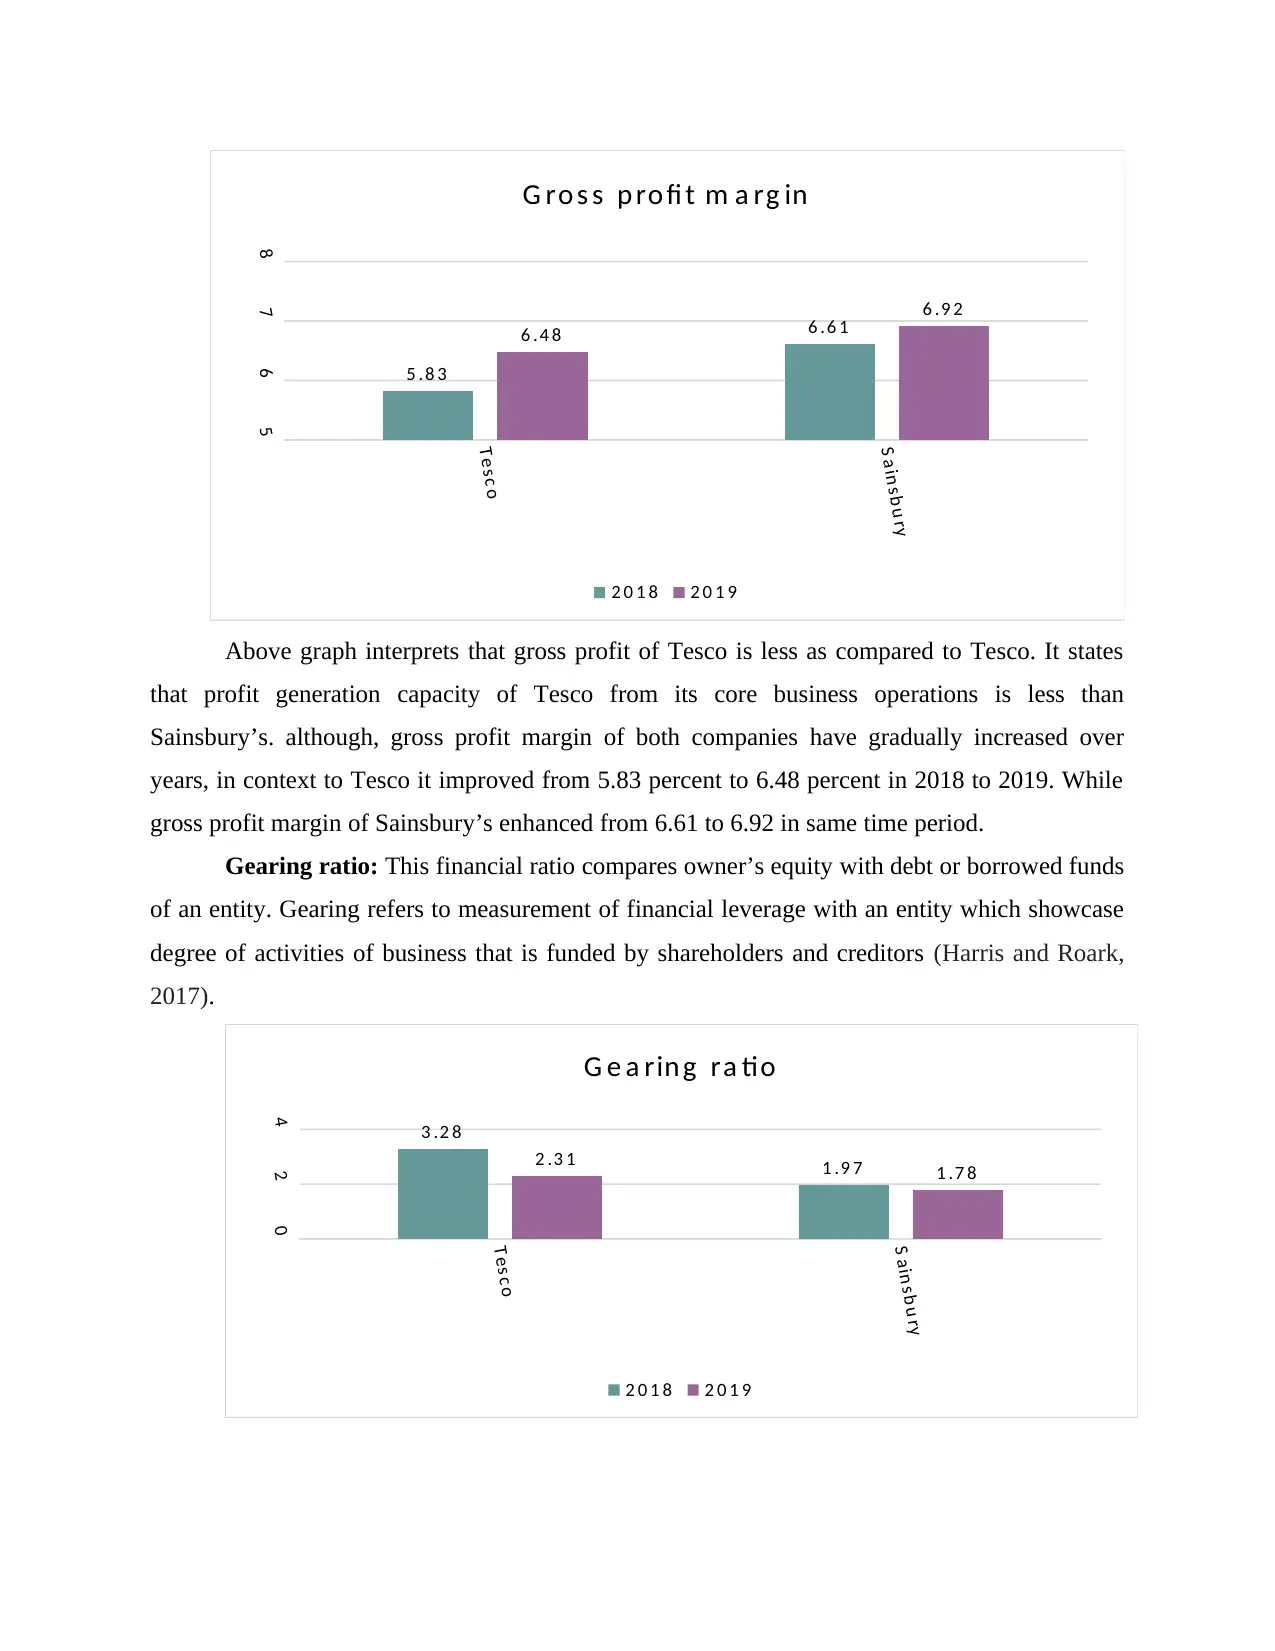
Above graph interprets that gross profit of Tesco is less as compared to Tesco. It states
that profit generation capacity of Tesco from its core business operations is less than
Sainsbury’s. although, gross profit margin of both companies have gradually increased over
years, in context to Tesco it improved from 5.83 percent to 6.48 percent in 2018 to 2019. While
gross profit margin of Sainsbury’s enhanced from 6.61 to 6.92 in same time period.
Gearing ratio: This financial ratio compares owner’s equity with debt or borrowed funds
of an entity. Gearing refers to measurement of financial leverage with an entity which showcase
degree of activities of business that is funded by shareholders and creditors (Harris and Roark,
2017).
Tes c o
S ain s b u ry
0
2
4 3 .2 8
1 .9 72 .3 1 1 .7 8
G e a rin g ra tio
2 0 1 8 2 0 1 9
S a in s b u ry
5
6
7
8
5 .8 3
6 .6 16 .4 8
6 .9 2
G ro s s p ro fi t m a rg in
2 0 1 8 2 0 1 9
Above graph interprets that gross profit of Tesco is less as compared to Tesco. It states
that profit generation capacity of Tesco from its core business operations is less than
Sainsbury’s. although, gross profit margin of both companies have gradually increased over
years, in context to Tesco it improved from 5.83 percent to 6.48 percent in 2018 to 2019. While
gross profit margin of Sainsbury’s enhanced from 6.61 to 6.92 in same time period.
Gearing ratio: This financial ratio compares owner’s equity with debt or borrowed funds
of an entity. Gearing refers to measurement of financial leverage with an entity which showcase
degree of activities of business that is funded by shareholders and creditors (Harris and Roark,
2017).
Tes c o
S ain s b u ry
0
2
4 3 .2 8
1 .9 72 .3 1 1 .7 8
G e a rin g ra tio
2 0 1 8 2 0 1 9
From the above report it can be concluded that gearing ratio of Tesco is higher in
comparison to Sainsbury’s in 2018 as well as 2019. It shows that proportion of debt in Tesco is
high as compared to Sainsbury’s. Hence, financial risk associated in Tesco is higher.
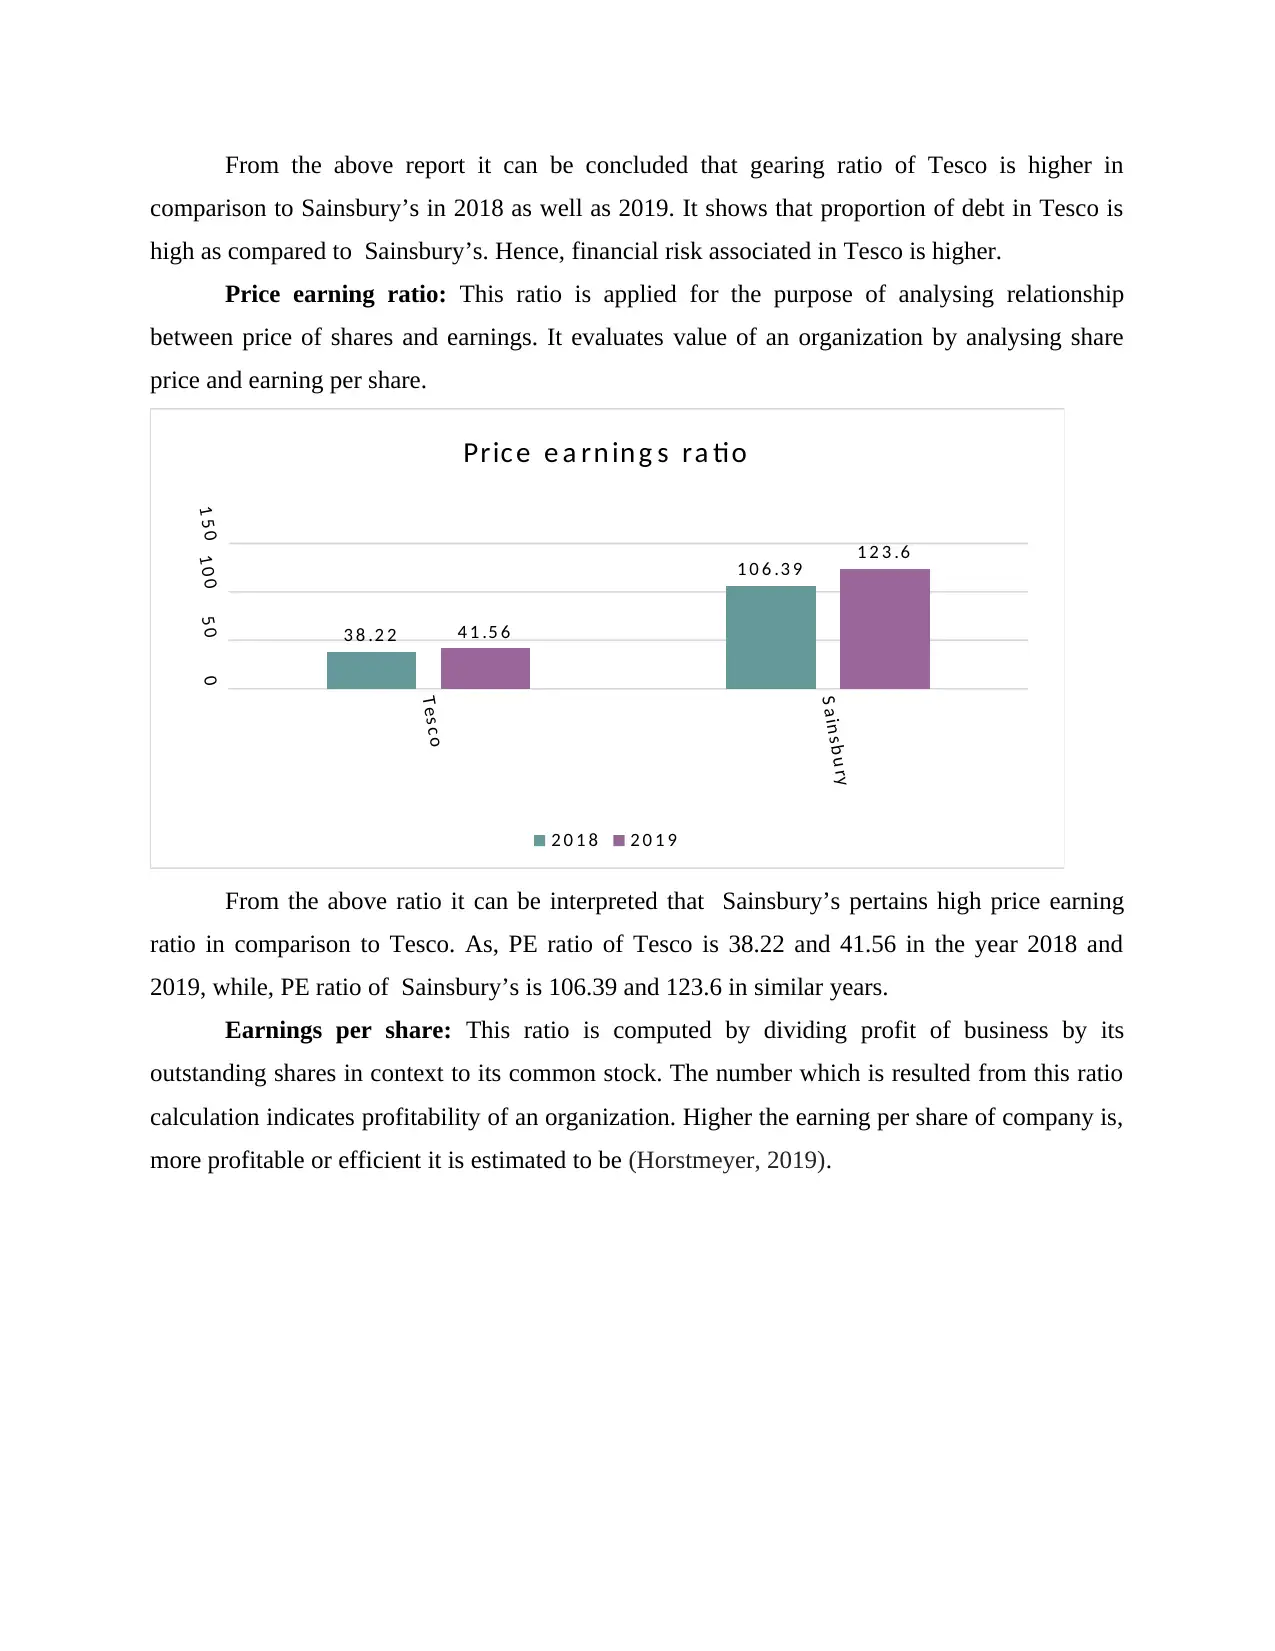
Price earning ratio: This ratio is applied for the purpose of analysing relationship
between price of shares and earnings. It evaluates value of an organization by analysing share
price and earning per share.
Tes c o
S a in s b u ry
05 01 0 01 5 0
3 8 .2 2
1 0 6 .3 9
4 1 .5 6
1 2 3 .6
Pric e e a rn in g s ra tio
2 0 1 8 2 0 1 9
From the above ratio it can be interpreted that Sainsbury’s pertains high price earning
ratio in comparison to Tesco. As, PE ratio of Tesco is 38.22 and 41.56 in the year 2018 and
2019, while, PE ratio of Sainsbury’s is 106.39 and 123.6 in similar years.
Earnings per share: This ratio is computed by dividing profit of business by its
outstanding shares in context to its common stock. The number which is resulted from this ratio
calculation indicates profitability of an organization. Higher the earning per share of company is,
more profitable or efficient it is estimated to be (Horstmeyer, 2019).
comparison to Sainsbury’s in 2018 as well as 2019. It shows that proportion of debt in Tesco is
high as compared to Sainsbury’s. Hence, financial risk associated in Tesco is higher.
Price earning ratio: This ratio is applied for the purpose of analysing relationship
between price of shares and earnings. It evaluates value of an organization by analysing share
price and earning per share.
Tes c o
S a in s b u ry
05 01 0 01 5 0
3 8 .2 2
1 0 6 .3 9
4 1 .5 6
1 2 3 .6
Pric e e a rn in g s ra tio
2 0 1 8 2 0 1 9
From the above ratio it can be interpreted that Sainsbury’s pertains high price earning
ratio in comparison to Tesco. As, PE ratio of Tesco is 38.22 and 41.56 in the year 2018 and
2019, while, PE ratio of Sainsbury’s is 106.39 and 123.6 in similar years.
Earnings per share: This ratio is computed by dividing profit of business by its
outstanding shares in context to its common stock. The number which is resulted from this ratio
calculation indicates profitability of an organization. Higher the earning per share of company is,
more profitable or efficient it is estimated to be (Horstmeyer, 2019).
⊘ This is a preview!⊘
Do you want full access?
Subscribe today to unlock all pages.
Trusted by 1+ million students worldwide
Tes c o
S a in s b u ry
01234567
4 .9 6 4 .7 5
6 .1 4
4 .0 6
E a rn in g s p e r s h a re
2 0 1 8 2 0 1 9
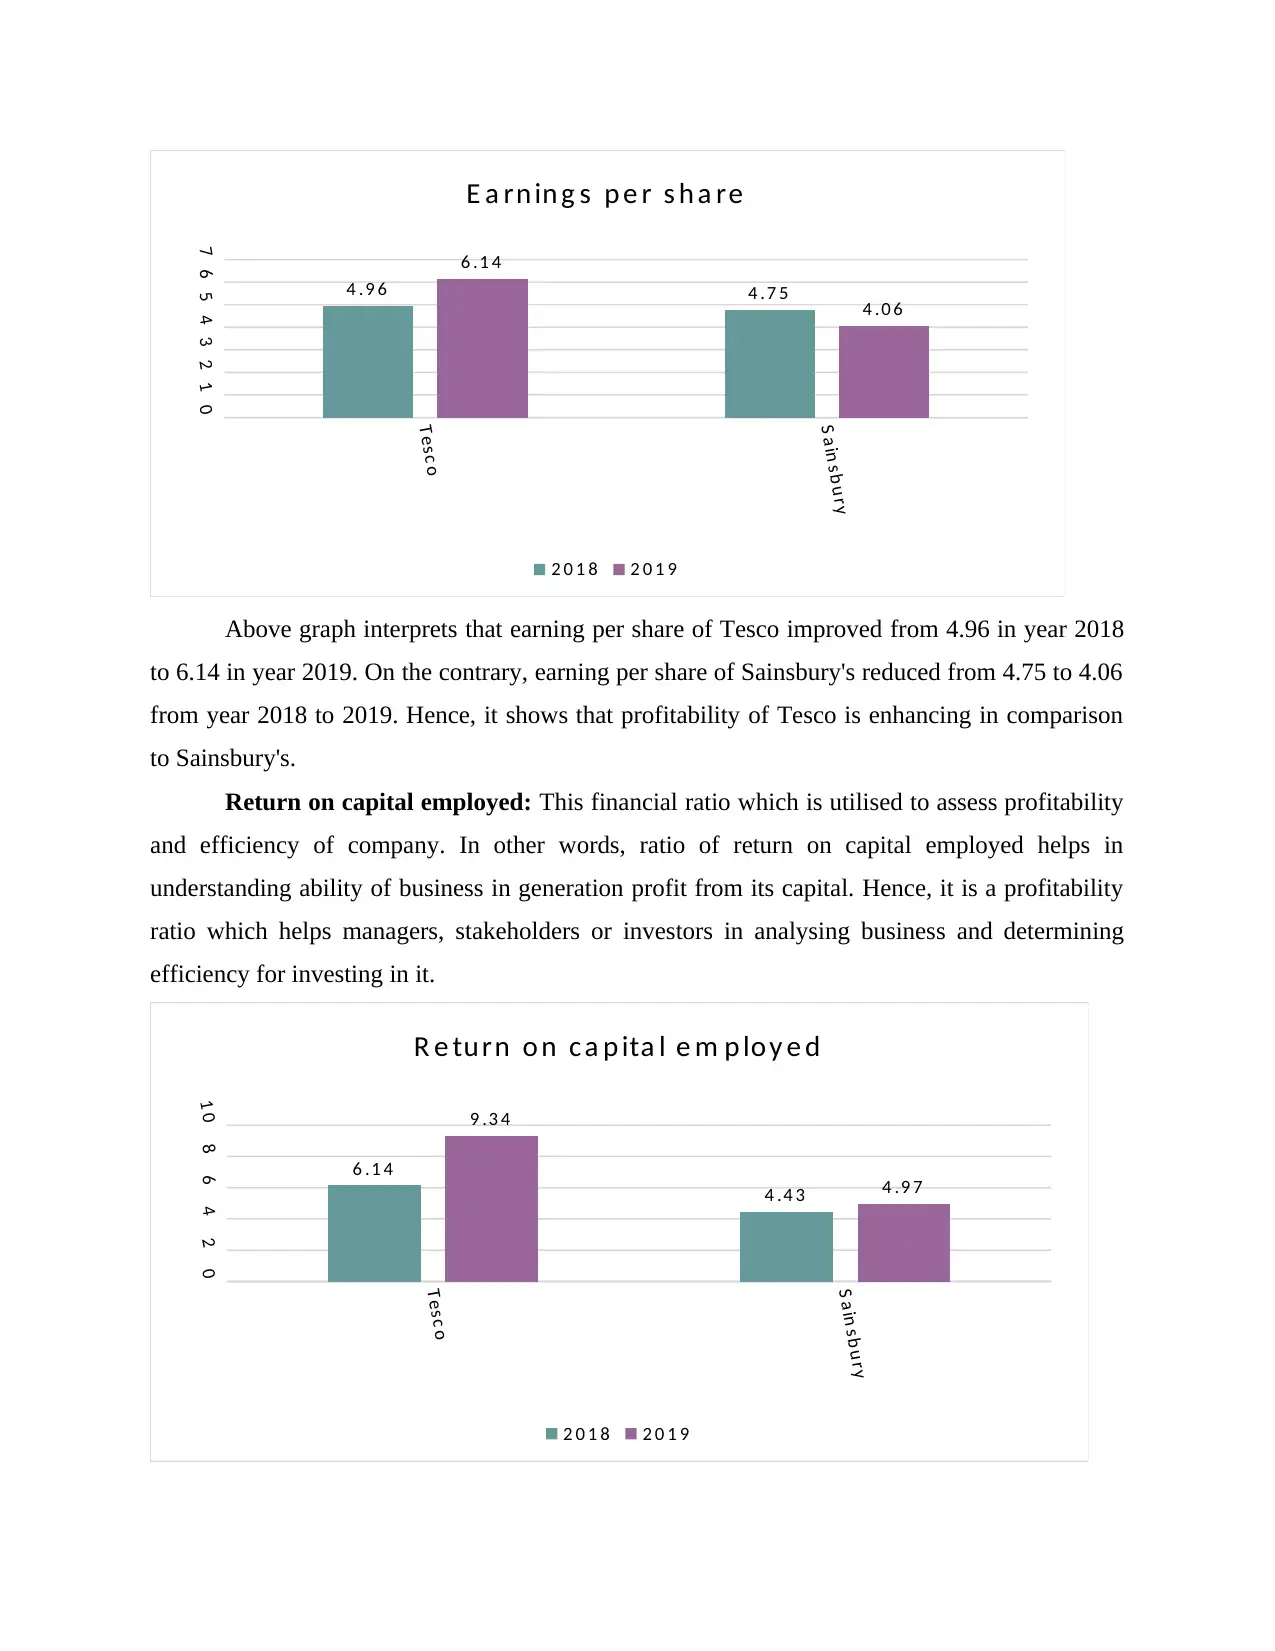
Above graph interprets that earning per share of Tesco improved from 4.96 in year 2018
to 6.14 in year 2019. On the contrary, earning per share of Sainsbury's reduced from 4.75 to 4.06
from year 2018 to 2019. Hence, it shows that profitability of Tesco is enhancing in comparison
to Sainsbury's.
Return on capital employed: This financial ratio which is utilised to assess profitability
and efficiency of company. In other words, ratio of return on capital employed helps in
understanding ability of business in generation profit from its capital. Hence, it is a profitability
ratio which helps managers, stakeholders or investors in analysing business and determining
efficiency for investing in it.
Tes c o
S ain s b u ry
024681 0
6 .1 4
4 .4 3
9 .3 4
4 .9 7
R e tu rn o n c a p ita l e m p lo y e d
2 0 1 8 2 0 1 9
S a in s b u ry
01234567
4 .9 6 4 .7 5
6 .1 4
4 .0 6
E a rn in g s p e r s h a re
2 0 1 8 2 0 1 9
Above graph interprets that earning per share of Tesco improved from 4.96 in year 2018
to 6.14 in year 2019. On the contrary, earning per share of Sainsbury's reduced from 4.75 to 4.06
from year 2018 to 2019. Hence, it shows that profitability of Tesco is enhancing in comparison
to Sainsbury's.
Return on capital employed: This financial ratio which is utilised to assess profitability
and efficiency of company. In other words, ratio of return on capital employed helps in
understanding ability of business in generation profit from its capital. Hence, it is a profitability
ratio which helps managers, stakeholders or investors in analysing business and determining
efficiency for investing in it.
Tes c o
S ain s b u ry
024681 0
6 .1 4
4 .4 3
9 .3 4
4 .9 7
R e tu rn o n c a p ita l e m p lo y e d
2 0 1 8 2 0 1 9
Paraphrase This Document
Need a fresh take? Get an instant paraphrase of this document with our AI Paraphraser
Above ratio states that Tesco gains more return on capital employed as compared to
Sainsbury's. Hence, it can be interpreted that Tesco uses its capital in better way as compared to
Sainsbury's in context to generation of income or profit.
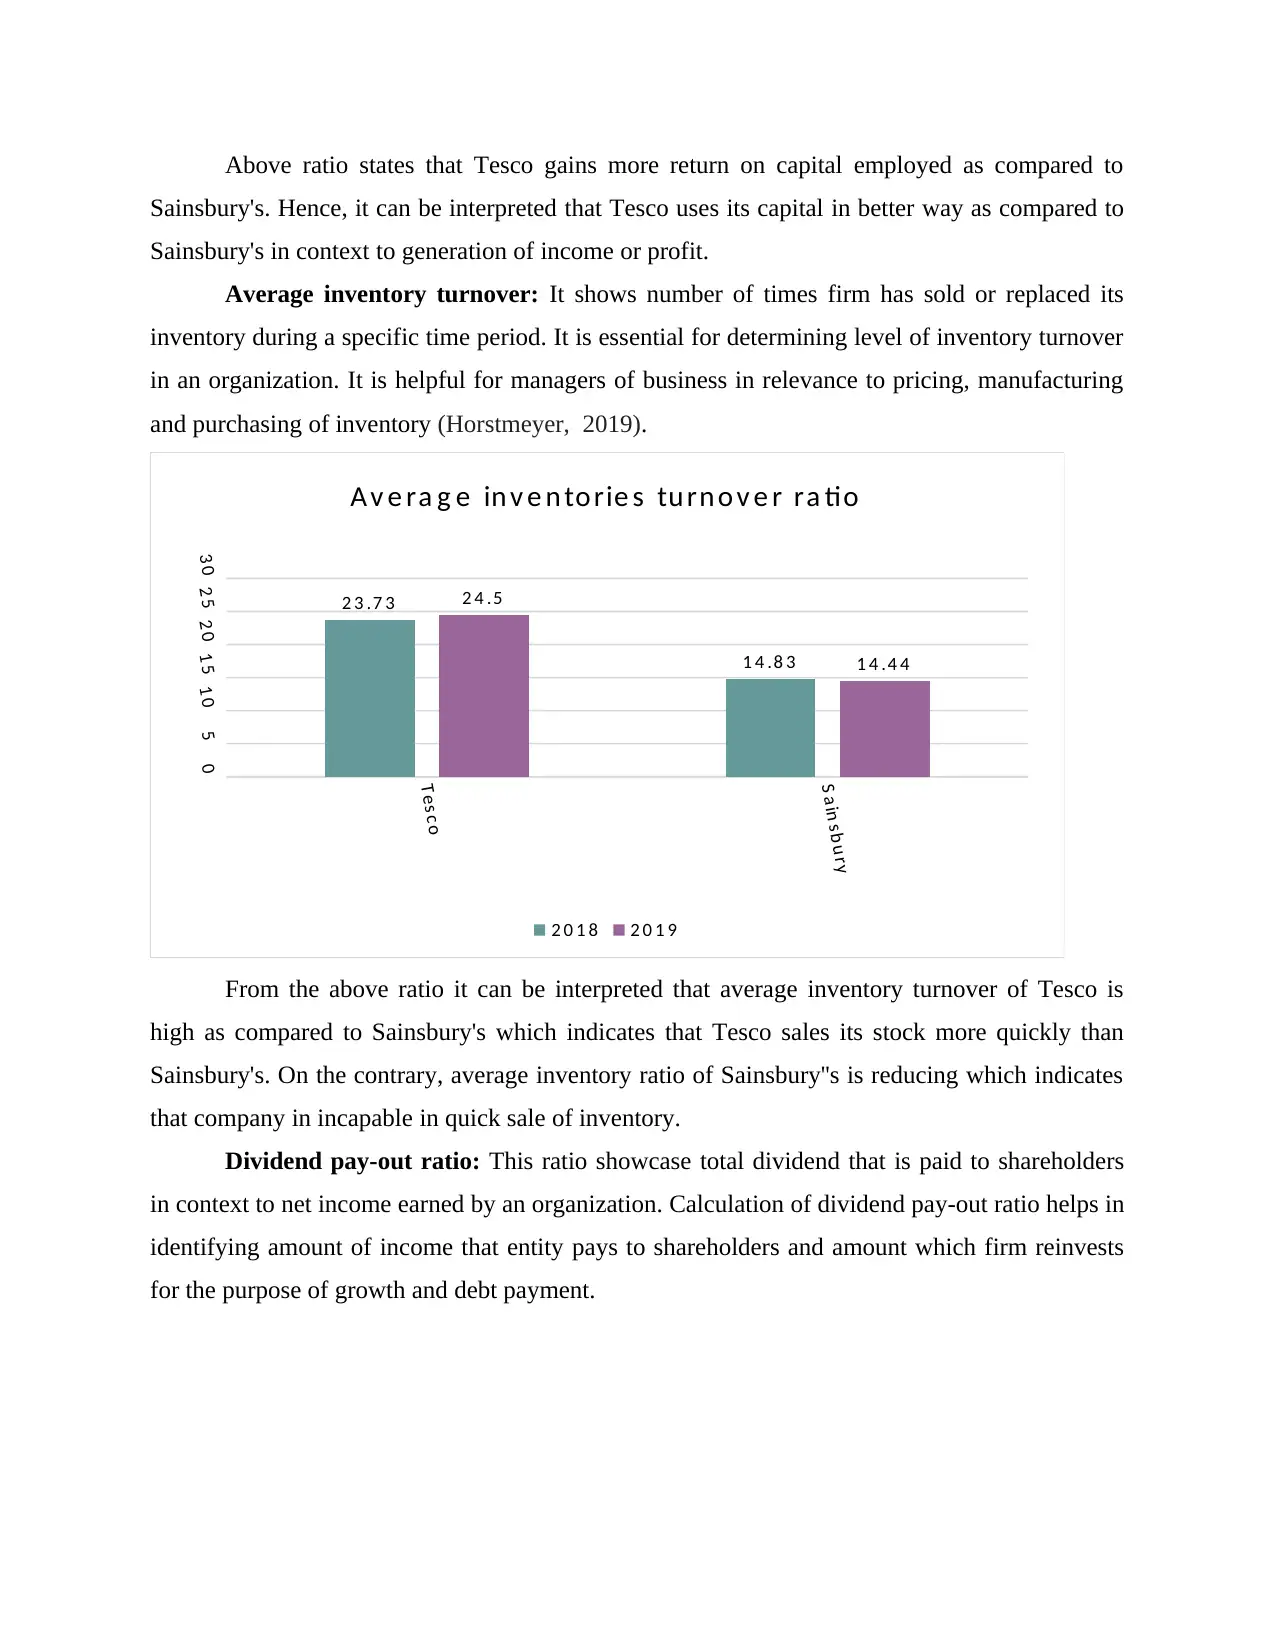
Average inventory turnover: It shows number of times firm has sold or replaced its
inventory during a specific time period. It is essential for determining level of inventory turnover
in an organization. It is helpful for managers of business in relevance to pricing, manufacturing
and purchasing of inventory (Horstmeyer, 2019).
Tes c o
S a in s b u ry
051 01 52 02 53 0
2 3 .7 3
1 4 .8 3
2 4 .5
1 4 .4 4
A v e ra g e in v e n to rie s tu rn o v e r ra tio
2 0 1 8 2 0 1 9
From the above ratio it can be interpreted that average inventory turnover of Tesco is
high as compared to Sainsbury's which indicates that Tesco sales its stock more quickly than
Sainsbury's. On the contrary, average inventory ratio of Sainsbury''s is reducing which indicates
that company in incapable in quick sale of inventory.
Dividend pay-out ratio: This ratio showcase total dividend that is paid to shareholders
in context to net income earned by an organization. Calculation of dividend pay-out ratio helps in
identifying amount of income that entity pays to shareholders and amount which firm reinvests
for the purpose of growth and debt payment.
Sainsbury's. Hence, it can be interpreted that Tesco uses its capital in better way as compared to
Sainsbury's in context to generation of income or profit.
Average inventory turnover: It shows number of times firm has sold or replaced its
inventory during a specific time period. It is essential for determining level of inventory turnover
in an organization. It is helpful for managers of business in relevance to pricing, manufacturing
and purchasing of inventory (Horstmeyer, 2019).
Tes c o
S a in s b u ry
051 01 52 02 53 0
2 3 .7 3
1 4 .8 3
2 4 .5
1 4 .4 4
A v e ra g e in v e n to rie s tu rn o v e r ra tio
2 0 1 8 2 0 1 9
From the above ratio it can be interpreted that average inventory turnover of Tesco is
high as compared to Sainsbury's which indicates that Tesco sales its stock more quickly than
Sainsbury's. On the contrary, average inventory ratio of Sainsbury''s is reducing which indicates
that company in incapable in quick sale of inventory.
Dividend pay-out ratio: This ratio showcase total dividend that is paid to shareholders
in context to net income earned by an organization. Calculation of dividend pay-out ratio helps in
identifying amount of income that entity pays to shareholders and amount which firm reinvests
for the purpose of growth and debt payment.
Tes c o
S a in s b u ry
0
5 0
1 0 0
1 5 0
6 .7 8
7 6 .0 5
2 7 .0 5
1 1 2 .7 9
D iv id e n d p a y o u t ra tio
2 0 1 8 2 0 1 9
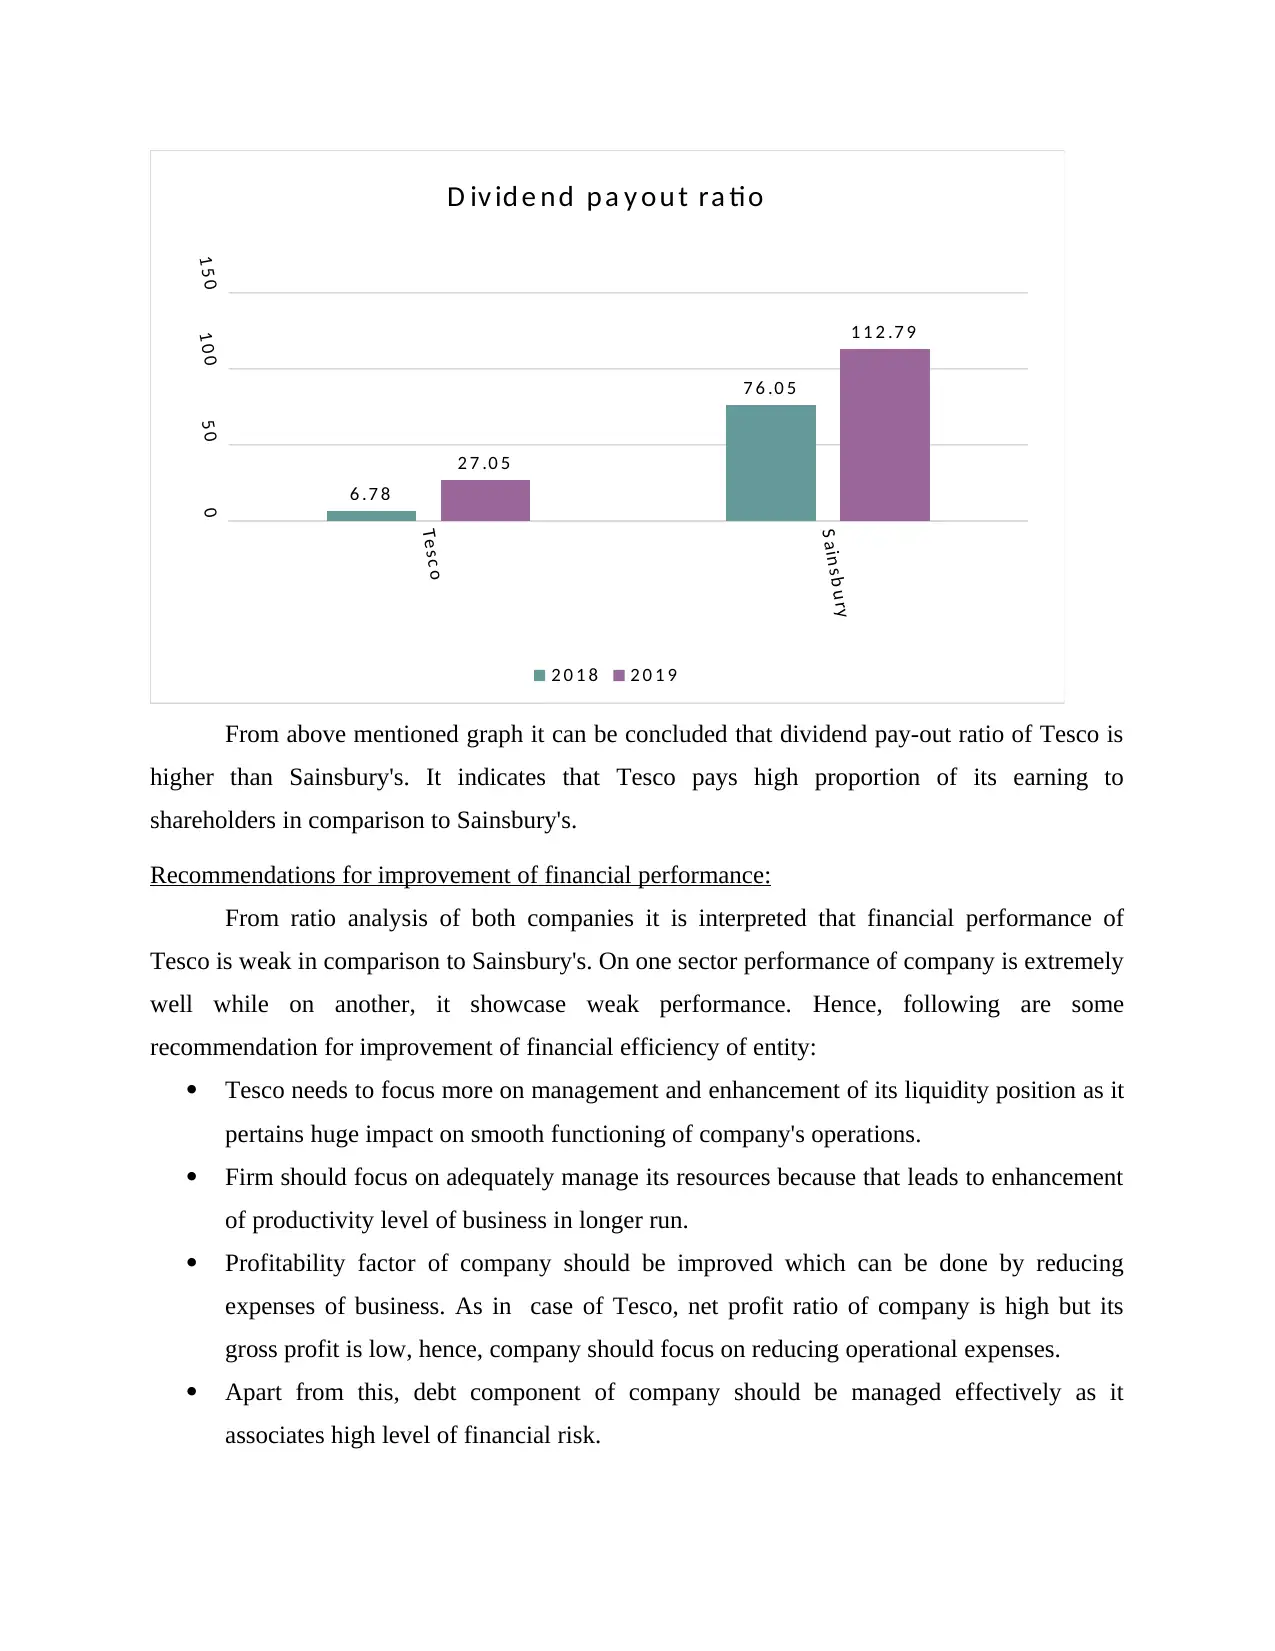
From above mentioned graph it can be concluded that dividend pay-out ratio of Tesco is
higher than Sainsbury's. It indicates that Tesco pays high proportion of its earning to
shareholders in comparison to Sainsbury's.
Recommendations for improvement of financial performance:
From ratio analysis of both companies it is interpreted that financial performance of
Tesco is weak in comparison to Sainsbury's. On one sector performance of company is extremely
well while on another, it showcase weak performance. Hence, following are some
recommendation for improvement of financial efficiency of entity:
Tesco needs to focus more on management and enhancement of its liquidity position as it
pertains huge impact on smooth functioning of company's operations.
Firm should focus on adequately manage its resources because that leads to enhancement
of productivity level of business in longer run.
Profitability factor of company should be improved which can be done by reducing
expenses of business. As in case of Tesco, net profit ratio of company is high but its
gross profit is low, hence, company should focus on reducing operational expenses.
Apart from this, debt component of company should be managed effectively as it
associates high level of financial risk.
S a in s b u ry
0
5 0
1 0 0
1 5 0
6 .7 8
7 6 .0 5
2 7 .0 5
1 1 2 .7 9
D iv id e n d p a y o u t ra tio
2 0 1 8 2 0 1 9
From above mentioned graph it can be concluded that dividend pay-out ratio of Tesco is
higher than Sainsbury's. It indicates that Tesco pays high proportion of its earning to
shareholders in comparison to Sainsbury's.
Recommendations for improvement of financial performance:
From ratio analysis of both companies it is interpreted that financial performance of
Tesco is weak in comparison to Sainsbury's. On one sector performance of company is extremely
well while on another, it showcase weak performance. Hence, following are some
recommendation for improvement of financial efficiency of entity:
Tesco needs to focus more on management and enhancement of its liquidity position as it
pertains huge impact on smooth functioning of company's operations.
Firm should focus on adequately manage its resources because that leads to enhancement
of productivity level of business in longer run.
Profitability factor of company should be improved which can be done by reducing
expenses of business. As in case of Tesco, net profit ratio of company is high but its
gross profit is low, hence, company should focus on reducing operational expenses.
Apart from this, debt component of company should be managed effectively as it
associates high level of financial risk.
⊘ This is a preview!⊘
Do you want full access?
Subscribe today to unlock all pages.
Trusted by 1+ million students worldwide
1 out of 17
Related Documents


Your All-in-One AI-Powered Toolkit for Academic Success.
+13062052269
info@desklib.com
Available 24*7 on WhatsApp / Email
![[object Object]](/_next/static/media/star-bottom.7253800d.svg)
Unlock your academic potential
Copyright © 2020–2026 A2Z Services. All Rights Reserved. Developed and managed by ZUCOL.